
Low-cost hosted open-source data monitoring solution so
devs can stop worrying about servers and spend time building.
Powered by Hosted Graphite, MetricFire provides affordable dashboards that integrate with your systems.
Server costs, setup, troubleshooting, and server management make DIY monitoring solutions difficult. With Hosted Graphite, we handle those issues.

Your application and system have a lot of metrics to monitor which is overwhelming. Our dashboards are simple where it doesn't matter how many metrics you have. They are easy to understand and quick to find.
Your system does not fit a one-size-fits-all solution. With Hosted Graphite, create custom dashboards and system metrics through your code.
Our pricing is based on per unique time series metric name. 1 metric is 1 metric. We also don’t charge extra for users, integrations, or sharing your dashboards.
With Hosted Graphite from MetricFire, startups to high-performing DevOps teams can easily analyze shareable dashboards, create custom time series metrics, and receive responsive alerting with reliable support at fraction of the cost of a full-time employee.


Pricing based on unique time series metrics. 1 metric is 1 metric.

Easily share your dashboards with clients for free.

Alert notification integrations PagerDuty, Slack, email, and webhooks.

Custom metrics through your code.

Highly available support to get you setup quickly.

Dedicated clusters for users that need their own environment.


Connect with us about using our hosted monitoring platform for insight into your entire Infrastructure.
Schedule Meeting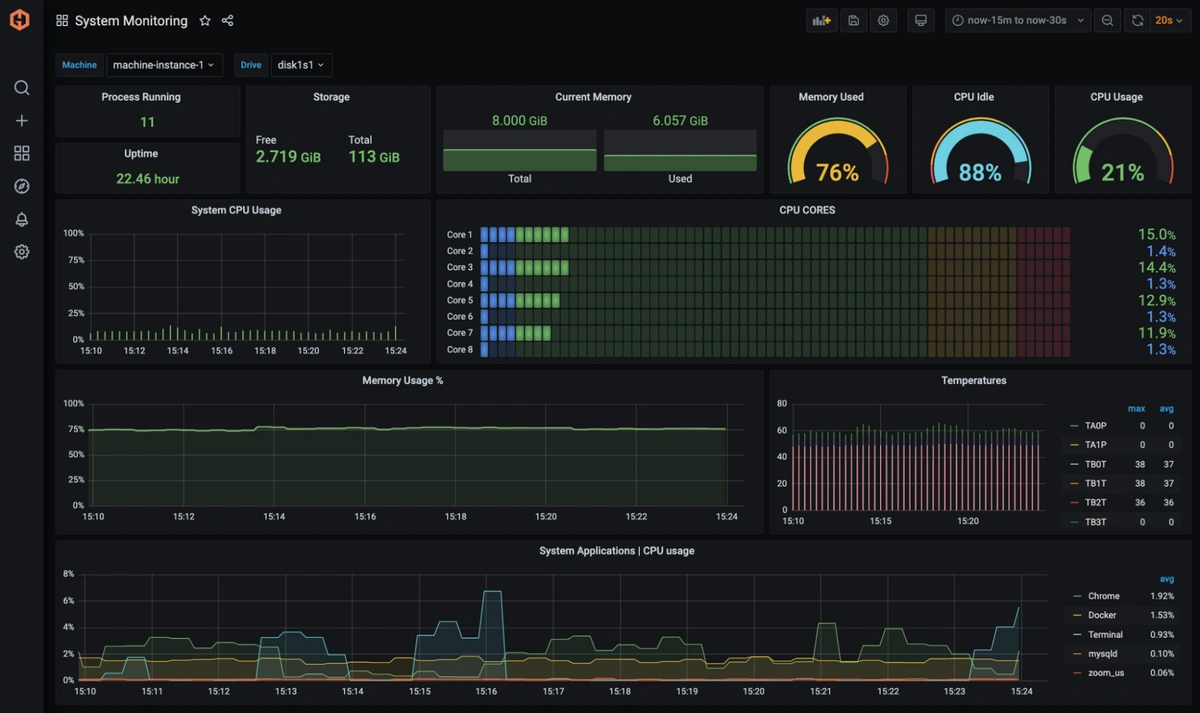

CPU, memory, storage, process

AWS, Heroku, Azure, Google Cloud

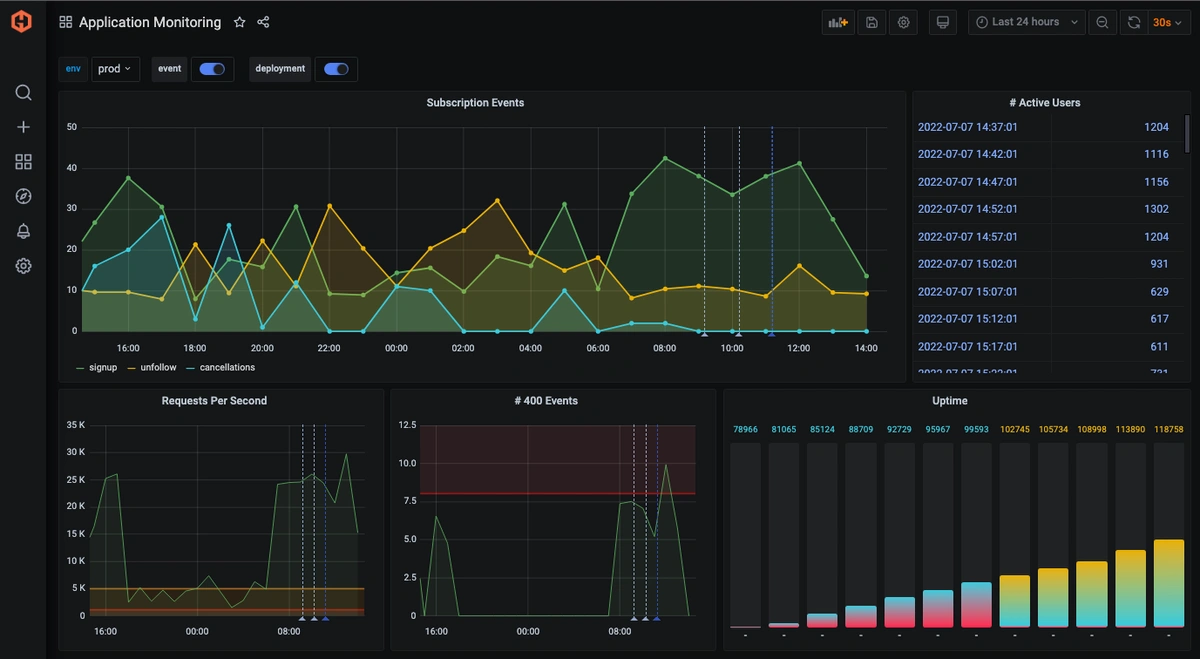
Queries, performance, availability, workload

SNMP metrics, switches, bandwidth, and errors


Graphite is an industry-standard open-source monitoring solution that is easy to learn. We are happy to schedule a call to get you up and running.
“We now have over ten times the amount of metrics we started with, and on different accounts. One of the great things about MetricFire is that scaling to support this increase has been hassle-free, requiring no additional work on our side.”

“There’s complete transparency with everything MetricFire do which means we can accurately predict what we’ll be spending and comfortably keep within our budget.”

"Every time I have a question, I get an answer from support after just a couple of hours. Their technical knowledge is excellent.”

“Building and managing an on-premise installation at this scale would require a lot of engineer time, especially in the first year...we use this engineering time to work on initiatives closer to our core business”


Because our system is your system.