Table of Contents
Introduction
In this article, we will see how we can integrate an Azure data source with Graphite and Grafana. This will allow us to monitor metrics from the applications hosted in the Azure cloud on a Grafana dashboard. We will also see how to integrate Azure Active Directory with MetricFire’s Hosted Graphite and Grafana.
You don’t need fully functional cloud services running with Azure to understand this article, but it assumes that you have basic familiarity with Azure Cloud.
To follow along with this blog, you should sign up for MetricFire's free trial.
Key Takeaways
-
How to monitor Azure cloud applications using Grafana by integrating an Azure data source with Graphite and Grafana.
-
Azure Monitor is built-in but lacks powerful visualization and customization tools. Grafana and Graphite, which are open-source and free, are preferred by many users.
-
How to configure the Azure Monitor data source in Grafana, including using service principals and providing necessary details.
-
How to create Grafana dashboards with Azure metrics by selecting appropriate namespaces and metrics for different Azure resources.
-
Azure Active Directory enables seamless authentication across multiple services.
What is Azure?
Azure Cloud is one of the most popular platforms for building and deploying cloud applications. Azure provides all the major features of cloud services such as Compute, Storage, Content Delivery Network (CDN), Domain Name Service (DNS), Blog Storage, and Queue Messaging. Launched in 2010, Azure has multiple data centers around the world.
Azure has a built-in monitoring product called Azure Monitor. However, its visualization and customization tools are not as powerful as Grafana. That’s why many users prefer Grafana as their monitoring and visualization solution even though Azure Monitor is built into the Azure cloud.
The other aspect is the pricing of Azure Monitor. Grafana and Graphite are open-source solutions free of cost whereas Azure Monitor comes under the category of proprietary software.
Getting Started with Azure Cloud
If you have not done so already, sign up for a new account at https://portal.azure.com/. As of June 2020, Azure provides $200 credit for 30 days and 12 months of free products. The only catch is that the free products included in this offer are restricted to some of the products and Azure Monitor is not included. The Azure monitor is a key product, which we will be covering in this article later on.
Once logged in, you will be presented with a home screen as follows:
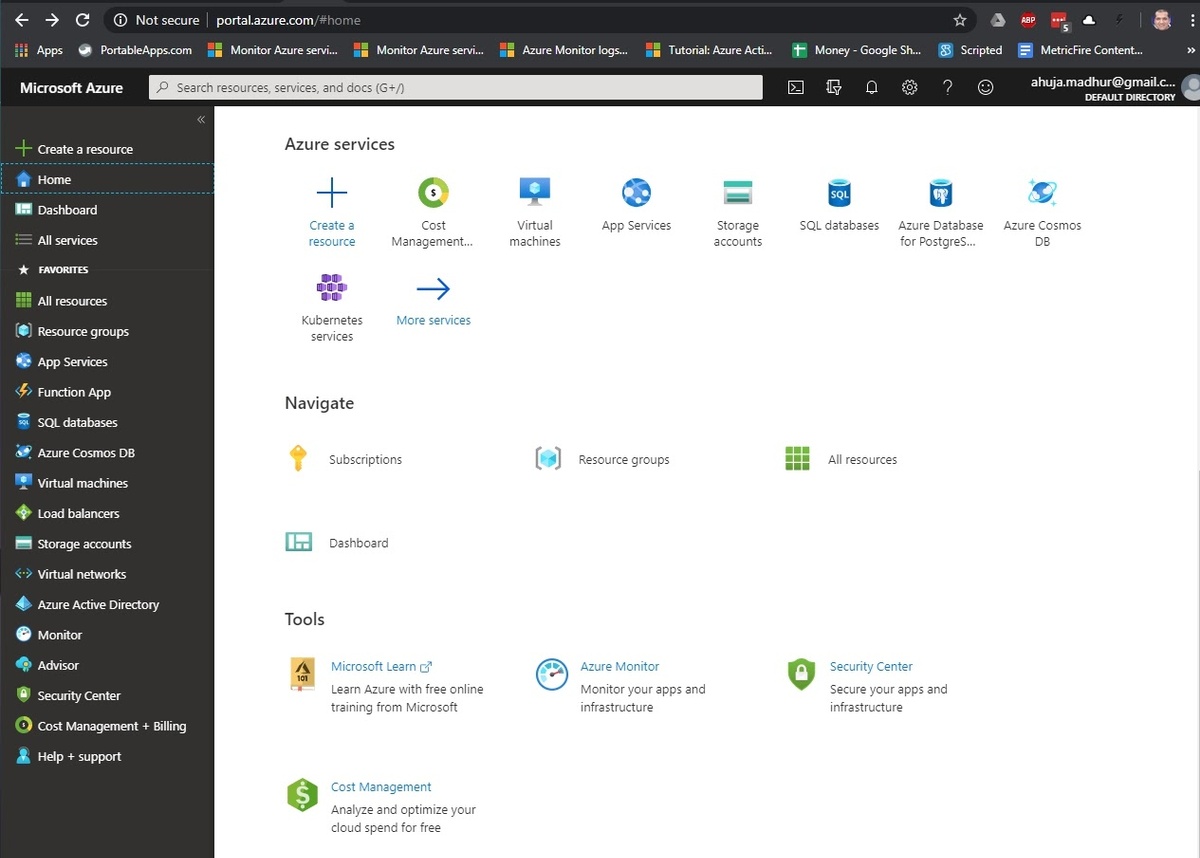
We will now provision Grafana in our Azure cloud. Click on “Create a resource” and provision the Grafana instance on our Azure cloud.
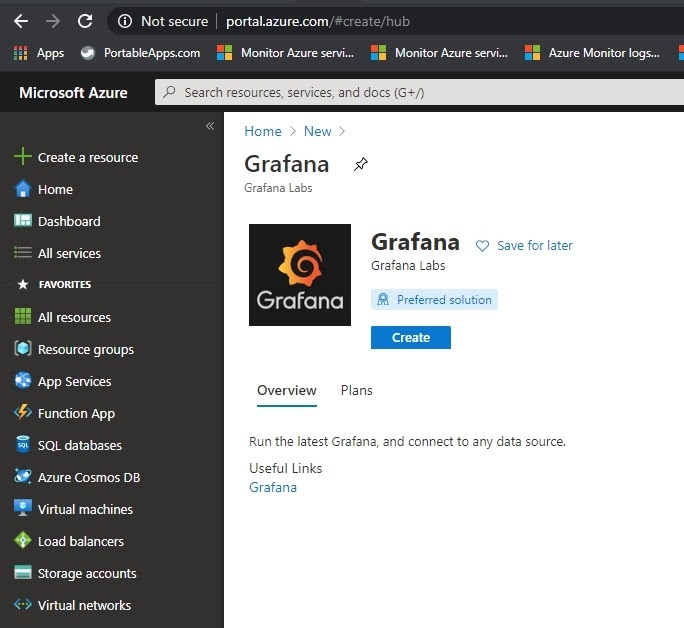
Fill in the details like VM username and password and Grafana server admin password. We will choose a suitable VM size, storage account, and default network configuration settings and hit Create.
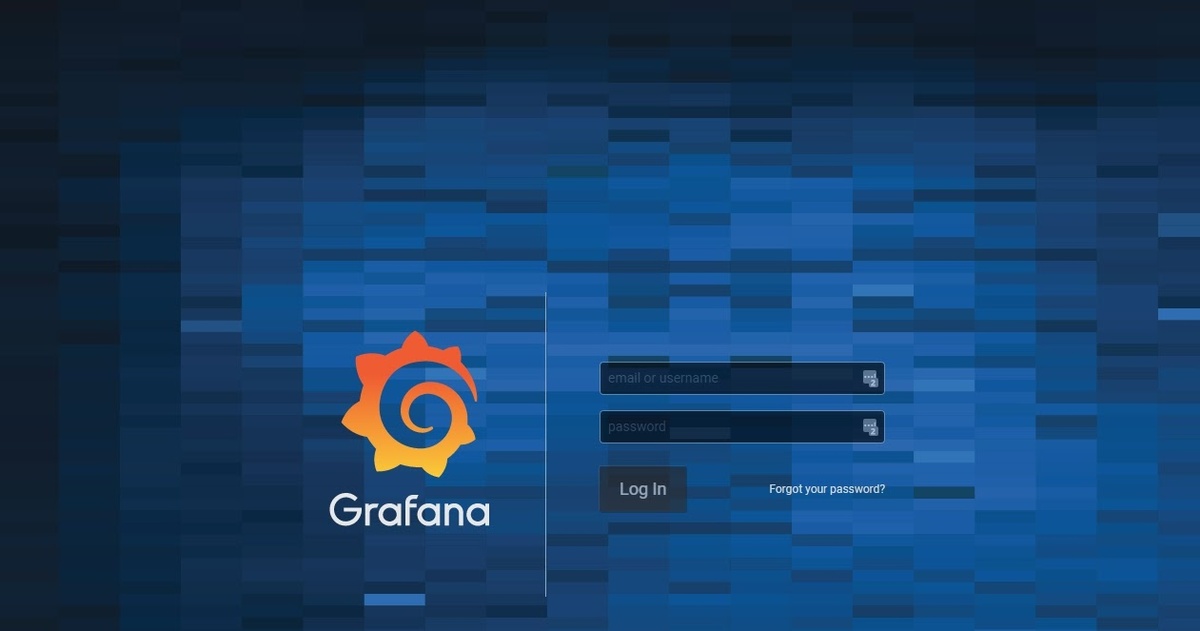
Once the VM is provisioned on Azure Cloud, we will be able to login into the Grafana Virtual Machine using http://<VM IPAddress>:3000 in our browser.
Configuring Azure Monitor Data Source
Azure Monitor data source requires a few configuration options, such as service principal. Follow these instructions to provide a service principal if you have not done so in your Azure cloud application. This will provide you with the tenant ID, Application ID, and client secret.
If you want to use Application Insights, then you also need an Application ID and API Key. If you have not already done so, follow these instructions to provide these.
Once all the details are provided, let's go ahead and save the data source settings. We are now ready to build the Grafana dashboard with the metrics from the Azure monitor.

Let’s head over to the Grafana homepage and create a new dashboard with our new Azure Monitor data source. Once we choose the Azure Monitor as the data source, there are a number of options to be provided to specify the metric we want to plot the metric on the dashboard.
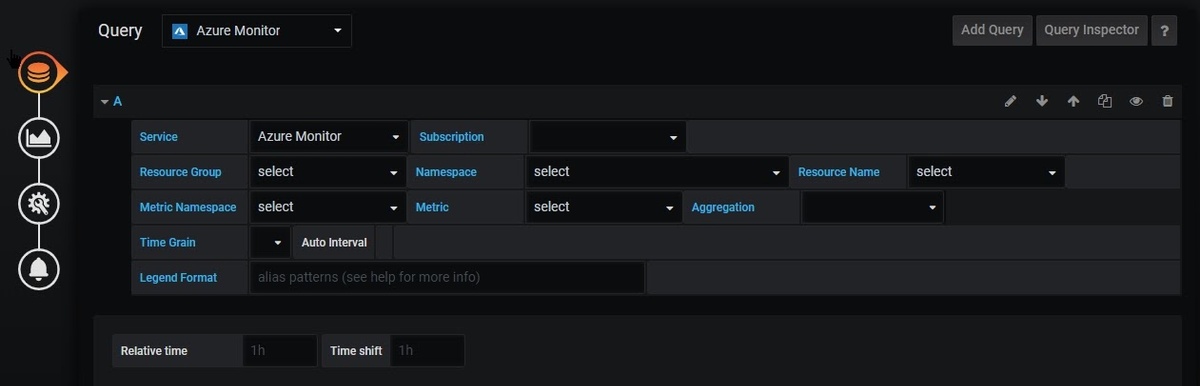
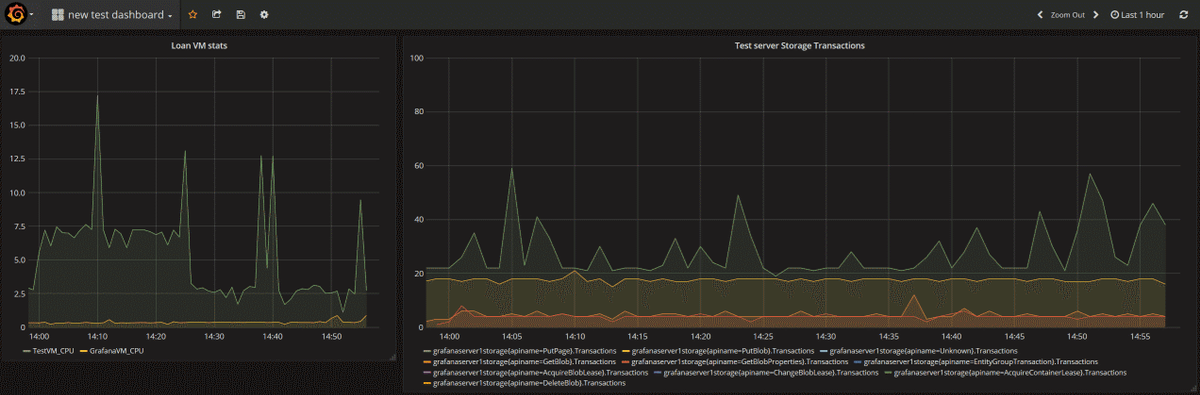
Most of these are self-explanatory. One important thing to be noted here is the namespace. For the VM you would want to choose, Microsoft.Compute/virtualMachines namespace.
Similarly, the namespaces for Networking and Storage would be Microsoft.Network/networkInterfaces and Microsoft.Storage/storageAccounts respectively. Azure provides the full list of namespaces and their associated metrics in this article. With these available metrics, we can build useful dashboards which plot both host metrics as well as application metrics onto the Grafana dashboard.
For example, the below dashboards show the CPU usage of the VMs and the right one shows the number of transactions happening in Azure Storage in real-time.
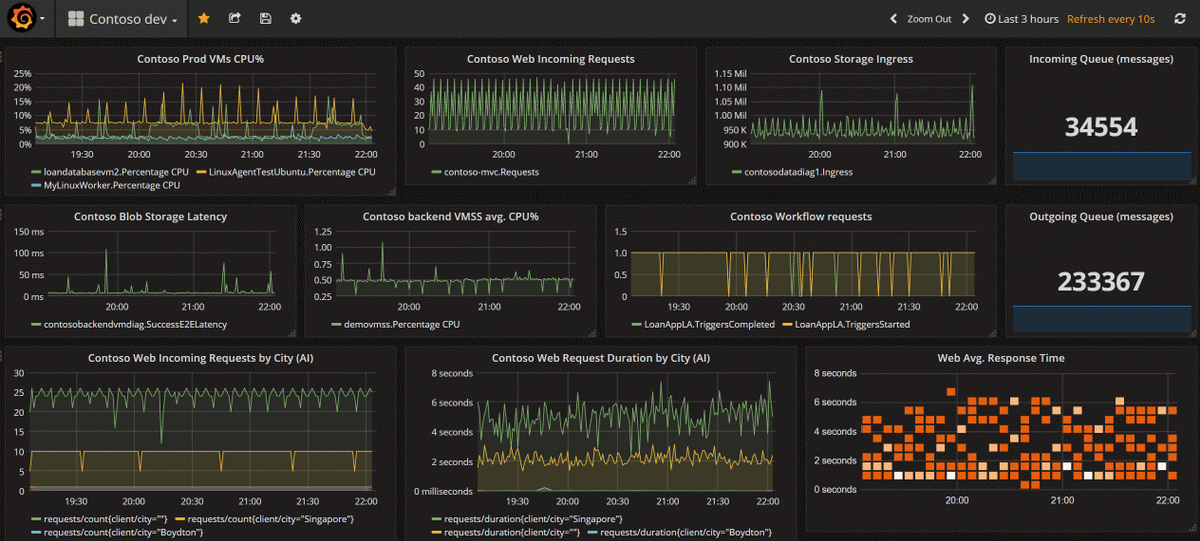
Similarly, we can combine multiple types of visualizations measuring different Azure metrics onto the Grafana dashboard as shown below.
Another interesting thing to be noted here is that we are not just restricted to visualizing the metrics supported by Azure Monitor only. We can even push our custom application metrics hosted in Azure cloud to Graphite, and configure the Graphite data source in Grafana to visualize them. Have a look at the articles such as Graphite for Node.js Monitoring and Graphite and Grafana to configure the same for your applications.
You can also set alerts on these dashboards if the value of the observed metrics falls out of the allowed range. For more information on how to create such advanced dashboards, have a look at our articles on Grafana Dashboards from Basic to Advanced Dashboards and Our Favorite Grafana Dashboards.
Introduction to Azure Active Directory
In the above integration, if you have noticed, we have been using the login mechanism provided by Grafana. Ideally, most of the enterprise applications follow Single Sign On (SSO) conventions which means that once the user authenticates with his enterprise credentials, the user shouldn’t be required to enter his credentials anywhere else including the Grafana.
This is where Azure Active Directory comes into the picture. Azure Active Directory allows an organization to centrally manage identity and authentication management for multiple services.
Added benefits of Azure Active Directory Integration with Hosted Graphite and Grafana
MetricFire’s Hosted Graphite and Hosted Grafana allow you to integrate with Azure Active Directory as well and set up Single Sign On (SSO) with your enterprise credentials to ensure seamless authentication across multiple services.
The process to integrate the Azure Active Directory with Hosted Graphite is fairly straightforward. First, we log in to the Azure AD portal and add the “Hosted Graphite” application from the gallery.
On the “Configure Single Sign-on” configuration page, enter the Identifier as “https://www.hostedgraphite.com/metadata/YOUR-USER-ID/” and Reply Url as “https://www.hostedgraphite.com/complete/saml/YOUR-USER-ID/”. Also, remember to download the certificate from this page.
Once we have these details, we will head over to Hosted Graphite on the SAML setup page and enter the Issuer URL in the Entity ID field, SAML SSO URL in the SSO Login URL field. In the certificate text box, we need to copy the contents of the certificate file we have downloaded.
For more detailed instructions, have a look at the section “Azure Active Directory” in SAML Authentication. These instructions are also available in Azure Documentation.
Conclusion
In this article, we have seen how users of Azure Cloud use Grafana to view their application metrics using the Azure Monitor data source. We have also seen how to use Azure Active Directory to provide seamless login with Hosted Graphite and Grafana.
MetricFire provides production-ready Hosted Graphite and Hosted Grafana which come with this and a lot of other features which make monitoring Azure applications absolutely seamless.
Sign up for the MetricFire free trial to set up Graphite and build Grafana dashboards now. You can also book a demo and talk to the MetricFire team about how you can best set up your monitoring stack.


