
Table of Contents
Introduction
A lot of organizations are using Grafana to visualize information and get notified about events happening within their infrastructure or data. In this article, we will show how to create and configure Grafana Alert rules.
To get started, log in to the MetricFire free trial, where you can send metrics and make Grafana dashboards right on our platform.
Key Takeaways
- Organizations commonly use Grafana for visualizing data and receiving notifications about events within their infrastructure.
- Alert rules can be defined for individual dashboard panels, either during panel creation or by editing an existing panel. These rules help in monitoring specific conditions.
- Alerts can be customized by setting a name, frequency for evaluation, and specific conditions based on your data. You can be notified when certain conditions are met.
- Multiple notification channels, such as Slack and PagerDuty, are available for alert delivery. Using notification channels is optional but helpful.
Starting with your monitoring environment
In order to demonstrate how to use Grafana Alerts, we need to set up our monitoring environment.
In this article, we will use Elasticsearch as the data source for MetricFire’s Grafana as a Service. It is a convenient way to have Grafana installed and configured easily without causing issues related to the on-premise install. If you want more information about using Grafana with Elasticsearch, check out our tutorial.
You can also easily set up your MetricFire free trial with other data sources. The most common data sources (such as StatsD, Collected, AWS, New Relic, etc.) are available as add-ons within the product. We also have a MetricFire Agent that you can download that will pull metrics from your system into the platform. Instructions can be found on our docs.
To have something to monitor in Grafana, we will generate and send random data to the Elasticsearch index from a simple Python script - a producer. To put the data in the index we use the Logstash tool. Despite the fact that the data is random, we will give it a specific range. At the same time, we will sometimes generate data that will be out of the given range. This will be the case when the Grafana Alerts should be triggered.
The script will generate random values in the range from -5 to 34 for parameter_1. For parameter_2, it will generate random numbers in the range from 100 to 209, but every 20th second the number generated will be in the range from 250 to 254. Our script will send new data to Logstash every second. This will give us a good data set to practice making Grafana Alerts with.
How to create and configure Alert Rules
If you want to receive notifications about alerts, you should define at least one notification channel. This is how the information about an alert being triggered will be delivered to you. Several notification channels are available as add-ons on MetricFire such as Slack and PagerDuty. Here is the tutorial for using Slack as the notification channel for MetricFire’s product, Hosted Graphite. However, using notification channels is not a requirement for alerting.
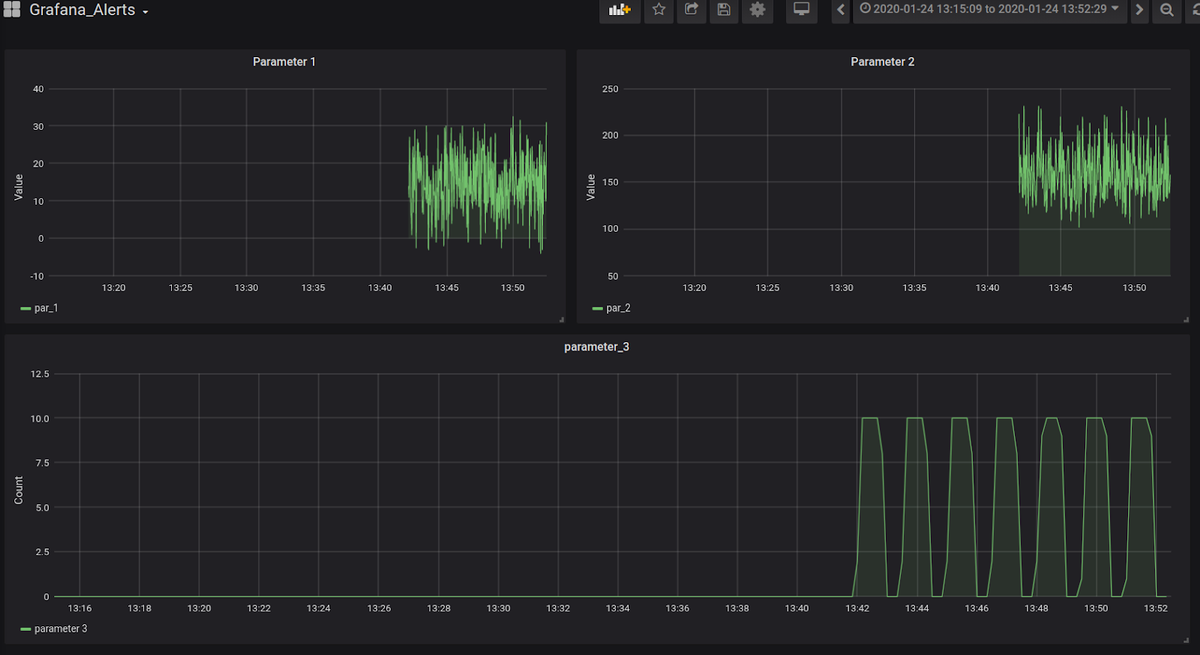
Users can create alert rules independently for each dashboard panel. We have the dashboard that monitors three fields (parameter_1, parameter_2, parameter_3) from our Elasticsearch index:
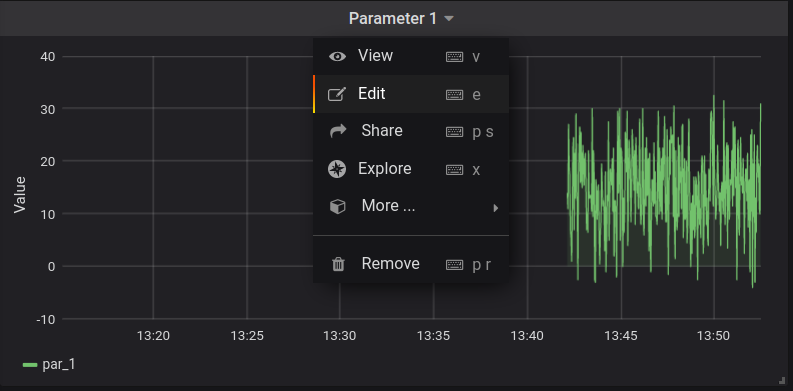
Actually, an alert rule can be set during the panel creation. But if you already have the panel and want to add an alert rule to it, you should edit the panel:
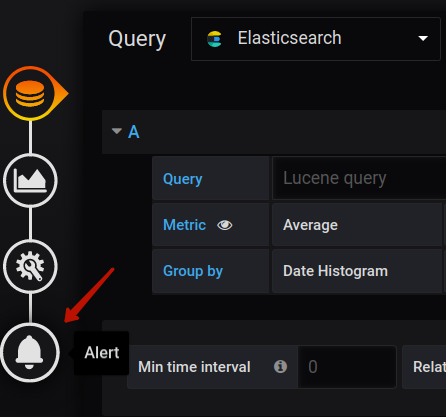
Then click on the Alert button (the bell icon):
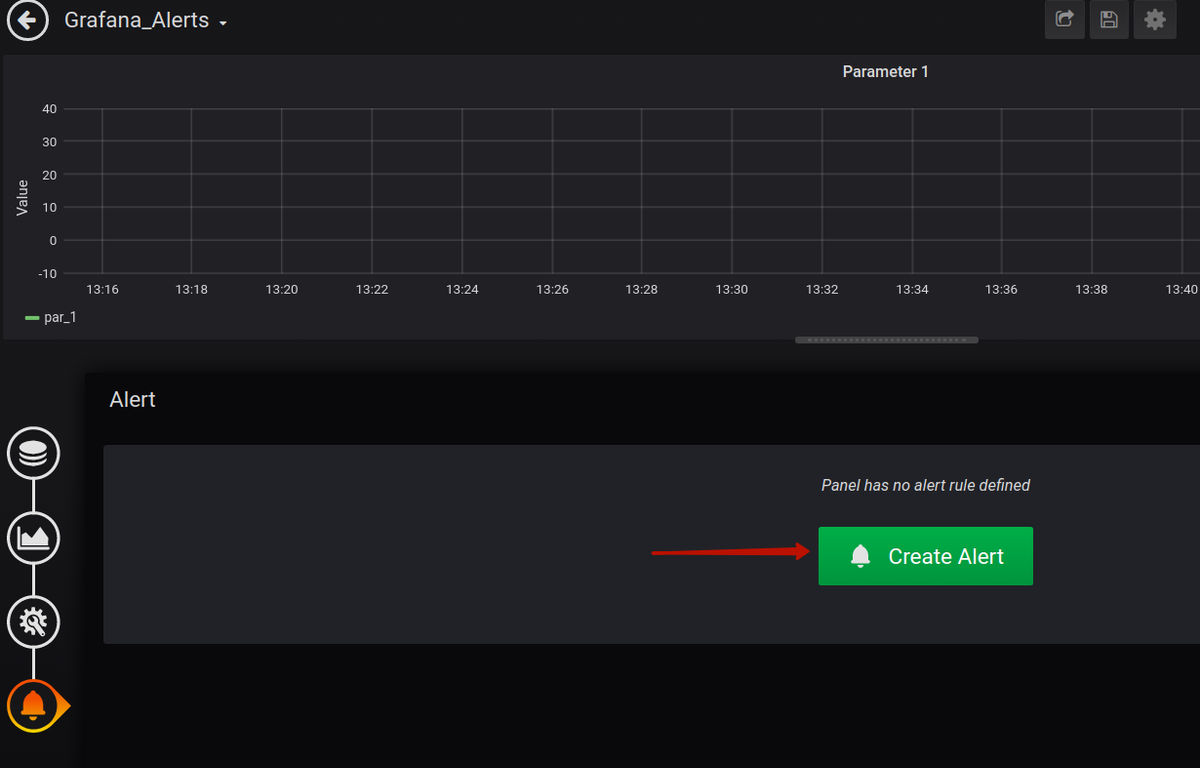
And finally, click on the Create Alert button:
Now we need to configure the alert:
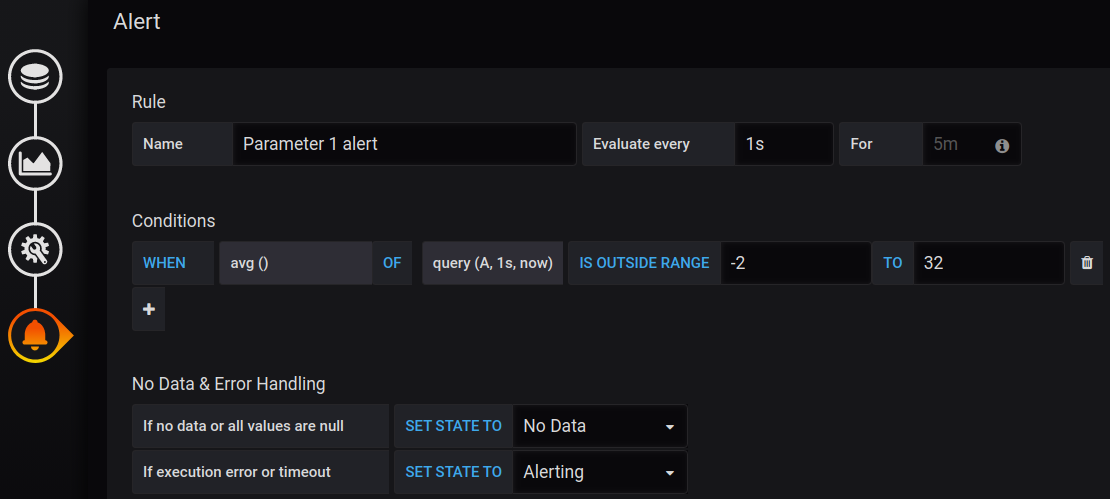
As you can see, we give it a name, set the frequency for the evaluation, and set the specific conditions of the Alert. For this particular alert, we want to be notified when the average value of the parameter_1 is out of range [-2 : 32]. As the Python script is producing values between -5 and 34, the value will sometimes be outside the range [-2 : 32].
When looking at the conditions section, you can see the query(A, 1s, now) part. Let’s explain what these parameters mean. “A” is the query used to visualize the metric. You could see the place where this query was defined in one of the previous images (before clicking on the button with the bell). In our case, it is an average for the parameter_1 over the last 1 second. The parameters “1s” and “now” set the time range and represent: “1 second ago to now”. In other words, we want to estimate data over the last second. Below the Conditions section, you can also configure the behavior of the alert when missing data or errors occur. This is very significant, as missing data can be frequent.
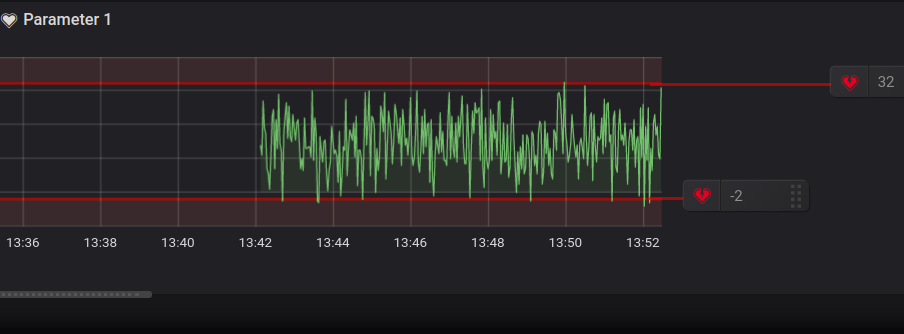
In the graph below, you will see the convenient visualization of the alert’s conditions:
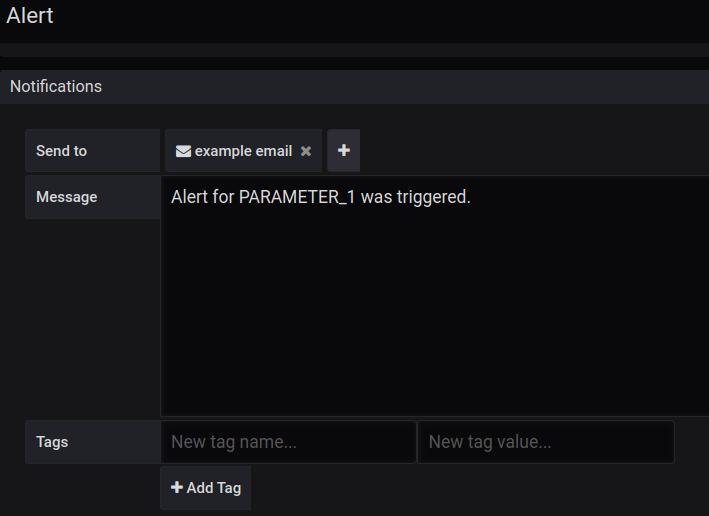
If you scroll the page down, you will see the section specifying the notification channel. We will use the “example email” channel which we had created previously:
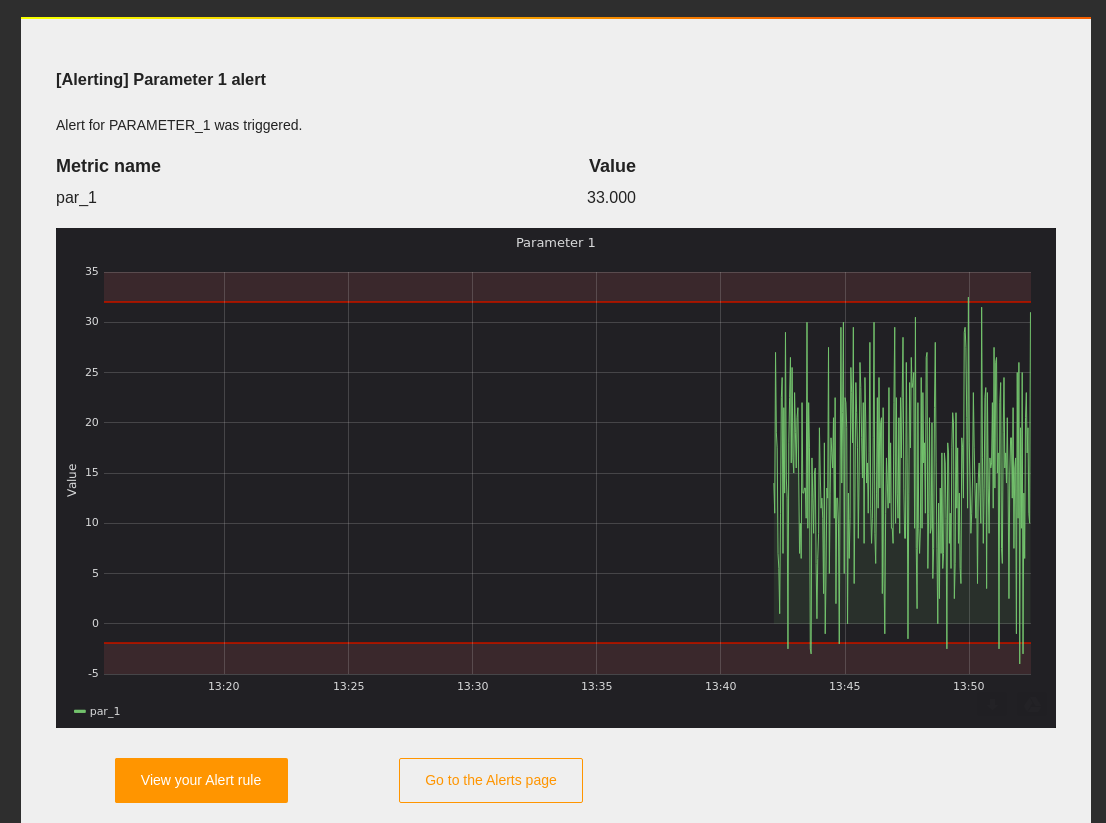
To apply changes, save the dashboard. After we run the Python script and wait for a while, we will start to receive emails with notifications about the alert. Here is an example of such an email:
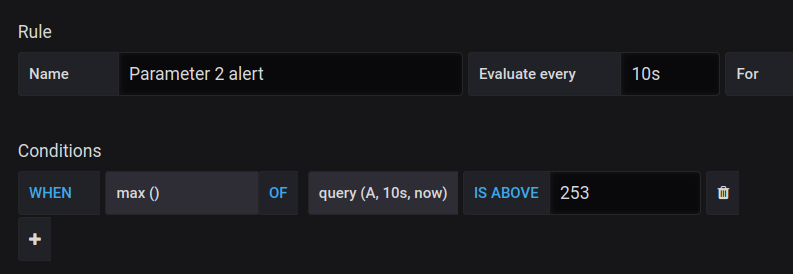
Similarly, we can create other alert rules. Below you can see the condition of the alert for parameter_2. In this case, we want to receive notifications when the maximum value computed over the last 10 seconds is above 253.
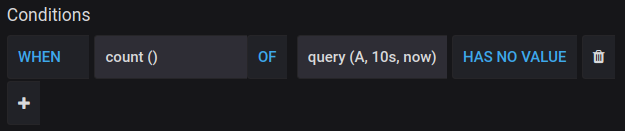
Besides the “out-of-bounds” and “above/below” conditions there is the third condition type - missing values. Here is how it can be configured:
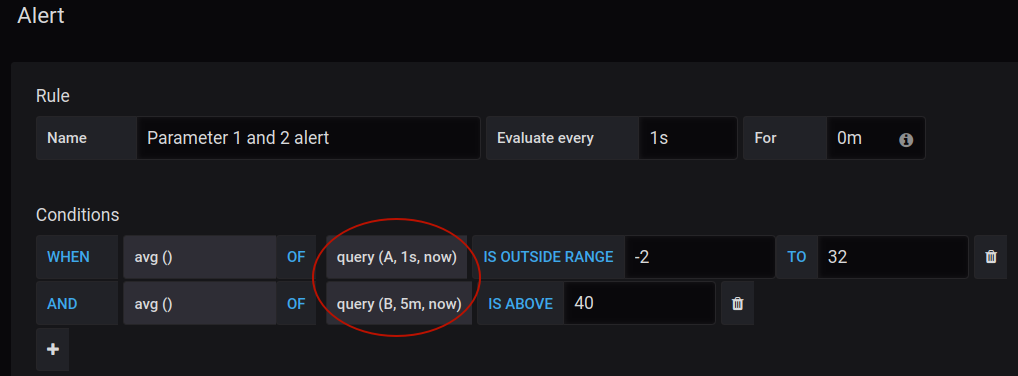
Remember that you can create complex conditions that consist of several blocks. To do this, click on the “Plus” button under the first condition block. Condition blocks can be stacked using the “AND” or “OR” operators. In the result, you can get something like this:
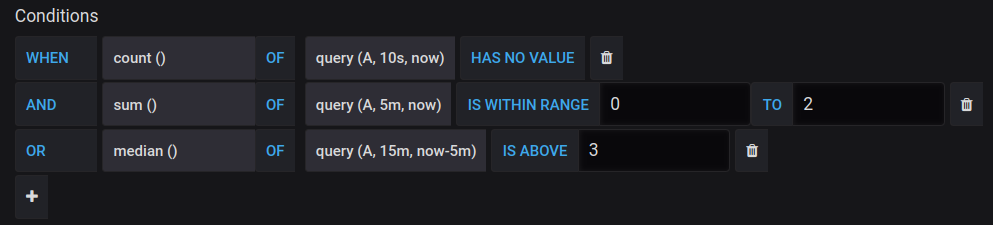
Note, that there are many different functions for evaluation: count, sum, median, diff, min, max, etc. Also, you can set up alerts with other queries (instead of just “A” in our examples above).
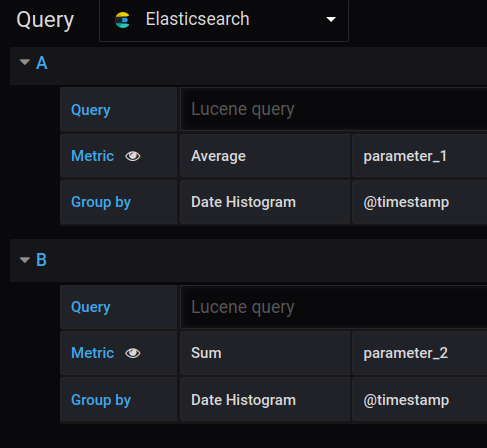
For example, suppose that we have two queries: A and B (see the image below). Query A reflects the average value for the parameter_1 over the specified period of time. Query B reflects the sum of values of the parameter_2 over the specified period of time.
When you have several different queries, you can create alerts based on them:
Useful alerts for monitoring infrastructure and network
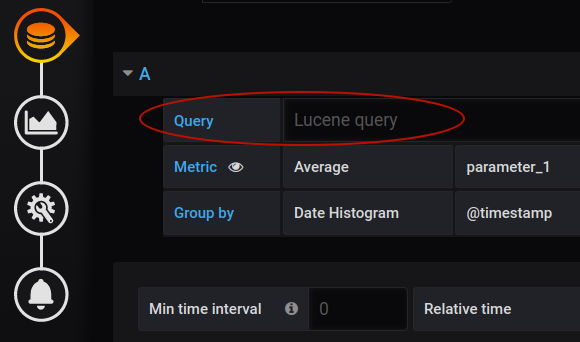
For people who monitor the infrastructure and network, there are several types of alerts that can be useful. They can monitor the server load, request latency, error rates, and memory usage. If you want to monitor the performance of the application, there can be even more use-case-specific metrics to monitor. For example, there could be an alert about the large number of new user registrations over a short period of time. Remember, that in the panel query (which was named “A” in our examples) you can include the custom request to the data source. To do this, use the Query field (see the image below). In the case of the ElasticSearch source, this should be a Lucene query.
The availability to create custom requests extends your potential capabilities to develop complex alert conditions.
Summary
In this post, we looked at how to work with Grafana Alerts. The focus was on the creation and configuring of alert conditions. If you need to be notified about alerts, you should set up a notification channel. Also, take a look at our favorite Grafana Dashboards, our article about Grafana plugins, and our Grafana Dashboard tutorial.
If you want to know how MetricFire can help with your monitoring needs, book a demo and talk to us directly. And don’t forget you can use our 14-day free trial, and make your own Grafana Dashboards within a few minutes.


