Table of Contents

Introduction
Grafana vs. Power BI – This is often a confusing decision for people wanting to select a data visualization and analytics tool with visually appealing and interactive insights. In this article, we highlight the features and benefits of both tools —Grafana and Power BI, bringing out their key differences to help you make a better decision.
If you're interested in trying it out for yourself, sign up for our free trial. You can also sign up for a demo and we can talk about the best monitoring solutions for you.
Key Takeaways
- Grafana is adaptable for monitoring data from other application monitoring tools and offers scalability and affordability.
- Power BI is great for analyzing data from various sources but is more focused on business intelligence.
- Grafana is ideal for metric consolidation and monitoring, making it an affordable and easy-to-maintain solution for various data sources.
- Power BI is well-suited for business analytics, but it has limitations regarding data source integration and is primarily focused on business intelligence.
What Is Grafana?
Grafana is an open-source analytics and monitoring solution, developed and supported by Grafana Labs. It lets you query, graph, and alert on your time-series metrics no matter where the data is stored. Grafana is backed by a vibrant community of developers and is used today by thousands of companies to monitor anything and everything.
Grafana is an open-source project, which means it’s free. This is a definite plus, but running and maintaining the software can be difficult and time-consuming for large companies. This is where MetricFire comes in. MetricFire offers a hosted Grafana service, so users can connect their data pipelines on the MetricFire web app, and use Grafana directly on the platform.
Try the free trial and start making Grafana dashboards today! Also, talk to us directly by booking a demo - we’re always happy to talk with you about your company’s monitoring needs.
Features of Grafana:
- Grafana has a very lightweight backend and supports over 30+ open-source and commercial data sources with minimal infrastructure.
- It can seamlessly integrate with your workflow to help explore metrics, visualize data, explore logs, evaluate data points, and notify issues using different channels — and it can do it all in real-time.
- It provides built-in support for prominent time-series databases like Graphite, InfluxDB, Prometheus, Elasticsearch, and many more.
- Comes with a huge collection of interactive plugins starting from simple charts and graphs to heatmaps, geomaps, flow charts, and many more.
- Some panels in Grafana allow you to define alert rules and evaluate metrics continuously against predefined thresholds. Then you can send notifications over different channels like email, Slack, PagerDuty, VictorOps, etc.
- Grafana lets you create dynamic dashboards with the help of template variables. These dashboards display tons of data using the same template to increase reusability. To know more about using templates in Grafana, read our article on Our Favorite Grafana Dashboards here.
- Grafana also allows querying and mixing different data sources into the same graph, which is a rare feature. Also, other features like the use of ad hoc filters and adding annotations make it a tough competitor in the market of data visualization and analytic tools.
- To query data in Grafana, you need to use a query language. This is a basic mathematical language for interacting with your database.
- Grafana is open-source, which means it’s free. Anyone can install the software from the open-source project on GitHub and start using it today. To work around the challenging installation and maintenance process, users can work with Hosted Grafana by MetricFire.
When it comes to choosing between Prometheus and hosted Graphite, consider that hosted Graphite gives you benefits like:
- The option to push metrics from any coding language (Prometheus works with a limited number of languages).
- Partitions by replicated external tools or continuous hashing.
- Hourly data and dashboard backups.
- A slight learning curve that keeps training short and affordable.
- A large community of users who enjoy supporting each other.
More often than not, businesses decide that hosted Graphite offers the features they need to monitor their networks and take control of data.
With the help of Grafana’s ever-growing community support, new plugins and dashboards are added every week, with enhanced features and updates. Their official library consists of a wide variety of plugins like graphs, charts, dashboards, alert panels, etc.
All these plugins come with numerous customization options, allowing users to display their data in different ways and convert them to fast and flexible dashboards. Overall, Grafana is an all-in-one visualization and analytics solution for data with no boundaries. All these extensive features make Grafana the first choice of DevOps and Monitoring Engineers from across the globe.
What is Power BI?
Power BI is a business analytics solution developed by Microsoft Corporation. It focuses on providing interactive visualization and business intelligence capabilities to end-users with an easy-to-use interface, much like any other Microsoft product.
Features of Power BI:
- Power BI provides non-technical business users with a versatile platform for analyzing and visualizing their data with live dashboards and reports.
- The product is a collection of different parts working together to bring out meaningful insights that could be shared across organizations or embedded into your app or Website.
- Power BI allows importing data from files, databases, Azure storages, Salesforce reports, and many more. Users can choose to get data from any of the Excel, CSV, JSON, PDF, etc. formats.
- They also support databases like Oracle, MySQL, SQL Server, IBM DB2, SAP Hana, and many more, including online services like Salesforce Reports, Google Analytics, and Smartsheets. There is a long list of data sources that could be used with Power BI and are supported by the application.
- Reports can be organized into pages just like a presentation.
- Power BI lets users gain additional insight into the data by filtering each individual panel or chart.
- Users can add bookmarks or slice the data to delve deeper. They can also leave comments for others to see.
- Power BI also lets users ask questions about their data in simple English. There is a basic English UI for querying data.
Power BI is divided into three different parts, and each part has a slightly different role:
- Power BI Desktop – A Windows application used to create data models, analyze the data, and create reports.
- Power BI service – A SaaS service primarily used to share the reports. The service provides limited report editing and data modeling capabilities.
- Power BI Mobile – A mobile app for Windows, iOS, and Android devices used by end-users to view the report.
Each part of the Power BI product has its own role, and the parts are dependent on each other. For example, you can’t use only Power BI Mobile, as it is powered by the information held in Power BI Desktop. Each part of Power BI is generally used by different people in the organization.
For instance, a report creator may only focus on the Desktop application where they create the data model and generate the report. Another user of the same organization may only be entitled to view the reports or dashboards, and then share it with others using Power BI Service. Each Team member can in turn see the reports using the Mobile App.
Power BI shares the same simple-to-use interface seen on any other Microsoft or Windows product. A typical Power BI workflow would be to first import data from any data source. The data is then filtered and shaped according to the user's needs. While using tabled data, users can either manually define the relationships between columns or use an AutoDetect option that automatically determines the relationships between the data using an in-built algorithm.
Users can then customize data formats or choose to add any additional insights. This data is converted into a report after adding filters, selecting colors and gradients, and finalizing other options. The reports are then saved into a local desktop or published to Power BI using a .pbix extension. The reports can be modified or shared among other members of the team using the Power BI service. Finally, Power BI mobile app users can easily receive these reports on their devices.
Try MetricFire now!
To try out MetricFire check out our free trial. You can use Graphite directly in our platform, and monitor metrics without any setup. Also, talk to us directly by booking a demo - we’re always happy to talk with you about your company’s monitoring needs.
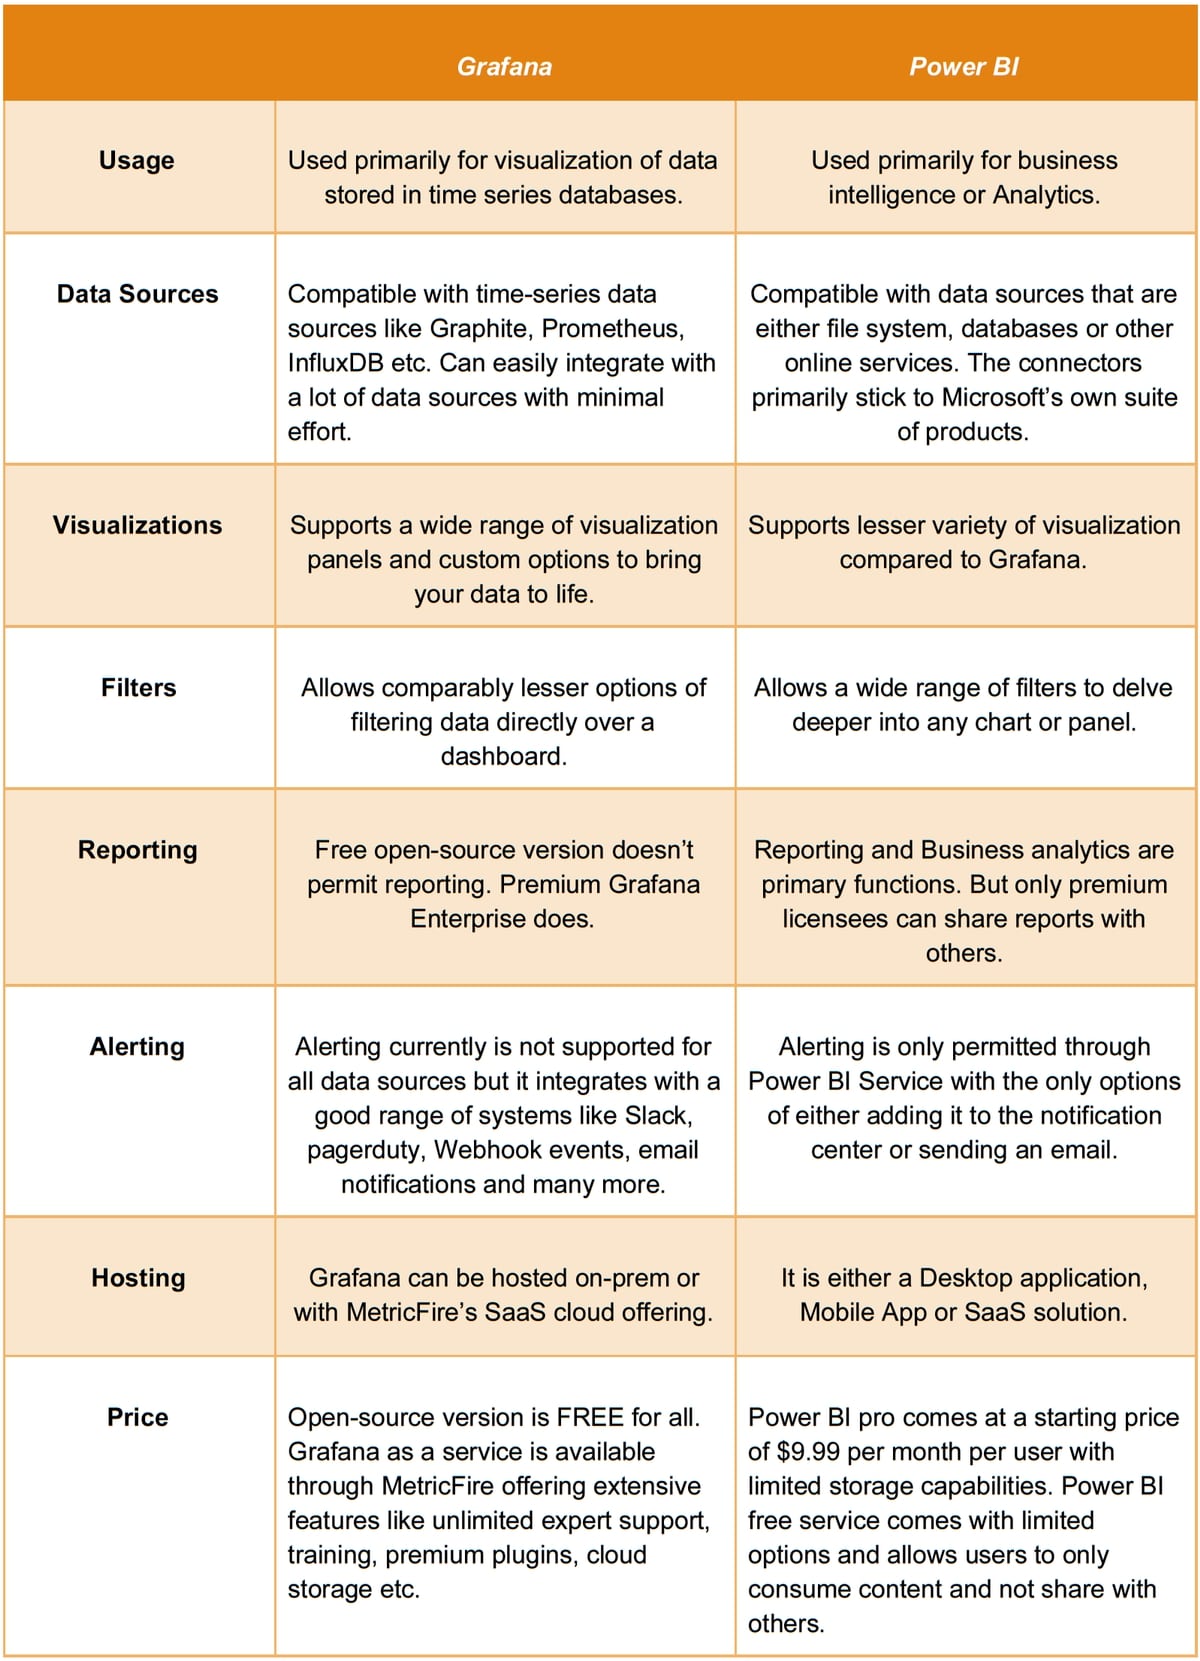
What’s the Difference?
When to Choose What?
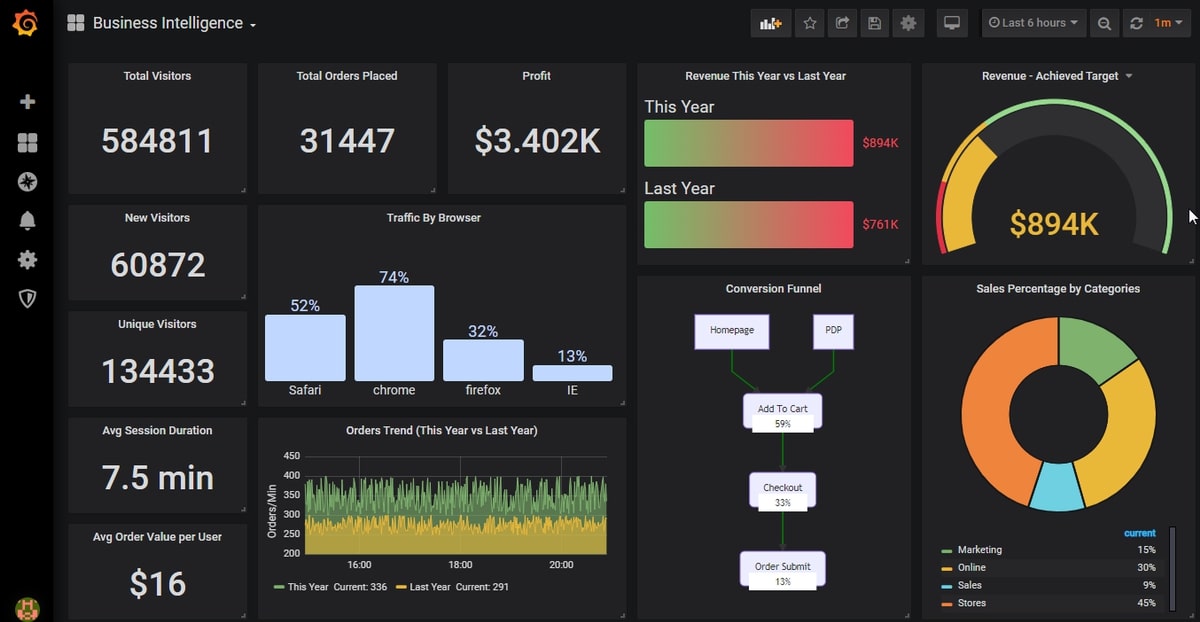
Select Grafana if you have time-series metrics that you want to visualize over charts or graphs. Any data, expressed as numbers over time, that comes from a time-series data source is easier to manage and query using Grafana. Grafana will easily let you integrate your time-series data sources by providing built-in support for most of the prominent data sources available in the market today.
Grafana is the perfect choice when it comes to purely visualizing KPIs related to infrastructure, applications, networks, devices, sensors, etc. It’s a great 24x7 monitoring solution for DevOps and NOC teams. It can also help you manage all your data from other application monitoring tools like Splunk, Appdynamics, Dynatrace, New Relic, etc., and provide an all-in-one web-based interface to display, report, and alert the data. If you’re already using Grafana to monitor something else in your company, extending it to monitor business intelligence metrics is a no-brainer.
Grafana as a Service, provided by MetricFire, is a great solution with the added benefit of scalability, affordability, and much more. Take a look at our articles about how to monitor Business metrics with Grafana, as well as our favorite dashboard for business metrics, on the MetricFire blog.
You can also try it out on the MetricFire free trial, and make some dashboards today.
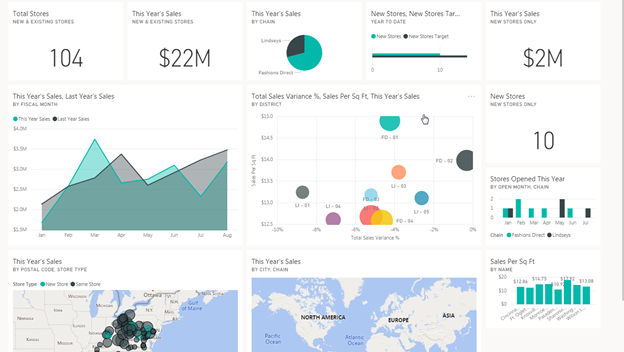
Users should select Power BI if business intelligence and analytics is the only requirement. It’s easier to set up and manage for any non-technical person, as it has a familiar interface just like any other Windows product. Power BI provides an easy-to-use interface with drag-and-drop capabilities for report creation.
With data sources varying from simple Excel files to Azure services, Power BI could provide very powerful insights into your data. However, it has its own disadvantages. Only users of Power BI Pro License, which is a paid license, can publish content to app workspaces, share dashboards, and subscribe to dashboards and reports. A free license user is only allowed to consume content, and there are restrictions.
Power BI provides limited options for integrating with different types of data sources, with most of the permitted ones belonging to their own product suite. Overall, Power BI isn’t a good solution if you’re looking to monitor more than just Business KPIs. Where Grafana is a powerful tool that is able to monitor infrastructure and business data, Power BI is very focused on only business intelligence.
Summary and Conclusion
To conclude, Grafana and Power BI are both powerful tools, but it depends on how users use them. If you need a tool only for the purpose of business analytics, Power BI can be a great solution. If you require an overall tool for metric consolidation and monitoring, Grafana is one of the most affordable and easy-to-maintain solutions. For more information, check out our tutorial on monitoring business metrics with Grafana.
Sign up for the free trial, and experiment with making some Grafana dashboards today. You can also book a demo and talk to the MetricFire team directly about your monitoring needs.