Table of Contents
Introduction
In this article, we will deploy a clustered Prometheus setup that integrates Thanos. It is resilient against node failures and ensures appropriate data archiving. The setup is also scalable. It can span multiple Kubernetes clusters under the same monitoring umbrella. Finally, we will visualize and monitor all our data in accessible and beautiful Grafana dashboards.
Why Integrate Prometheus with Thanos?
Prometheus is scaled using a federated set-up, and its deployments use a persistent volume for the pod. However, not all data can be aggregated using federated mechanisms. Often, you need a different tool to manage Prometheus configurations. To address these issues, we will use Thanos. Thanos allows you to create multiple instances of Prometheus, deduplicate data, and archive data in long-term storage like GCS or S3.
Thanos Overview
Thanos Architecture
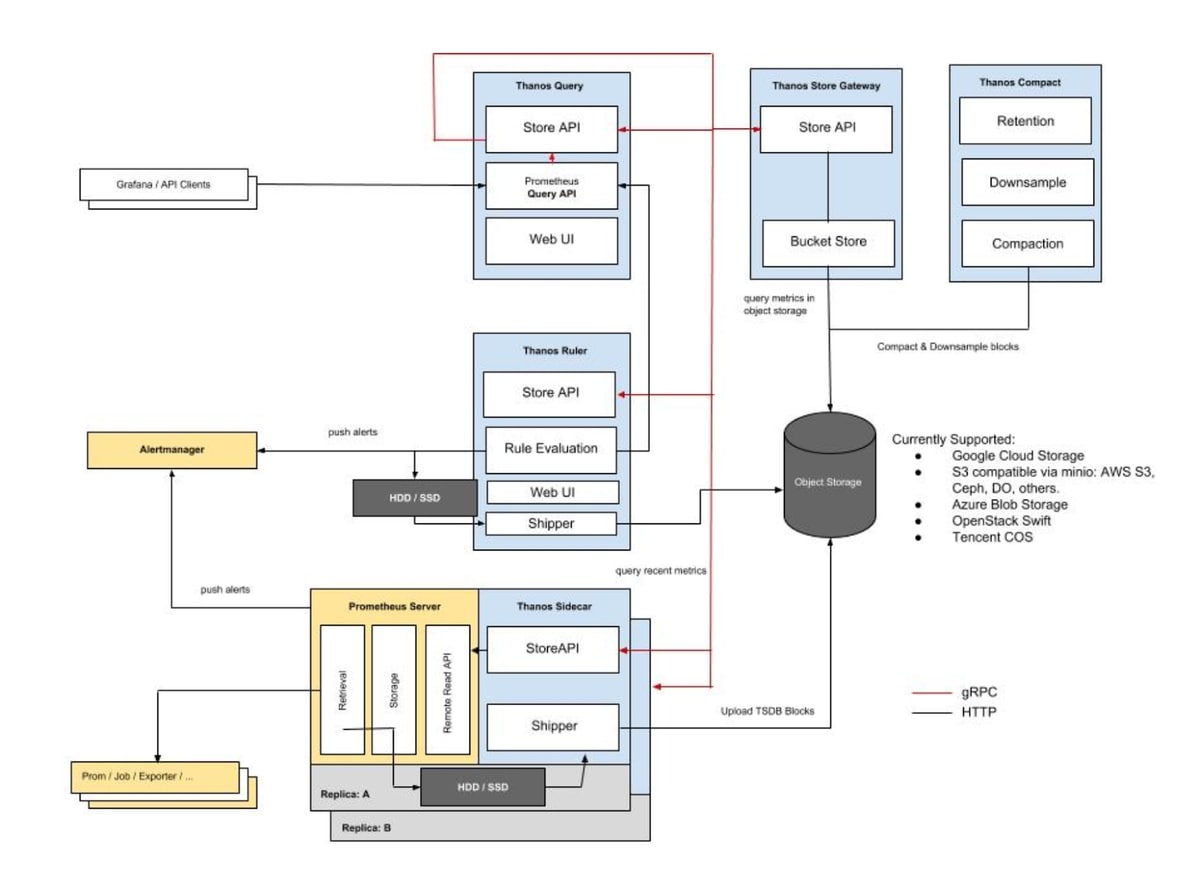
The components of Thanos are sidecar, store, query, compact, and ruler. Let's take a look at what each one does.
Thanos Sidecar
- The main component that runs along Prometheus
- Reads and archives data on the object store
- Manages Prometheus’s configuration and lifecycle
- Injects external labels into the Prometheus configuration to distinguish each Prometheus instance
- Can run queries on Prometheus servers’ PromQL interfaces
- Listens in on Thanos gRPC protocol and translates queries between gRPC and REST
Thanos Store
- Implements the Store API on top of historical data in an object storage bucket
- Acts primarily as an API gateway and therefore does not need significant amounts of local disk space
- Joins a Thanos cluster on startup and advertises the data it can access
- Keeps a small amount of information about all remote blocks on a local disk in sync with the bucket
- This data is generally safe to delete across restarts at the cost of increased startup times
Thanos Query
- Listens in on HTTP and translates queries to Thanos gRPC format
- Aggregates the query result from different sources, and can read data from Sidecar and Store
- In HA setup, Thanos Query even deduplicates the result
A note on run-time duplication of HA groups: Prometheus is stateful and does not allow for replication of its database. Therefore, it is not easy to increase high availability by running multiple Prometheus replicas.
Simple load balancing will also not work -- say your app crashes. The replica might be up, but querying it will result in a small time gap for the period during which it was down. This isn’t fixed by having a second replica because it could be down at any moment, for example, during a rolling restart. These instances show how load balancing can fail.
Thanos Query pulls the data from both replicas and deduplicates those signals, filling the gaps, if any, to the Querier consumer.
Thanos Compact
- Applies the compaction procedure of the Prometheus 2.0 storage engine to block data in object storage
- Generally not concurrent with safe semantics and must be deployed as a singleton against a bucket
- Responsible for downsampling data: 5 minute downsampling after 40 hours and 1 hour downsampling after 10 days
Thanos Ruler
Thanos Ruler basically does the same thing as the querier but for Prometheus’ rules. The only difference is that it can communicate with Thanos components.
Thanos Implementation
Prerequisites: In order to completely understand this tutorial, the following are needed:
1. Working knowledge of Kubernetes and kubectl
2. A running Kubernetes cluster with at least 3 nodes (We will use a GKE)
3. Implementing Ingress Controller and Ingress objects (We will use Nginx Ingress Controller); although this is not mandatory, it is highly recommended in order to reduce external endpoints.
4. Creating credentials to be used by Thanos components to access object store (in this case, GCS bucket)
a. Create 2 GCS buckets and name them as prometheus-long-term and thanos-ruler
b. Create a service account with the role as Storage Object Admin
c. Download the key file as json credentials and name it thanos-gcs-credentials.json
d. Create a Kubernetes secret using the credentials, as you can see in the following snippet:
kubectl create secret generic thanos-gcs-credentials --from-file=thanos-gcs-credentials.json -n monitoring
Deployment
Deploying Prometheus Services Accounts, Clusterrole and Clusterrolebinding: The following manifest creates the monitoring namespace, service accounts, clusterrole and clusterrolebindings needed by Prometheus.
apiVersion: v1
kind: Namespace
metadata:
  name: monitoring
---
apiVersion: v1
kind: ServiceAccount
metadata:
  name: monitoring
  namespace: monitoring
---
apiVersion: rbac.authorization.k8s.io/v1beta1
kind: ClusterRole
metadata:
  name: monitoring
  namespace: monitoring
rules:
- apiGroups: [""]
  resources:
  - nodes
  - nodes/proxy
  - services
  - endpoints
  - pods
  verbs: ["get", "list", "watch"]
- apiGroups: [""]
  resources:
  - configmaps
  verbs: ["get"]
- nonResourceURLs: ["/metrics"]
  verbs: ["get"]
---
apiVersion: rbac.authorization.k8s.io/v1beta1
kind: ClusterRoleBinding
metadata:
  name: monitoring
subjects:
  - kind: ServiceAccount
    name: monitoring
    namespace: monitoring
roleRef:
  kind: ClusterRole
  name: monitoring
  apiGroup: rbac.authorization.k8s.io
---
Deploying Prometheus Configuration configmap: The following config map creates the Prometheus configuration file template that will be read by the Thanos sidecar component. The template will also generate the actual configuration file. The file will be consumed by the Prometheus container running in the same pod. It is extremely important to add the external_labels section in the config file so that the querier can deduplicate data based on it.
apiVersion: v1
kind: ConfigMap
metadata:
  name: prometheus-server-conf
  labels:
    name: prometheus-server-conf
  namespace: monitoring
data:
  prometheus.yaml.tmpl: |-
    global:
      scrape_interval: 5s
      evaluation_interval: 5s
      external_labels:
        cluster: prometheus-ha
        # Each Prometheus has to have unique labels.
        replica: $(POD_NAME)

    rule_files:
      - /etc/prometheus/rules/*rules.yaml

    alerting:

      # We want our alerts to be deduplicated
      # from different replicas.
      alert_relabel_configs:
      - regex: replica
        action: labeldrop

      alertmanagers:
        - scheme: http
          path_prefix: /
          static_configs:
            - targets: ['alertmanager:9093']

    scrape_configs:
    - job_name: kubernetes-nodes-cadvisor
      scrape_interval: 10s
      scrape_timeout: 10s
      scheme: https
      tls_config:
        ca_file: /var/run/secrets/kubernetes.io/serviceaccount/ca.crt
      bearer_token_file: /var/run/secrets/kubernetes.io/serviceaccount/token
      kubernetes_sd_configs:
        - role: node
      relabel_configs:
        - action: labelmap
          regex: __meta_kubernetes_node_label_(.+)
        # Only for Kubernetes ^1.7.3.
        # See: https://github.com/prometheus/prometheus/issues/2916
        - target_label: __address__
          replacement: kubernetes.default.svc:443
        - source_labels: [__meta_kubernetes_node_name]
          regex: (.+)
          target_label: __metrics_path__
          replacement: /api/v1/nodes/${1}/proxy/metrics/cadvisor
      metric_relabel_configs:
        - action: replace
          source_labels: [id]
          regex: '^/machine\.slice/machine-rkt\\x2d([^\\]+)\\.+/([^/]+)\.service$'
          target_label: rkt_container_name
          replacement: '${2}-${1}'
        - action: replace
          source_labels: [id]
          regex: '^/system\.slice/(.+)\.service$'
          target_label: systemd_service_name
          replacement: '${1}'

    - job_name: 'kubernetes-pods'
      kubernetes_sd_configs:
        - role: pod
      relabel_configs:
        - action: labelmap
          regex: __meta_kubernetes_pod_label_(.+)
        - source_labels: [__meta_kubernetes_namespace]
          action: replace
          target_label: kubernetes_namespace
        - source_labels: [__meta_kubernetes_pod_name]
          action: replace
          target_label: kubernetes_pod_name
        - source_labels: [__meta_kubernetes_pod_annotation_prometheus_io_scrape]
          action: keep
          regex: true
        - source_labels: [__meta_kubernetes_pod_annotation_prometheus_io_scheme]
          action: replace
          target_label: __scheme__
          regex: (https?)
        - source_labels: [__meta_kubernetes_pod_annotation_prometheus_io_path]
          action: replace
          target_label: __metrics_path__
          regex: (.+)
        - source_labels: [__address__, __meta_kubernetes_pod_prometheus_io_port]
          action: replace
          target_label: __address__
          regex: ([^:]+)(?::\d+)?;(\d+)
          replacement: $1:$2


    - job_name: 'kubernetes-apiservers'
      kubernetes_sd_configs:
        - role: endpoints
      scheme: https
      tls_config:
        ca_file: /var/run/secrets/kubernetes.io/serviceaccount/ca.crt
      bearer_token_file: /var/run/secrets/kubernetes.io/serviceaccount/token
      relabel_configs:
        - source_labels: [__meta_kubernetes_namespace, __meta_kubernetes_service_name, __meta_kubernetes_endpoint_port_name]
          action: keep
          regex: default;kubernetes;https

    - job_name: 'kubernetes-service-endpoints'
      kubernetes_sd_configs:
        - role: endpoints
      relabel_configs:
        - action: labelmap
          regex: __meta_kubernetes_service_label_(.+)
        - source_labels: [__meta_kubernetes_namespace]
          action: replace
          target_label: kubernetes_namespace
        - source_labels: [__meta_kubernetes_service_name]
          action: replace
          target_label: kubernetes_name
        - source_labels: [__meta_kubernetes_service_annotation_prometheus_io_scrape]
          action: keep
          regex: true
        - source_labels: [__meta_kubernetes_service_annotation_prometheus_io_scheme]
          action: replace
          target_label: __scheme__
          regex: (https?)
        - source_labels: [__meta_kubernetes_service_annotation_prometheus_io_path]
          action: replace
          target_label: __metrics_path__
          regex: (.+)
        - source_labels: [__address__, __meta_kubernetes_service_annotation_prometheus_io_port]
          action: replace
          target_label: __address__
          regex: (.+)(?::\d+);(\d+)
          replacement: $1:$2
Deploying Prometheus Rules configmap: this will create alert rules that will be relayed to Alertmanager for delivery.
apiVersion: v1
kind: ConfigMap
metadata:
  name: prometheus-rules
  labels:
    name: prometheus-rules
  namespace: monitoring
data:
  alert-rules.yaml: |-
    groups:
      - name: Deployment
        rules:
        - alert: Deployment at 0 Replicas
          annotations:
            summary: Deployment {{$labels.deployment}} in {{$labels.namespace}} is currently having no pods running
          expr: |
            sum(kube_deployment_status_replicas{pod_template_hash=""}) by (deployment,namespace)  < 1
          for: 1m
          labels:
            team: devops

        - alert: HPA Scaling Limited
          annotations:
            summary: HPA named {{$labels.hpa}} in {{$labels.namespace}} namespace has reached scaling limited state
          expr: |
            (sum(kube_hpa_status_condition{condition="ScalingLimited",status="true"}) by (hpa,namespace)) == 1
          for: 1m
          labels:
            team: devops

        - alert: HPA at MaxCapacity
          annotations:
            summary: HPA named {{$labels.hpa}} in {{$labels.namespace}} namespace is running at Max Capacity
          expr: |
            ((sum(kube_hpa_spec_max_replicas) by (hpa,namespace)) - (sum(kube_hpa_status_current_replicas) by (hpa,namespace))) == 0
          for: 1m
          labels:
            team: devops

      - name: Pods
        rules:
        - alert: Container restarted
          annotations:
            summary: Container named {{$labels.container}} in {{$labels.pod}} in {{$labels.namespace}} was restarted
          expr: |
            sum(increase(kube_pod_container_status_restarts_total{namespace!="kube-system",pod_template_hash=""}[1m])) by (pod,namespace,container) > 0
          for: 0m
          labels:
            team: dev

        - alert: High Memory Usage of Container
          annotations:
            summary: Container named {{$labels.container}} in {{$labels.pod}} in {{$labels.namespace}} is using more than 75% of Memory Limit
          expr: |
            ((( sum(container_memory_usage_bytes{image!="",container_name!="POD", namespace!="kube-system"}) by (namespace,container_name,pod_name)  / sum(container_spec_memory_limit_bytes{image!="",container_name!="POD",namespace!="kube-system"}) by (namespace,container_name,pod_name) ) * 100 ) < +Inf ) > 75
          for: 5m
          labels:
            team: dev

        - alert: High CPU Usage of Container
          annotations:
            summary: Container named {{$labels.container}} in {{$labels.pod}} in {{$labels.namespace}} is using more than 75% of CPU Limit
          expr: |
            ((sum(irate(container_cpu_usage_seconds_total{image!="",container_name!="POD", namespace!="kube-system"}[30s])) by (namespace,container_name,pod_name) / sum(container_spec_cpu_quota{image!="",container_name!="POD", namespace!="kube-system"} / container_spec_cpu_period{image!="",container_name!="POD", namespace!="kube-system"}) by (namespace,container_name,pod_name) ) * 100)  > 75
          for: 5m
          labels:
            team: dev

      - name: Nodes
        rules:
        - alert: High Node Memory Usage
          annotations:
            summary: Node {{$labels.kubernetes_io_hostname}} has more than 80% memory used. Plan Capcity
          expr: |
            (sum (container_memory_working_set_bytes{id="/",container_name!="POD"}) by (kubernetes_io_hostname) / sum (machine_memory_bytes{}) by (kubernetes_io_hostname) * 100) > 80
          for: 5m
          labels:
            team: devops

        - alert: High Node CPU Usage
          annotations:
            summary: Node {{$labels.kubernetes_io_hostname}} has more than 80% allocatable cpu used. Plan Capacity.
          expr: |
            (sum(rate(container_cpu_usage_seconds_total{id="/", container_name!="POD"}[1m])) by (kubernetes_io_hostname) / sum(machine_cpu_cores) by (kubernetes_io_hostname)  * 100) > 80
          for: 5m
          labels:
            team: devops

        - alert: High Node Disk Usage
          annotations:
            summary: Node {{$labels.kubernetes_io_hostname}} has more than 85% disk used. Plan Capacity.
          expr: |
            (sum(container_fs_usage_bytes{device=~"^/dev/[sv]d[a-z][1-9]$",id="/",container_name!="POD"}) by (kubernetes_io_hostname) / sum(container_fs_limit_bytes{container_name!="POD",device=~"^/dev/[sv]d[a-z][1-9]$",id="/"}) by (kubernetes_io_hostname)) * 100 > 85
          for: 5m
          labels:
            team: devops
Deploying Prometheus Stateful Set
apiVersion: storage.k8s.io/v1beta1
kind: StorageClass
metadata:
  name: fast
  namespace: monitoring
provisioner: kubernetes.io/gce-pd
allowVolumeExpansion: true
---
apiVersion: apps/v1beta1
kind: StatefulSet
metadata:
  name: prometheus
  namespace: monitoring
spec:
  replicas: 3
  serviceName: prometheus-service
  template:
    metadata:
      labels:
        app: prometheus
        thanos-store-api: "true"
    spec:
      serviceAccountName: monitoring
      containers:
        - name: prometheus
          image: prom/prometheus:v2.4.3
          args:
            - "--config.file=/etc/prometheus-shared/prometheus.yaml"
            - "--storage.tsdb.path=/prometheus/"
            - "--web.enable-lifecycle"
            - "--storage.tsdb.no-lockfile"
            - "--storage.tsdb.min-block-duration=2h"
            - "--storage.tsdb.max-block-duration=2h"
          ports:
            - name: prometheus
              containerPort: 9090
          volumeMounts:
            - name: prometheus-storage
              mountPath: /prometheus/
            - name: prometheus-config-shared
              mountPath: /etc/prometheus-shared/
            - name: prometheus-rules
              mountPath: /etc/prometheus/rules
        - name: thanos
          image: quay.io/thanos/thanos:v0.8.0
          args:
            - "sidecar"
            - "--log.level=debug"
            - "--tsdb.path=/prometheus"
            - "--prometheus.url=http://127.0.0.1:9090"
            - "--objstore.config={type: GCS, config: {bucket: prometheus-long-term}}"
            - "--reloader.config-file=/etc/prometheus/prometheus.yaml.tmpl"
            - "--reloader.config-envsubst-file=/etc/prometheus-shared/prometheus.yaml"
            - "--reloader.rule-dir=/etc/prometheus/rules/"
          env:
            - name: POD_NAME
              valueFrom:
                fieldRef:
                  fieldPath: metadata.name
            - name : GOOGLE_APPLICATION_CREDENTIALS
              value: /etc/secret/thanos-gcs-credentials.json
          ports:
            - name: http-sidecar
              containerPort: 10902
            - name: grpc
              containerPort: 10901
          livenessProbe:
              httpGet:
                port: 10902
                path: /-/healthy
          readinessProbe:
            httpGet:
              port: 10902
              path: /-/ready
          volumeMounts:
            - name: prometheus-storage
              mountPath: /prometheus
            - name: prometheus-config-shared
              mountPath: /etc/prometheus-shared/
            - name: prometheus-config
              mountPath: /etc/prometheus
            - name: prometheus-rules
              mountPath: /etc/prometheus/rules
            - name: thanos-gcs-credentials
              mountPath: /etc/secret
              readOnly: false
      securityContext:
        fsGroup: 2000
        runAsNonRoot: true
        runAsUser: 1000
      volumes:
        - name: prometheus-config
          configMap:
            defaultMode: 420
            name: prometheus-server-conf
        - name: prometheus-config-shared
          emptyDir: {}
        - name: prometheus-rules
          configMap:
            name: prometheus-rules
        - name: thanos-gcs-credentials
          secret:
            secretName: thanos-gcs-credentials
  volumeClaimTemplates:
  - metadata:
      name: prometheus-storage
      namespace: monitoring
    spec:
      accessModes: [ "ReadWriteOnce" ]
      storageClassName: fast
      resources:
        requests:
          storage: 20Gi
It is important to understand the following about the above manifest:
- Prometheus is deployed as a stateful set with three replicas. Each replica provisions its own persistent volume dynamically.
- Prometheus configuration is generated by the Thanos Sidecar container using the template file created above.
- Thanos handles data compaction and therefore we need to set --storage.tsdb.min-block-duration=2h and --storage.tsdb.max-block-duration=2h
- Prometheus stateful set is labeled as thanos-store-api: "true" so that each pod gets discovered by the headless service (we will show you how to do that next). This headless service will be used by Thanos Query to query data across all the Prometheus instances.
- We apply the same label to the Thanos Store and Thanos Ruler component so that they are also discovered by the querier and can be used for querying metrics.
- The GCS bucket credentials path is provided using the GOOGLE_APPLICATION_CREDENTIALS environment variable. The configuration file is mounted to that from the secret created as a part of the prerequisites.
Deploying Prometheus Services
apiVersion: v1
kind: Service
metadata:
  name: prometheus-0-service
  annotations:
    prometheus.io/scrape: "true"
    prometheus.io/port: "9090"
  namespace: monitoring
  labels:
    name: prometheus
spec:
  selector:
    statefulset.kubernetes.io/pod-name: prometheus-0
  ports:
    - name: prometheus
      port: 8080
      targetPort: prometheus
---
apiVersion: v1
kind: Service
metadata:
  name: prometheus-1-service
  annotations:
    prometheus.io/scrape: "true"
    prometheus.io/port: "9090"
  namespace: monitoring
  labels:
    name: prometheus
spec:
  selector:
    statefulset.kubernetes.io/pod-name: prometheus-1
  ports:
    - name: prometheus
      port: 8080
      targetPort: prometheus
---
apiVersion: v1
kind: Service
metadata:
  name: prometheus-2-service
  annotations:
    prometheus.io/scrape: "true"
    prometheus.io/port: "9090"
  namespace: monitoring
  labels:
    name: prometheus
spec:
  selector:
    statefulset.kubernetes.io/pod-name: prometheus-2
  ports:
    - name: prometheus
      port: 8080
      targetPort: prometheus
---
#This service creates a srv record for querier to find about store-api's
apiVersion: v1
kind: Service
metadata:
  name: thanos-store-gateway
  namespace: monitoring
spec:
  type: ClusterIP
  clusterIP: None
  ports:
    - name: grpc
      port: 10901
      targetPort: grpc
  selector:
    thanos-store-api: "true"
We create different services for each Prometheus pod in the stateful set. These are not strictly necessary, but are created only for debugging purposes. The purpose of thanos-store-gateway headless service has been explained above. Next, we will expose the Prometheus services using an ingress object.
Deploying Thanos Query: this is one of the main components of Thanos deployment. Note the following
- The container argument --store=dnssrv+thanos-store-gateway:10901 helps discover all the components from which metric data should be queried.
- The service thanos-querier provides a web interface to run PromQL queries. It also has the option to deduplicate data across various Prometheus clusters.
- From here, we provide Grafana as a datasource for all the dashboards.
apiVersion: v1
kind: Namespace
metadata:
  name: monitoring
---
apiVersion: apps/v1
kind: Deployment
metadata:
  name: thanos-querier
  namespace: monitoring
  labels:
    app: thanos-querier
spec:
  replicas: 1
  selector:
    matchLabels:
      app: thanos-querier
  template:
    metadata:
      labels:
        app: thanos-querier
    spec:
      containers:
      - name: thanos
        image: quay.io/thanos/thanos:v0.8.0
        args:
        - query
        - --log.level=debug
        - --query.replica-label=replica
        - --store=dnssrv+thanos-store-gateway:10901
        ports:
        - name: http
          containerPort: 10902
        - name: grpc
          containerPort: 10901
        livenessProbe:
          httpGet:
            port: http
            path: /-/healthy
        readinessProbe:
          httpGet:
            port: http
            path: /-/ready
---
apiVersion: v1
kind: Service
metadata:
  labels:
    app: thanos-querier
  name: thanos-querier
  namespace: monitoring
spec:
  ports:
  - port: 9090
    protocol: TCP
    targetPort: http
    name: http
  selector:
    app: thanos-querier
Deploying Thanos Store Gateway: this will create the store component which serves metrics from the object storage to the querier.
apiVersion: v1
kind: Namespace
metadata:
  name: monitoring
---
apiVersion: apps/v1beta1
kind: StatefulSet
metadata:
  name: thanos-store-gateway
  namespace: monitoring
  labels:
    app: thanos-store-gateway
spec:
  replicas: 1
  selector:
    matchLabels:
      app: thanos-store-gateway
  serviceName: thanos-store-gateway
  template:
    metadata:
      labels:
        app: thanos-store-gateway
        thanos-store-api: "true"
    spec:
      containers:
        - name: thanos
          image: quay.io/thanos/thanos:v0.8.0
          args:
          - "store"
          - "--log.level=debug"
          - "--data-dir=/data"
          - "--objstore.config={type: GCS, config: {bucket: prometheus-long-term}}"
          - "--index-cache-size=500MB"
          - "--chunk-pool-size=500MB"
          env:
            - name : GOOGLE_APPLICATION_CREDENTIALS
              value: /etc/secret/thanos-gcs-credentials.json
          ports:
          - name: http
            containerPort: 10902
          - name: grpc
            containerPort: 10901
          livenessProbe:
            httpGet:
              port: 10902
              path: /-/healthy
          readinessProbe:
            httpGet:
              port: 10902
              path: /-/ready
          volumeMounts:
            - name: thanos-gcs-credentials
              mountPath: /etc/secret
              readOnly: false
      volumes:
        - name: thanos-gcs-credentials
          secret:
            secretName: thanos-gcs-credentials
---
Deploying Thanos Compact
apiVersion: v1
kind: Namespace
metadata:
  name: monitoring
---
apiVersion: apps/v1beta1
kind: StatefulSet
metadata:
  name: thanos-compactor
  namespace: monitoring
  labels:
    app: thanos-compactor
spec:
  replicas: 1
  selector:
    matchLabels:
      app: thanos-compactor
  serviceName: thanos-compactor
  template:
    metadata:
      labels:
        app: thanos-compactor
    spec:
      containers:
        - name: thanos
          image: quay.io/thanos/thanos:v0.8.0
          args:
            - "compact"
            - "--log.level=debug"
            - "--data-dir=/data"
            - "--objstore.config={type: GCS, config: {bucket: prometheus-long-term}}"
            - "--wait"
          env:
            - name : GOOGLE_APPLICATION_CREDENTIALS
              value: /etc/secret/thanos-gcs-credentials.json
          ports:
            - name: http
              containerPort: 10902
          livenessProbe:
            httpGet:
              port: 10902
              path: /-/healthy
          readinessProbe:
            httpGet:
              port: 10902
              path: /-/ready
          volumeMounts:
            - name: thanos-gcs-credentials
              mountPath: /etc/secret
              readOnly: false
      volumes:
        - name: thanos-gcs-credentials
          secret:
            secretName: thanos-gcs-credentials
Deploying Thanos Ruler
apiVersion: v1
kind: Namespace
metadata:
  name: monitoring
---
apiVersion: v1
kind: ConfigMap
metadata:
  name: thanos-ruler-rules
  namespace: monitoring
data:
  alert_down_services.rules.yaml: |
    groups:
    - name: metamonitoring
      rules:
      - alert: PrometheusReplicaDown
        annotations:
          message: Prometheus replica in cluster {{$labels.cluster}} has disappeared from Prometheus target discovery.
        expr: |
          sum(up{cluster="prometheus-ha", instance=~".*:9090", job="kubernetes-service-endpoints"}) by (job,cluster) < 3
        for: 15s
        labels:
          severity: critical
---
apiVersion: apps/v1beta1
kind: StatefulSet
metadata:
  labels:
    app: thanos-ruler
  name: thanos-ruler
  namespace: monitoring
spec:
  replicas: 1
  selector:
    matchLabels:
      app: thanos-ruler
  serviceName: thanos-ruler
  template:
    metadata:
      labels:
        app: thanos-ruler
        thanos-store-api: "true"
    spec:
      containers:
        - name: thanos
          image: quay.io/thanos/thanos:v0.8.0
          args:
            - rule
            - --log.level=debug
            - --data-dir=/data
            - --eval-interval=15s
            - --rule-file=/etc/thanos-ruler/*.rules.yaml
            - --alertmanagers.url=http://alertmanager:9093
            - --query=thanos-querier:9090
            - "--objstore.config={type: GCS, config: {bucket: thanos-ruler}}"
            - --label=ruler_cluster="prometheus-ha"
            - --label=replica="$(POD_NAME)"
          env:
            - name : GOOGLE_APPLICATION_CREDENTIALS
              value: /etc/secret/thanos-gcs-credentials.json
            - name: POD_NAME
              valueFrom:
                fieldRef:
                  fieldPath: metadata.name
          ports:
            - name: http
              containerPort: 10902
            - name: grpc
              containerPort: 10901
          livenessProbe:
            httpGet:
              port: http
              path: /-/healthy
          readinessProbe:
            httpGet:
              port: http
              path: /-/ready
          volumeMounts:
            - mountPath: /etc/thanos-ruler
              name: config
            - name: thanos-gcs-credentials
              mountPath: /etc/secret
              readOnly: false
      volumes:
        - configMap:
            name: thanos-ruler-rules
          name: config
        - name: thanos-gcs-credentials
          secret:
            secretName: thanos-gcs-credentials
---
apiVersion: v1
kind: Service
metadata:
  labels:
    app: thanos-ruler
  name: thanos-ruler
  namespace: monitoring
spec:
  ports:
    - port: 9090
      protocol: TCP
      targetPort: http
      name: http
  selector:
    app: thanos-ruler
If you go to the interactive shell in the same namespace as our workloads to check which pods thanos-store-gateway resolves, you will see something like this:
root@my-shell-95cb5df57-4q6w8:/# nslookup thanos-store-gateway
Server:		10.63.240.10
Address:	10.63.240.10#53

Name:	thanos-store-gateway.monitoring.svc.cluster.local
Address: 10.60.25.2
Name:	thanos-store-gateway.monitoring.svc.cluster.local
Address: 10.60.25.4
Name:	thanos-store-gateway.monitoring.svc.cluster.local
Address: 10.60.30.2
Name:	thanos-store-gateway.monitoring.svc.cluster.local
Address: 10.60.30.8
Name:	thanos-store-gateway.monitoring.svc.cluster.local
Address: 10.60.31.2

root@my-shell-95cb5df57-4q6w8:/# exit
The IPs returned above correspond to our Prometheus pods, thanos-store and thanos-ruler. This can be verified as:
$ kubectl get pods -o wide -l thanos-store-api="true"
NAME                     READY   STATUS    RESTARTS   AGE    IP           NODE                              NOMINATED NODE   READINESS GATES
prometheus-0             2/2     Running   0          100m   10.60.31.2   gke-demo-1-pool-1-649cbe02-jdnv   <none>           <none>
prometheus-1             2/2     Running   0          14h    10.60.30.2   gke-demo-1-pool-1-7533d618-kxkd   <none>           <none>
prometheus-2             2/2     Running   0          31h    10.60.25.2   gke-demo-1-pool-1-4e9889dd-27gc   <none>           <none>
thanos-ruler-0           1/1     Running   0          100m   10.60.30.8   gke-demo-1-pool-1-7533d618-kxkd   <none>           <none>
thanos-store-gateway-0   1/1     Running   0          14h    10.60.25.4   gke-demo-1-pool-1-4e9889dd-27gc   <none>           <none>
Deploying Alertmanager: This will create our alertmanager deployment. It will deliver all the alerts generated as per Prometheus Rules.
apiVersion: v1
kind: Namespace
metadata:
  name: monitoring
---
kind: ConfigMap
apiVersion: v1
metadata:
  name: alertmanager
  namespace: monitoring
data:
  config.yml: |-
    global:
      resolve_timeout: 5m
      slack_api_url: "<your_slack_hook>"
      victorops_api_url: "<your_victorops_hook>"

    templates:
    - '/etc/alertmanager-templates/*.tmpl'
    route:
      group_by: ['alertname', 'cluster', 'service']
      group_wait: 10s
      group_interval: 1m
      repeat_interval: 5m
      receiver: default
      routes:
      - match:
          team: devops
        receiver: devops
        continue: true
      - match:
          team: dev
        receiver: dev
        continue: true

    receivers:
    - name: 'default'

    - name: 'devops'
      victorops_configs:
      - api_key: '<YOUR_API_KEY>'
        routing_key: 'devops'
        message_type: 'CRITICAL'
        entity_display_name: '{{ .CommonLabels.alertname }}'
        state_message: 'Alert: {{ .CommonLabels.alertname }}. Summary:{{ .CommonAnnotations.summary }}. RawData: {{ .CommonLabels }}'
      slack_configs:
      - channel: '#k8-alerts'
        send_resolved: true


    - name: 'dev'
      victorops_configs:
      - api_key: '<YOUR_API_KEY>'
        routing_key: 'dev'
        message_type: 'CRITICAL'
        entity_display_name: '{{ .CommonLabels.alertname }}'
        state_message: 'Alert: {{ .CommonLabels.alertname }}. Summary:{{ .CommonAnnotations.summary }}. RawData: {{ .CommonLabels }}'
      slack_configs:
      - channel: '#k8-alerts'
        send_resolved: true

---
apiVersion: extensions/v1beta1
kind: Deployment
metadata:
  name: alertmanager
  namespace: monitoring
spec:
  replicas: 1
  selector:
    matchLabels:
      app: alertmanager
  template:
    metadata:
      name: alertmanager
      labels:
        app: alertmanager
    spec:
      containers:
      - name: alertmanager
        image: prom/alertmanager:v0.15.3
        args:
          - '--config.file=/etc/alertmanager/config.yml'
          - '--storage.path=/alertmanager'
        ports:
        - name: alertmanager
          containerPort: 9093
        volumeMounts:
        - name: config-volume
          mountPath: /etc/alertmanager
        - name: alertmanager
          mountPath: /alertmanager
      volumes:
      - name: config-volume
        configMap:
          name: alertmanager
      - name: alertmanager
        emptyDir: {}
---
apiVersion: v1
kind: Service
metadata:
  annotations:
    prometheus.io/scrape: 'true'
    prometheus.io/path: '/metrics'
  labels:
    name: alertmanager
  name: alertmanager
  namespace: monitoring
spec:
  selector:
    app: alertmanager
  ports:
  - name: alertmanager
    protocol: TCP
    port: 9093
    targetPort: 9093
Deploying Kubestate Metrics: Kubestate metrics deployment is needed to relay some important container metrics. These metrics are not natively exposed by the kubelet and are not directly available to Prometheus.
apiVersion: v1
kind: Namespace
metadata:
  name: monitoring
---
apiVersion: rbac.authorization.k8s.io/v1
# kubernetes versions before 1.8.0 should use rbac.authorization.k8s.io/v1beta1
kind: ClusterRoleBinding
metadata:
  name: kube-state-metrics
roleRef:
  apiGroup: rbac.authorization.k8s.io
  kind: ClusterRole
  name: kube-state-metrics
subjects:
- kind: ServiceAccount
  name: kube-state-metrics
  namespace: monitoring
---
apiVersion: rbac.authorization.k8s.io/v1
# kubernetes versions before 1.8.0 should use rbac.authorization.k8s.io/v1beta1
kind: ClusterRole
metadata:
  name: kube-state-metrics
rules:
- apiGroups: [""]
  resources:
  - configmaps
  - secrets
  - nodes
  - pods
  - services
  - resourcequotas
  - replicationcontrollers
  - limitranges
  - persistentvolumeclaims
  - persistentvolumes
  - namespaces
  - endpoints
  verbs: ["list", "watch"]
- apiGroups: ["extensions"]
  resources:
  - daemonsets
  - deployments
  - replicasets
  verbs: ["list", "watch"]
- apiGroups: ["apps"]
  resources:
  - statefulsets
  verbs: ["list", "watch"]
- apiGroups: ["batch"]
  resources:
  - cronjobs
  - jobs
  verbs: ["list", "watch"]
- apiGroups: ["autoscaling"]
  resources:
  - horizontalpodautoscalers
  verbs: ["list", "watch"]
---
apiVersion: rbac.authorization.k8s.io/v1
# kubernetes versions before 1.8.0 should use rbac.authorization.k8s.io/v1beta1
kind: RoleBinding
metadata:
  name: kube-state-metrics
  namespace: monitoring
roleRef:
  apiGroup: rbac.authorization.k8s.io
  kind: Role
  name: kube-state-metrics-resizer
subjects:
- kind: ServiceAccount
  name: kube-state-metrics
  namespace: monitoring
---
apiVersion: rbac.authorization.k8s.io/v1
# kubernetes versions before 1.8.0 should use rbac.authorization.k8s.io/v1beta1
kind: Role
metadata:
  namespace: monitoring
  name: kube-state-metrics-resizer
rules:
- apiGroups: [""]
  resources:
  - pods
  verbs: ["get"]
- apiGroups: ["extensions"]
  resources:
  - deployments
  resourceNames: ["kube-state-metrics"]
  verbs: ["get", "update"]
---
apiVersion: v1
kind: ServiceAccount
metadata:
  name: kube-state-metrics
  namespace: monitoring
---
apiVersion: apps/v1
kind: Deployment
metadata:
  name: kube-state-metrics
  namespace: monitoring
spec:
  selector:
    matchLabels:
      k8s-app: kube-state-metrics
  replicas: 1
  template:
    metadata:
      labels:
        k8s-app: kube-state-metrics
    spec:
      serviceAccountName: kube-state-metrics
      containers:
      - name: kube-state-metrics
        image: quay.io/mxinden/kube-state-metrics:v1.4.0-gzip.3
        ports:
        - name: http-metrics
          containerPort: 8080
        - name: telemetry
          containerPort: 8081
        readinessProbe:
          httpGet:
            path: /healthz
            port: 8080
          initialDelaySeconds: 5
          timeoutSeconds: 5
      - name: addon-resizer
        image: k8s.gcr.io/addon-resizer:1.8.3
        resources:
          limits:
            cpu: 150m
            memory: 50Mi
          requests:
            cpu: 150m
            memory: 50Mi
        env:
          - name: MY_POD_NAME
            valueFrom:
              fieldRef:
                fieldPath: metadata.name
          - name: MY_POD_NAMESPACE
            valueFrom:
              fieldRef:
                fieldPath: metadata.namespace
        command:
          - /pod_nanny
          - --container=kube-state-metrics
          - --cpu=100m
          - --extra-cpu=1m
          - --memory=100Mi
          - --extra-memory=2Mi
          - --threshold=5
          - --deployment=kube-state-metrics
---
apiVersion: v1
kind: Service
metadata:
  name: kube-state-metrics
  namespace: monitoring
  labels:
    k8s-app: kube-state-metrics
  annotations:
    prometheus.io/scrape: 'true'
spec:
  ports:
  - name: http-metrics
    port: 8080
    targetPort: http-metrics
    protocol: TCP
  - name: telemetry
    port: 8081
    targetPort: telemetry
    protocol: TCP
  selector:
    k8s-app: kube-state-metrics
Deploying Node-exporter Daemonset: Node-exporter daemonset runs a node-exporter pod on each node. It exposes very important node metrics that can be pulled by Prometheus instances.
apiVersion: v1
kind: Namespace
metadata:
  name: monitoring
---
apiVersion: extensions/v1beta1
kind: DaemonSet
metadata:
  name: node-exporter
  namespace: monitoring
  labels:
    name: node-exporter
spec:
  template:
    metadata:
      labels:
        name: node-exporter
      annotations:
         prometheus.io/scrape: "true"
         prometheus.io/port: "9100"
    spec:
      hostPID: true
      hostIPC: true
      hostNetwork: true
      containers:
        - name: node-exporter
          image: prom/node-exporter:v0.16.0
          securityContext:
            privileged: true
          args:
            - --path.procfs=/host/proc
            - --path.sysfs=/host/sys
          ports:
            - containerPort: 9100
              protocol: TCP
          resources:
            limits:
              cpu: 100m
              memory: 100Mi
            requests:
              cpu: 10m
              memory: 100Mi
          volumeMounts:
            - name: dev
              mountPath: /host/dev
            - name: proc
              mountPath: /host/proc
            - name: sys
              mountPath: /host/sys
            - name: rootfs
              mountPath: /rootfs
      volumes:
        - name: proc
          hostPath:
            path: /proc
        - name: dev
          hostPath:
            path: /dev
        - name: sys
          hostPath:
            path: /sys
        - name: rootfs
          hostPath:
            path: /
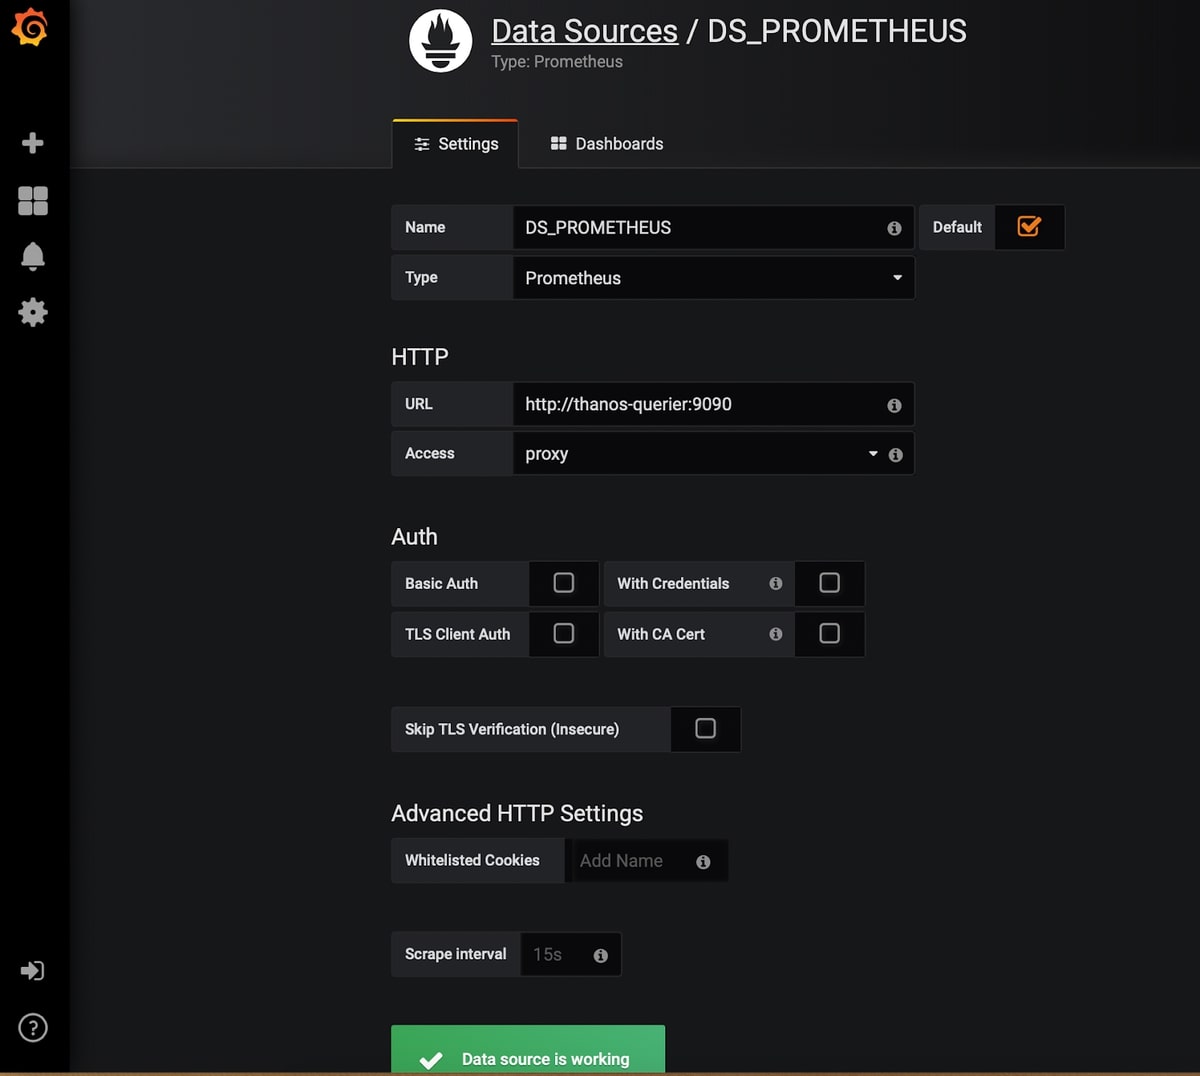
Deploying Grafana This will create our Grafana deployment and Service which will be exposed using our ingress object. We should add thanos-querier as the datasource for our Grafana deployment. In order to do so:
- Click on Add DataSource
- Set Name: DS_PROMETHEUS
- Set Type: Prometheus
- Set URL: http://thanos-querier:9090
- Save and Test. You can now build your custom dashboards or simply import dashboards from grafana.net. Dashboard #315 and #1471 are a very good place to start.
apiVersion: v1
kind: Namespace
metadata:
  name: monitoring
---
apiVersion: storage.k8s.io/v1beta1
kind: StorageClass
metadata:
  name: fast
  namespace: monitoring
provisioner: kubernetes.io/gce-pd
allowVolumeExpansion: true
---
apiVersion: apps/v1beta1
kind: StatefulSet
metadata:
  name: grafana
  namespace: monitoring
spec:
  replicas: 1
  serviceName: grafana
  template:
    metadata:
      labels:
        task: monitoring
        k8s-app: grafana
    spec:
      containers:
      - name: grafana
        image: k8s.gcr.io/heapster-grafana-amd64:v5.0.4
        ports:
        - containerPort: 3000
          protocol: TCP
        volumeMounts:
        - mountPath: /etc/ssl/certs
          name: ca-certificates
          readOnly: true
        - mountPath: /var
          name: grafana-storage
        env:
        - name: GF_SERVER_HTTP_PORT
          value: "3000"
          # The following env variables are required to make Grafana accessible via
          # the kubernetes api-server proxy. On production clusters, we recommend
          # removing these env variables, setup auth for grafana, and expose the grafana
          # service using a LoadBalancer or a public IP.
        - name: GF_AUTH_BASIC_ENABLED
          value: "false"
        - name: GF_AUTH_ANONYMOUS_ENABLED
          value: "true"
        - name: GF_AUTH_ANONYMOUS_ORG_ROLE
          value: Admin
        - name: GF_SERVER_ROOT_URL
          # If you're only using the API Server proxy, set this value instead:
          # value: /api/v1/namespaces/kube-system/services/monitoring-grafana/proxy
          value: /
      volumes:
      - name: ca-certificates
        hostPath:
          path: /etc/ssl/certs
  volumeClaimTemplates:
  - metadata:
      name: grafana-storage
      namespace: monitoring
    spec:
      accessModes: [ "ReadWriteOnce" ]
      storageClassName: fast
      resources:
        requests:
          storage: 5Gi
---
apiVersion: v1
kind: Service
metadata:
  labels:
    kubernetes.io/cluster-service: 'true'
    kubernetes.io/name: grafana
  name: grafana
  namespace: monitoring
spec:
  ports:
  - port: 3000
    targetPort: 3000
  selector:
    k8s-app: grafana
Deploying the Ingress Object: This is the final piece in the puzzle. This will help expose all our services outside the Kubernetes cluster and help us access them.
Make sure you replace <yourdomain> with your own domain name. You can point the ingress-controller’s service to.
apiVersion: extensions/v1beta1
kind: Ingress
metadata:
  name: monitoring-ingress
  namespace: monitoring
  annotations:
    kubernetes.io/ingress.class: "nginx"
spec:
  rules:
  - host: grafana.<yourdomain>.com
    http:
      paths:
      - path: /
        backend:
          serviceName: grafana
          servicePort: 3000
  - host: prometheus-0.<yourdomain>.com
    http:
      paths:
      - path: /
        backend:
          serviceName: prometheus-0-service
          servicePort: 8080
  - host: prometheus-1.<yourdomain>.com
    http:
      paths:
      - path: /
        backend:
          serviceName: prometheus-1-service
          servicePort: 8080
  - host: prometheus-2.<yourdomain>.com
    http:
      paths:
      - path: /
        backend:
          serviceName: prometheus-2-service
          servicePort: 8080
  - host: alertmanager.<yourdomain>.com
    http:
      paths:
      - path: /
        backend:
          serviceName: alertmanager
          servicePort: 9093
  - host: thanos-querier.<yourdomain>.com
    http:
      paths:
      - path: /
        backend:
          serviceName: thanos-querier
          servicePort: 9090
  - host: thanos-ruler.<yourdomain>.com
    http:
      paths:
      - path: /
        backend:
          serviceName: thanos-ruler
          servicePort: 9090
You should now be able to access Thanos Querier at http://thanos-querier.<yourdomain>.com . It will look something like this:
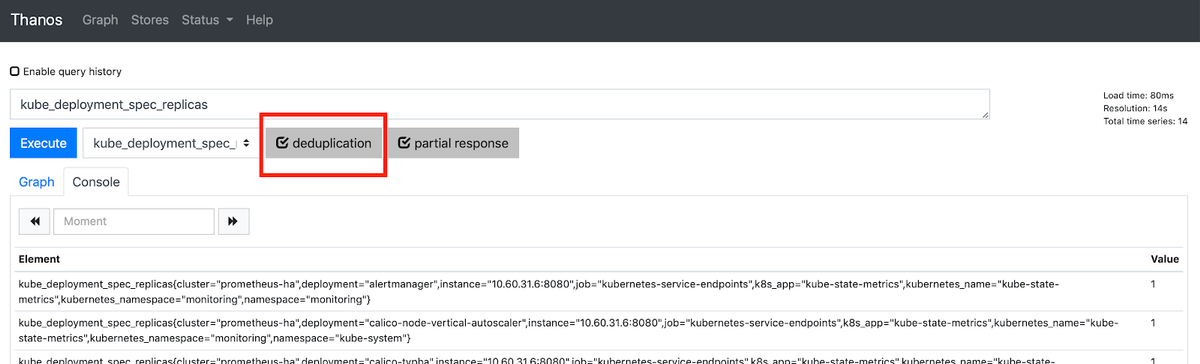
Make sure deduplication is selected.
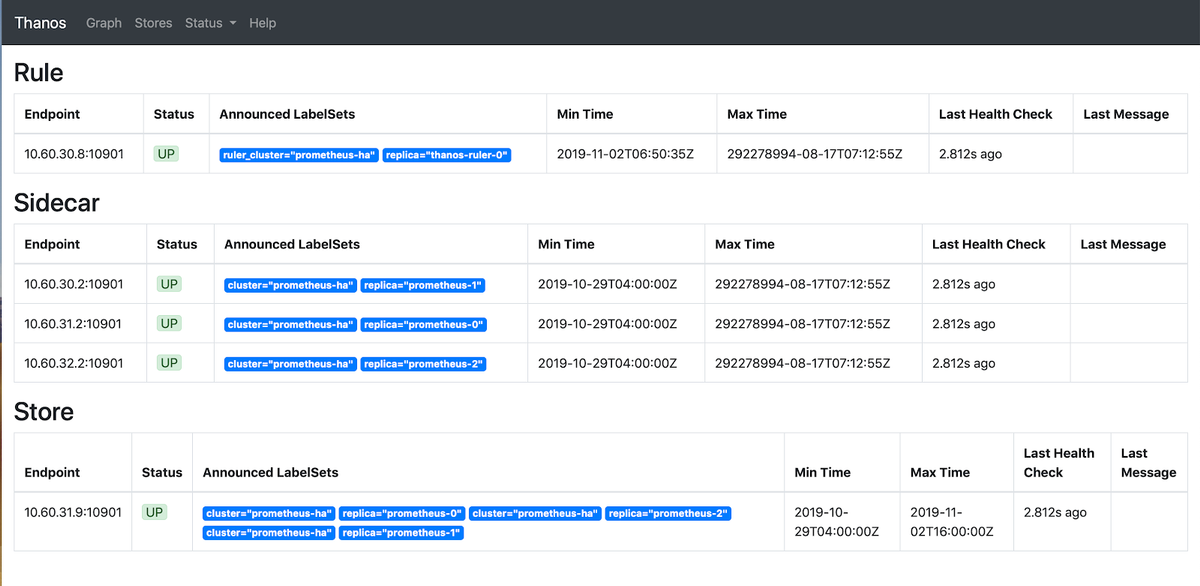
If you click on Stores, you will be able to see all the active endpoints discovered by thanos-store-gateway.
Grafana Dashboards
Finally, you add Thanos Querier as the datasource in Grafana and start creating dashboards.
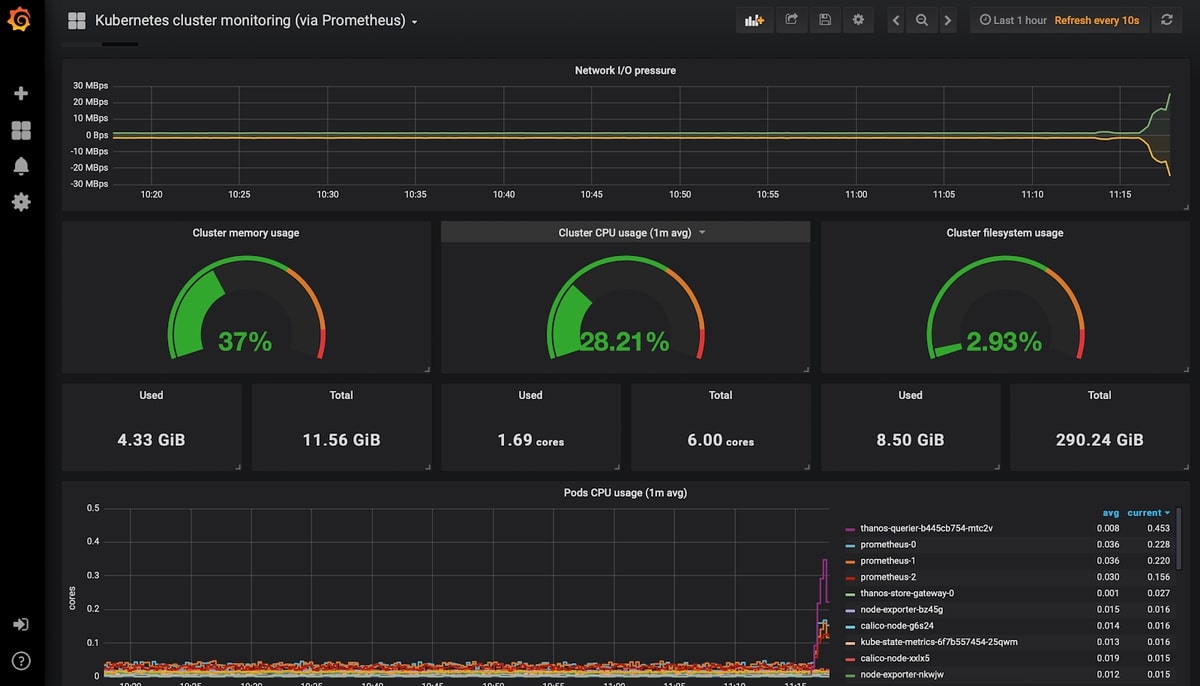
Kubernetes Cluster Monitoring Dashboard:
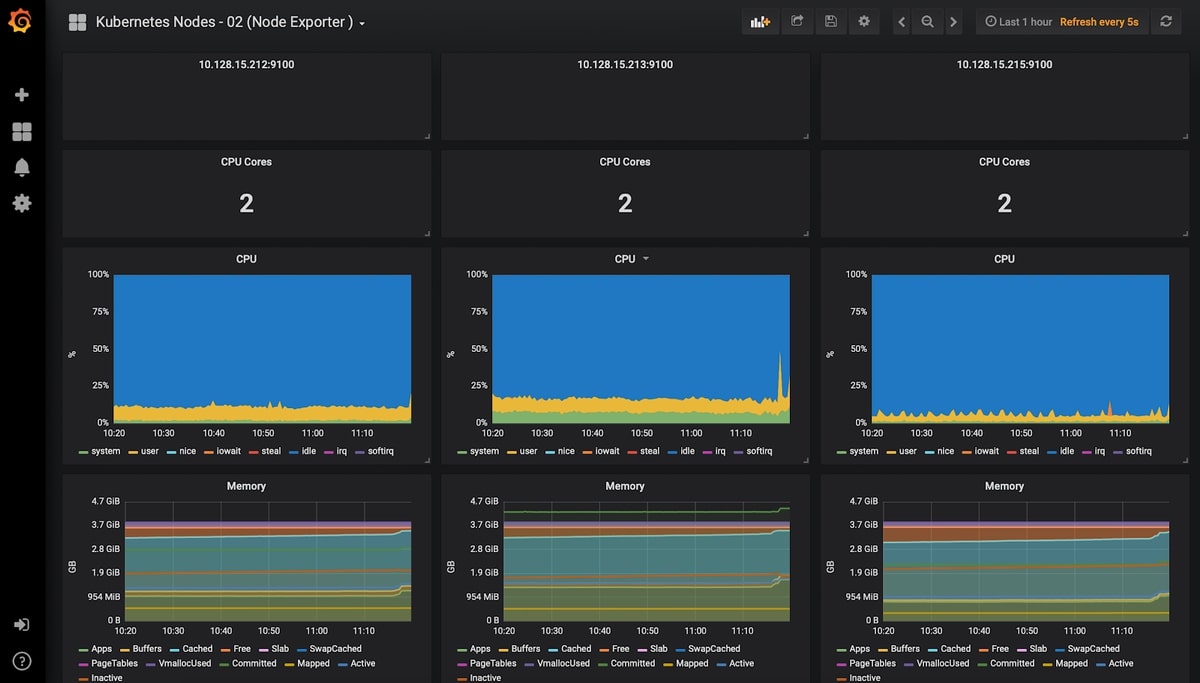
Kubernetes Node Monitoring Dashboard:
Conclusion
Integrating Thanos with Prometheus allows you to scale Prometheus horizontally. Since Thanos Querier can pull metrics from other Querier instances, you can pull metrics across clusters and visualize them in Grafana dashboards. Thanos lets us archive metric data in an object store that provides infinite storage for our monitoring system. It also serves metrics from the object storage itself. A major operating cost for this setup can be attributed to the object storage (S3 or GCS). This can be reduced if we apply appropriate retention policies to them.
Today’s setup requires quite a bit of configuration on your part. The manifests provided above have been tested in a production environment and should make the process easy for you. Feel free to reach out should you have any questions about them. If you decide that you don’t want to do the configuration yourself, we have a hosted Graphite offering where you can offload it to us and we will happily manage it for you. Try a free trial, or book a demo to talk to us directly.
This article was written by our guest blogger Vaibhav Thakur. If you liked this article, check out his LinkedIn for more.