Table of Contents
The problem: A web application is quite big, and we get tons of errors every day just from people using it. How can we prioritize which errors to fix?
The solution: We can use Sentry to track specific errors that occur on production, and use Hosted Graphite’s Sentry webhook add-on to add annotations to our system performance graphs. This way we can correlate when a specific error occurs with our system usage spikes.
Sentry is an application that can alert you when an app gets an error. It can alert specific errors so you can see when and where something broke. If we use Sentry annotations along with MetricFire's Grafana graphs, we can track when errors occur on any of our system performance monitors. A use case would be if an error loops for a long time, you will be able to see how much the CPU is being stressed by this one error and give it a high priority tag to fix.
The setup given below will be based on some previous knowledge. If you are not familiar with webhooks or setting up a system monitoring solution with Hosted Graphite, check out our intro to webhooks or our article on GitHub annotations, which shows you how to set up the Hosted Graphite Webhooks.
Setting Things Up
Sentry side: Let’s first get our webhook URL from Hosted Graphite. Go to Add-Ons, then Add-Ons from the dashboard of your account. Don't forget, you can sign up for the MetricFire free trial and use our platform to follow along with this tutorial.
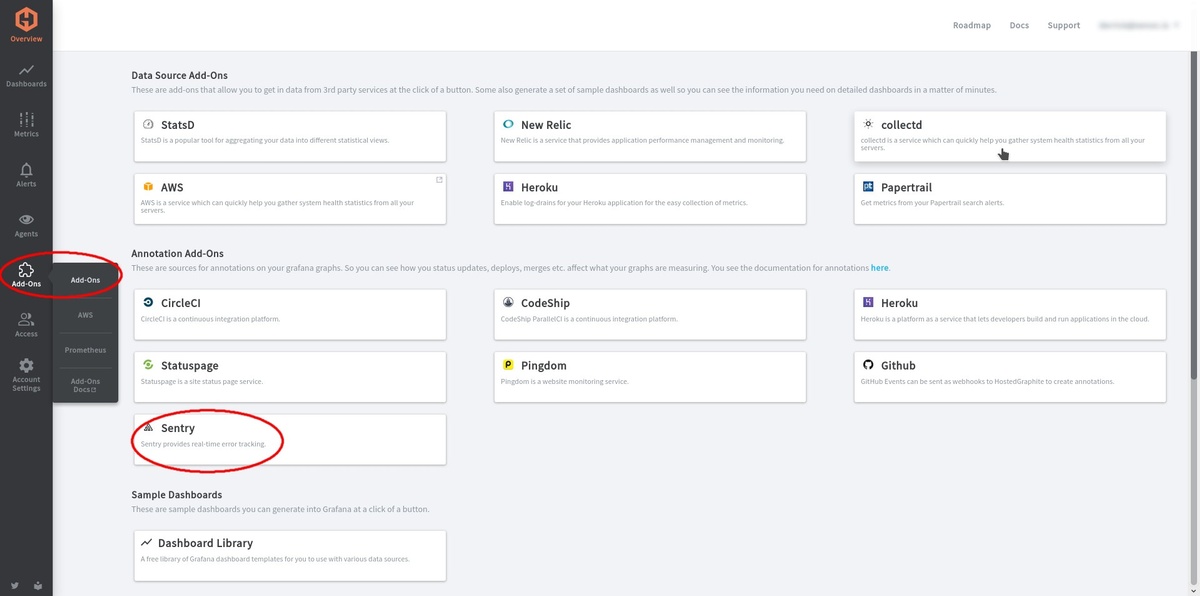
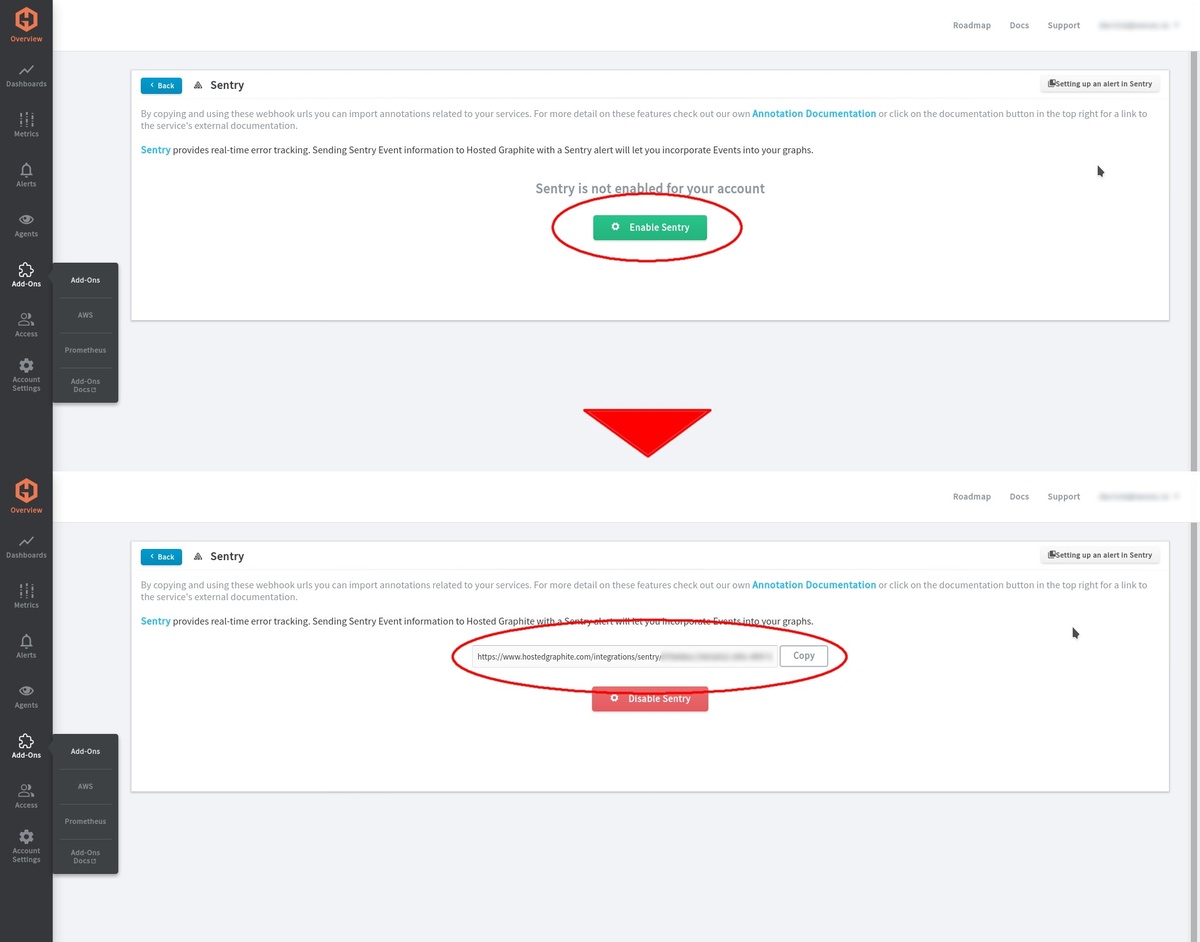
Then we can activate the Sentry add-on in the Hosted Graphite interface and copy the webhook URL.
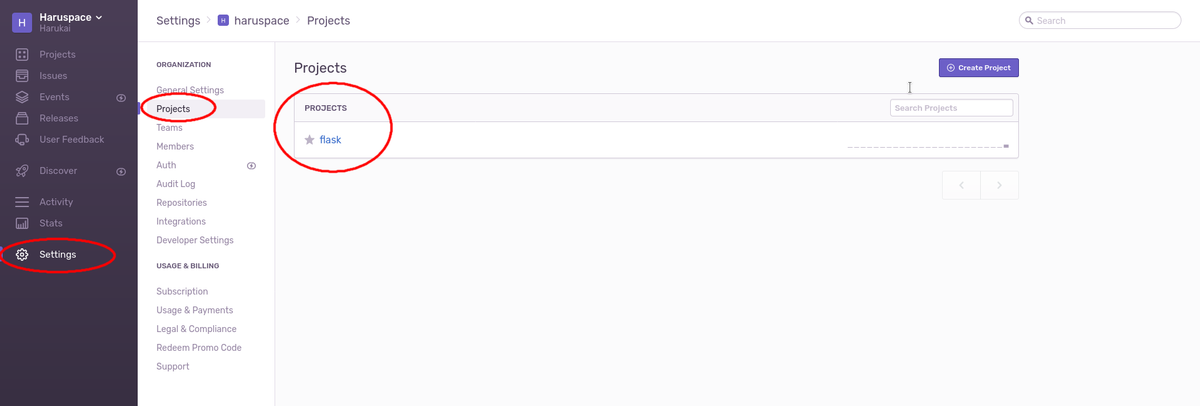
Next, we will go to our Sentry account page and use this webhook with the same project that we're monitoring with Hosted Graphite. On your Sentry account page, go to Settings > Projects > Then select the project you want to track with annotations.
Once you click on your project page, go to Alerts > Settings. On this tab, you can add integrations to the alerts of this project. We will select webhooks here and it should then let us insert our webhook URL from MetricFire.
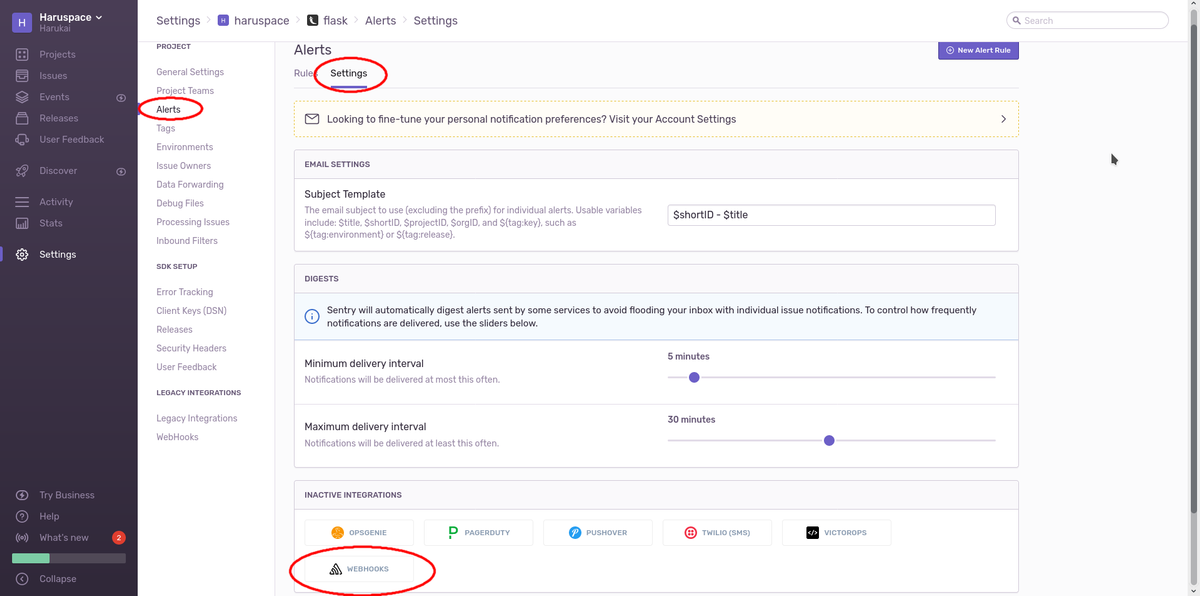
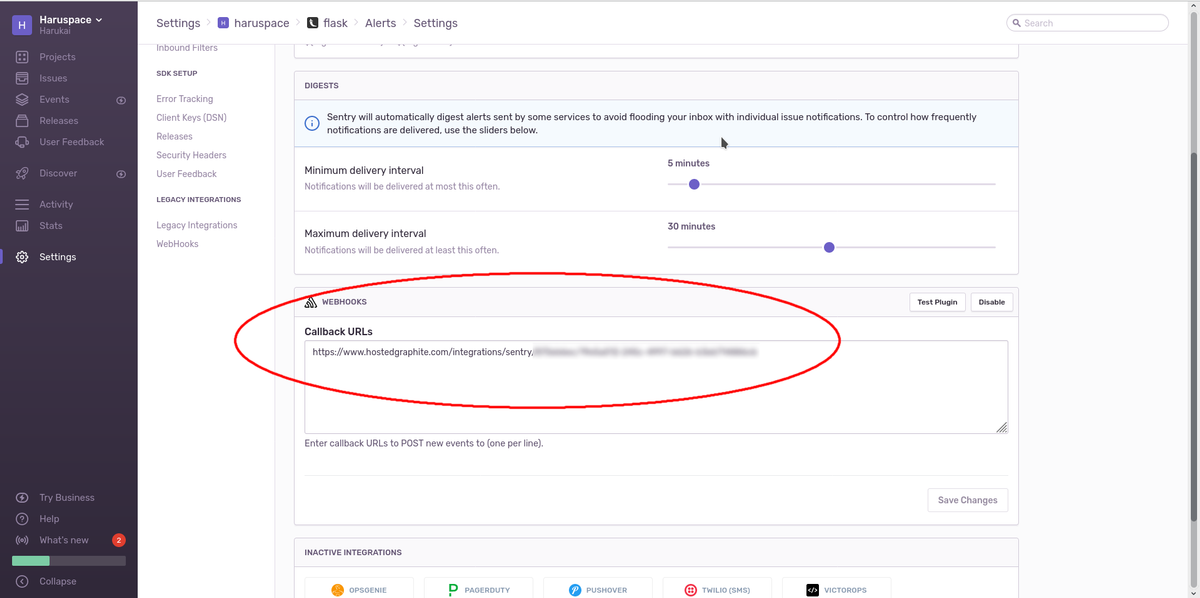
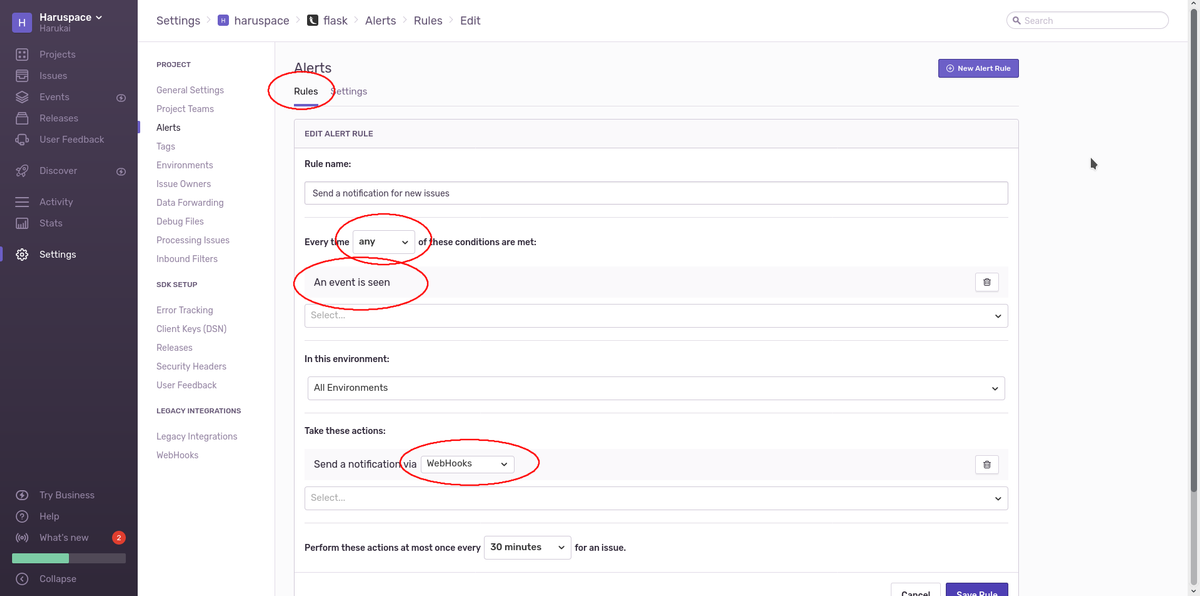
Once our webhook is set, we are now able to send this project’s alerts to our graphs on Hosted Graphite. Next, we need to set up the alerts to our liking. You can use these settings for testing purposes.
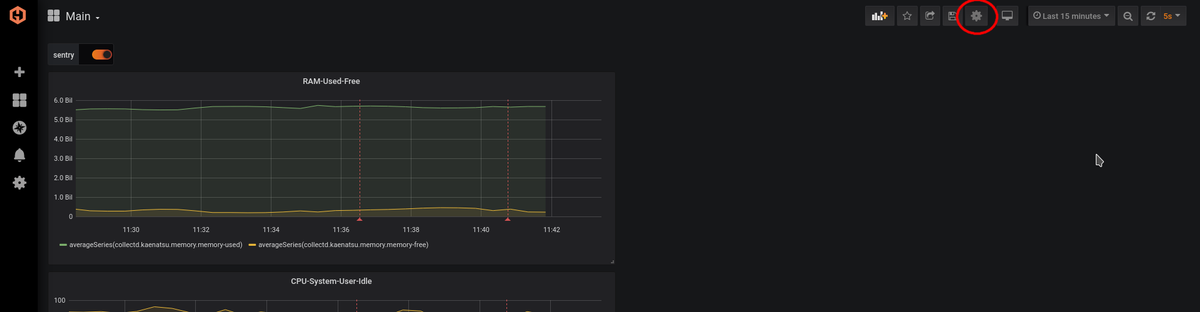
MetricFire's side: All we need to do now is show the alert data that is being sent to our Hosted Graphite's Grafana graphs. First, we need to go to the Grafana graph’s dashboard that we want to have the annotations on. Then go to the settings on the gear icon on the top right.
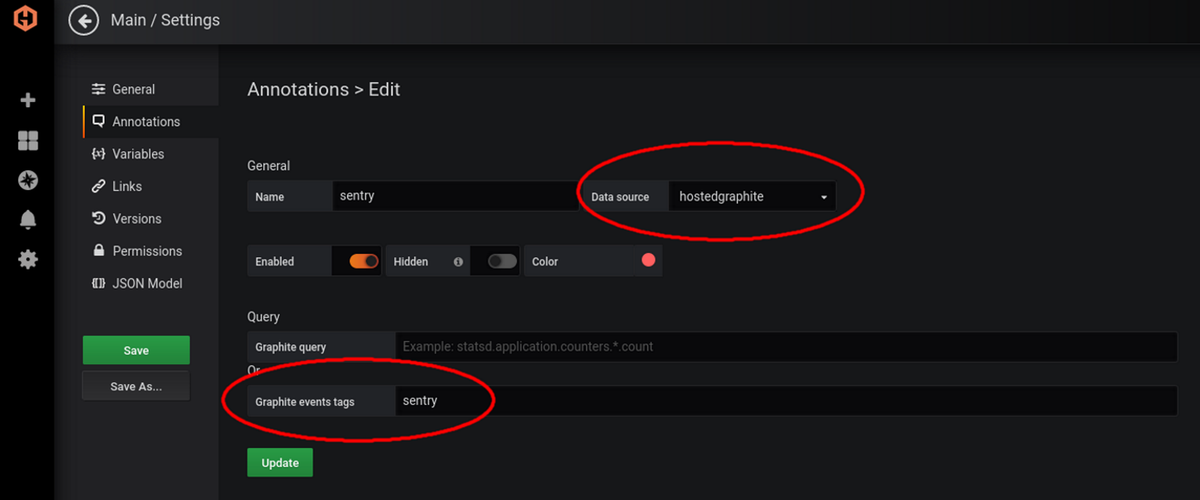
The settings tab should pop up and have an Annotations tab. We want to create New.
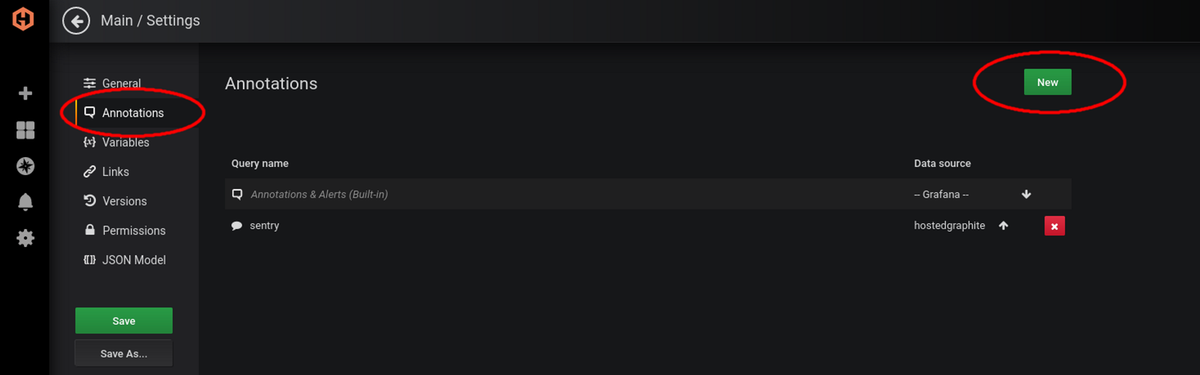
The data source should be set to MetricFire, and the Graphite event tags should have sentry as an option.
Once both the Sentry side and MetricFire side are set up properly, your graphs should be able to display Sentry alerts. You can either go back to your Sentry project’s alert tab to test the webhook plugin or force an error on your application.
The Result
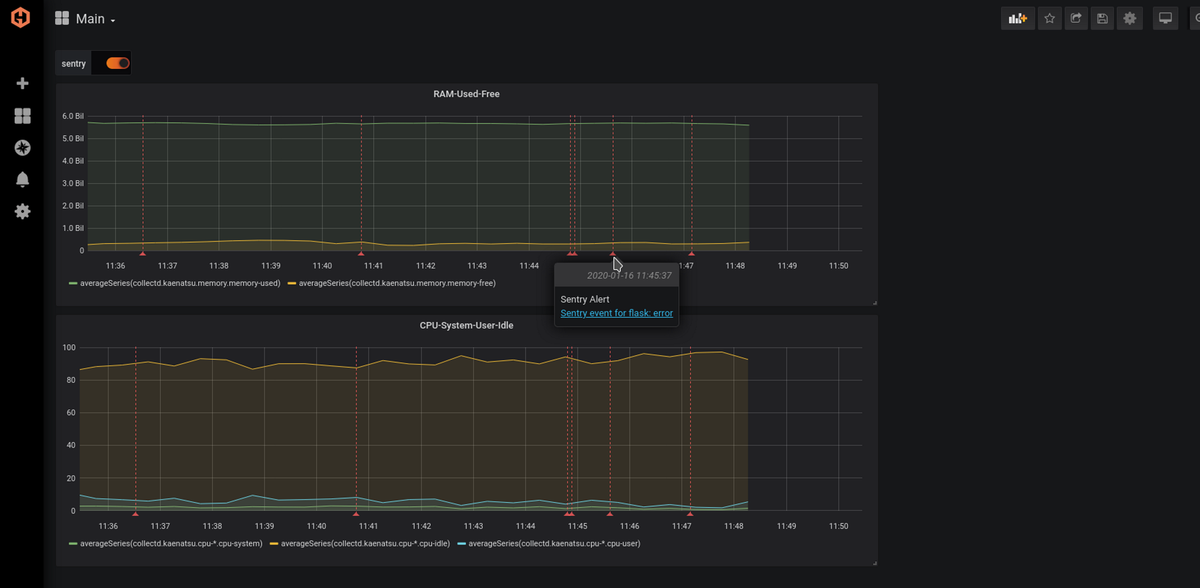
You can see that the graphs above are displaying Sentry annotation alerts from a Flask app. If you click on the link in these annotations, it will take you to your Sentry account's project page for that error. The graph above is not a production server, but when monitoring a live production server the Sentry annotations would be helpful to quickly show you what's going on.
Get to know our MetricFire better, and get a free trial so you can start making dashboards right away. Feel free to book a demo if you have questions about what MetricFire can do for you.


