Table of Contents

Introduction
This article will outline what Redis database monitoring is and how to set up a Redis database monitoring system with MetricFire. Then we’ll show what the final graphs and dashboards look like when displayed on Grafana. We will be using Prometheus and Grafana to power the monitoring, and we'll use a simulated Redis DB to generate the data for the Grafana dashboards.
What are Redis DB and Redis Clusters?
A Redis Database is an in-memory Data Structure Store that organizes data into key-value pairs which can be used as a database, cache, or message broker. Redis DB is open-source, and there are various hosted services offered. A Redis data structure is efficient both in terms of performance and ease of use. Redis DBs are usually used for data that needs to be retrieved quickly, such as a password that is connected to a single username, or for data that is transient and can be deleted shortly afterward. The simple command-line interface reduces developmental effort and the in-memory component reduces latency and increases throughput.
A Redis cluster is an implementation of Redis DB that allows data to be automatically shared across multiple Redis nodes. Clusters also provide a level of redundancy and availability during partitioning, meaning data can be communicated/transmitted when a node is recovering or failing. Redis Clusters also run on a master-slave model which protects data in the event of a “master” node failure.
Each Redis cluster has a metrics_exporter component that listens on port 8070, and acts as a Prometheus endpoint from which Prometheus can get metrics. Monitoring Redis metrics with Prometheus causes little to no load to the database. Redis will push the required metrics to the Prometheus endpoint where users can scrape Prometheus for the available Redis metrics, avoiding scraping Redis each time a metric is queried. You can monitor the total number of keys in a Redis cluster, the current number of commands processed, memory usage, and total Redis connections. In addition, you can monitor cluster-wide data, individual node data, or single database data.
If you are using hosted Prometheus by MetricFire, it works in exactly the same way. MetricFire scrapes the Redis DB endpoint for metrics information and displays it automatically in the Grafana dashboard.
How do you set up Redis Cluster Monitoring?
a. Install Prometheus and Redis in MetricFire UI
- Go to the Add-Ons menu on the left-hand side of the UI.
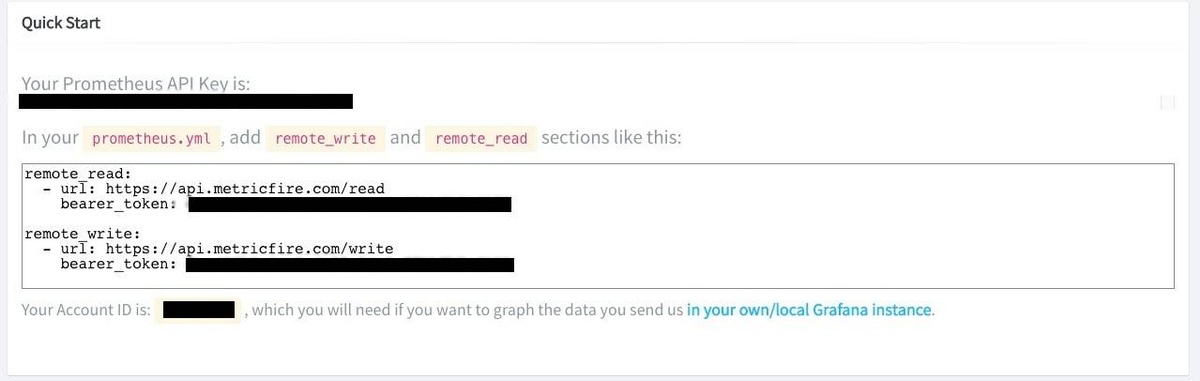
- Find Your Prometheus API Key.
- Edit the prometheus.yml file to include remote_write and remote_read sections with the API Key as bearer_token.
b. Edit Prometheus Configuration to include Redis Enterprise Job
According to docs.redislabs.com, copy the Prometheus configuration from the above step into ./prometheus/prometheus.yml in your current folder. The cluster name can be either the fully-qualified domain name or the IP address.

c. Add Data Source to Grafana Dashboard in the UI.
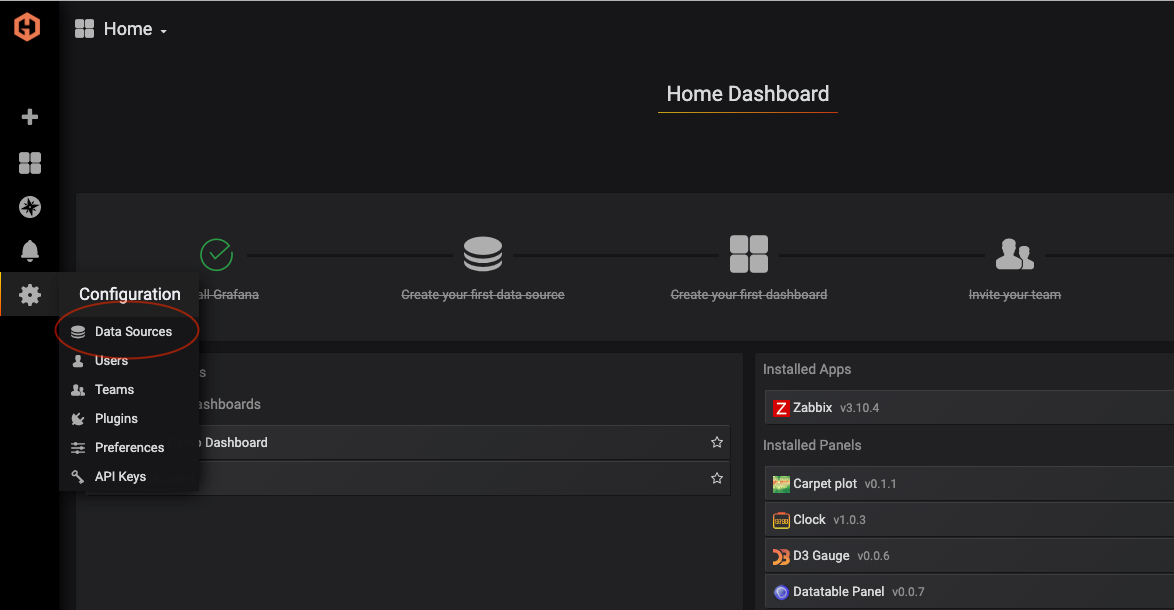
In the MetricFire UI, go to Dashboards on the left side menu, and click Grafana. As seen below,
Go to the Data Source menu.
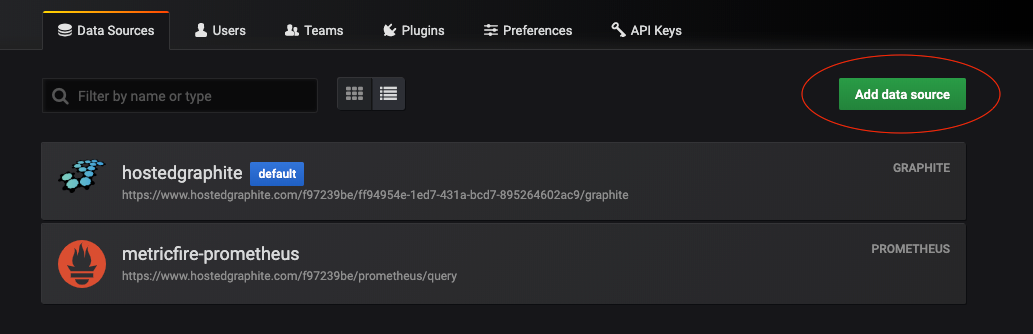
Add Prometheus as a Data Source.
As seen below, you can see the Prometheus data source settings menu. Change the URL to http://localhost:9090. For Access, select Browser. Then, click Save & Test.

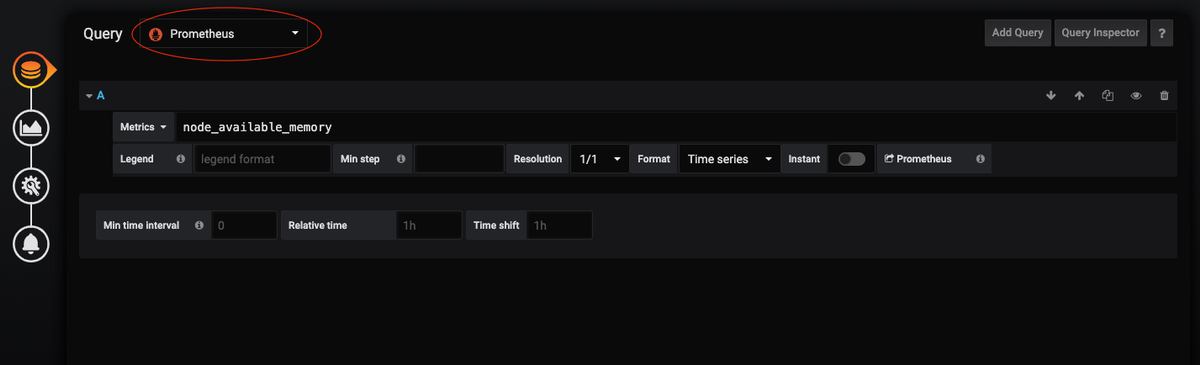
c. To view data in Grafana Dashboards, change Data Source to Prometheus
Then, change the Data Source to Prometheus to see your data shown in the Grafana Dashboard.
Example dashboards of Redis Cluster monitoring with Prometheus
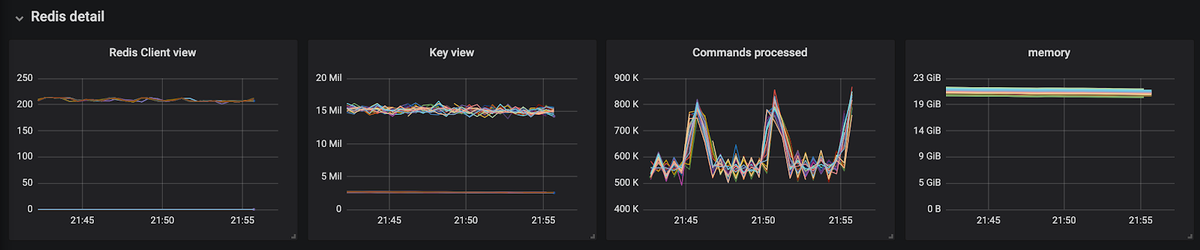
Graph 1 - Dashboard Row with four Graphs

This is an example of a row within a Grafana Dashboard. This row is made up of four panels. Grafana has the ability to group graphs, text, and tables into relevant categories so you can easily sort through different metrics within one dashboard. Organizing your panels helps with correlation and being able to quickly troubleshoot the issue.
This dashboard is showing four metrics pushed from our Redis DB. They are:
- Redis Client view - the total number of Redis clients
- Key view - the total number of keys in each Redis DB instance
- Commands processed - the number of commands processed per group of machines
- Memory - total memory usage for each different aggregation machines
Graph 2 - Redis on Aggregation Machines
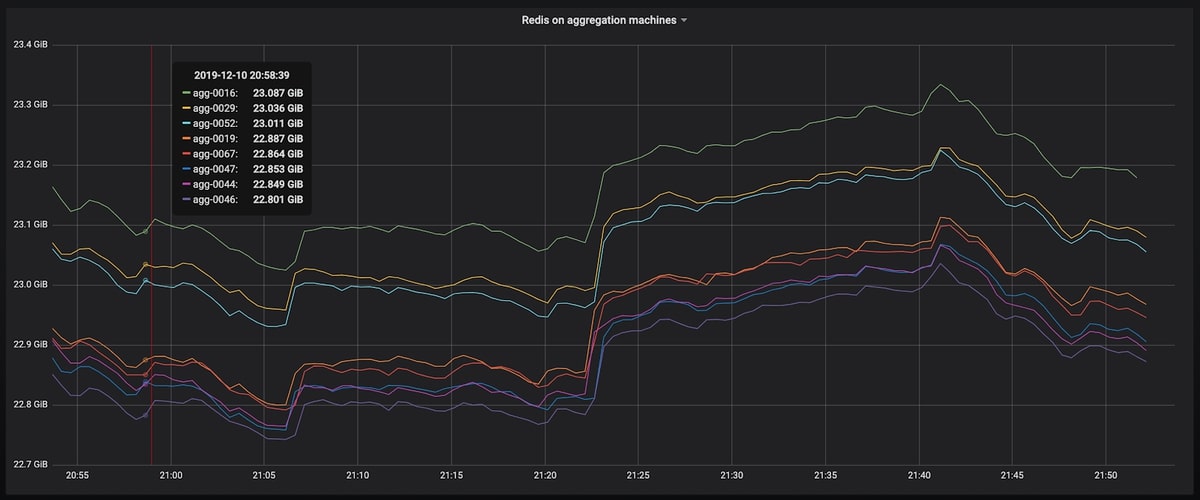
This graph shows the total memory usage for different aggregation machines. These machines are responsible for gathering data that is ingested and aggregating the data into more manageable formats. We want to monitor how much memory each resource is using. When a resource is getting close to max memory consumption, performance will start to decrease. A spike in memory usage can act as an identifier for important changes in your application and processes.
The graph is ‘stacked’ meaning the total range between lines is what the current metric is reading. This makes it easier to see the different metrics being sent when their values are all similar. This graph also has a floating legend, which helps with easy reading.
Graph 3 - Commands Processed
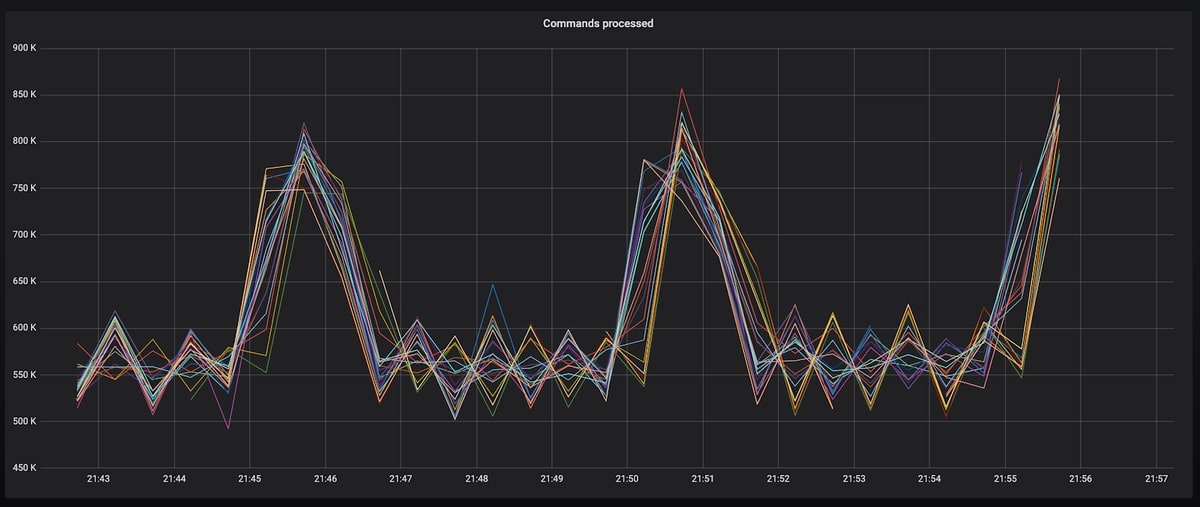
This is the zoomed in ‘Commands Processed’ graph from the row above. It shows the different groups of machines running a Redis DB instance and their associated number of commands processed. The ‘Commands Processed’ graph is an important metric to graph because it allows DB administrators to monitor commands passed to Redis DB. This shows us the traffic and potential stress placed on the resource.
Graph 4 - Key View
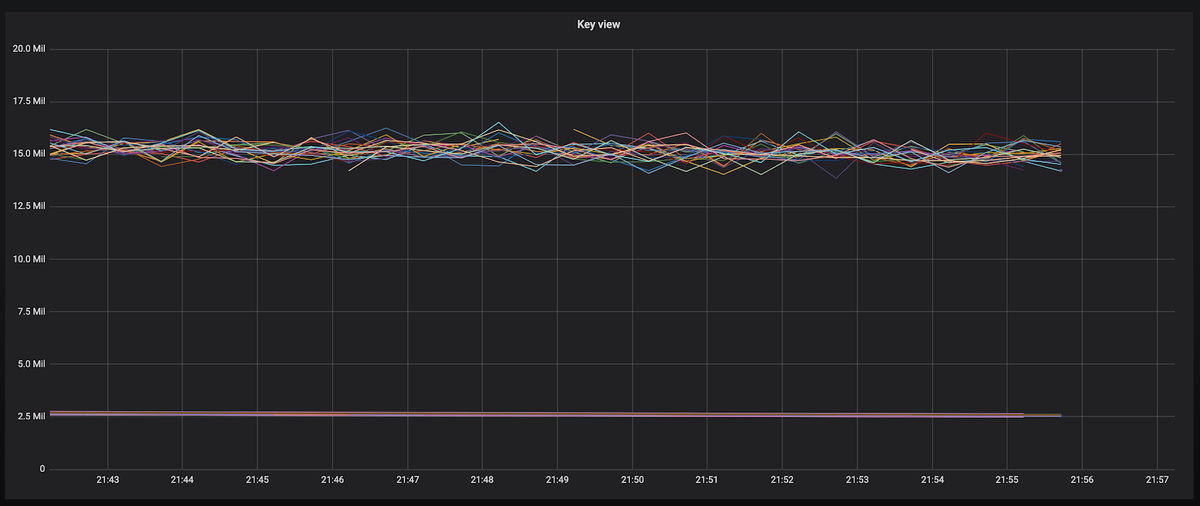
This is the zoomed in Key View graph from the dashboard row above. This is showing the total number of keys in each Redis DB instance.
Similar to the other graphs, knowing the total number of keys within an instance gives administrators greater insight into each Redis DB. If you are using Redis DB as a distributed caching store, then a graph like this will be useful to ensure each instance is being properly balanced and utilized. If an instance is showing a significant drop in keys then this is an indicator to look into this issue further.
Key Metrics for Redis DB
There are a lot of metrics that are automatically pushed from Redis DB. Take a look at a few below, and you can find a full list on the Redis website.
- Bdb_avg_latency - Average latency of operations on the database in microseconds
- Bdb_conns - Number of client connections to database
- Bdb_ingress_bytes - Rates if incoming network traffic to DB in bytes/second
- Bdb_no_of_keys - Number of keys in database
- Node_conns - Number of clients connected to endpoints on nodes
- Node_cpu_user - CPU time portion spent by users-pace process
- Node_free_memory - Free memory in a node in bytes
- Node_up - If a node is part of the cluster and is connected
- Redis_up - Shard is up and running
Conclusion
To learn more about what you can do with MetricFire, check out our blog for tutorials like building Grafana dashboards, or how to deploy Grafana to Kubernetes.
Also, try a free trial and set up your Redis monitoring today. We're also happy to jump on a call with you - you can book a demo here!

