Table of Contents
Introduction
Collecting metrics about your servers, applications, and traffic is a critical part of an application development project. There are many things that can go wrong in production systems, and collecting and organizing data can help you pinpoint bottlenecks and problems in your infrastructure.
In this article, we will discuss Graphite and StatsD, and how they can help form the basis of monitoring infrastructure. You can also try it on your own with our Hosted Graphite trial account - sign up for the free trial here.
Graphite is a library made up of several components. We’ll take a brief look at each component here:
Key Takeaways
- Collecting metrics for servers, applications, and traffic is crucial for identifying and addressing issues in production systems. It helps in pinpointing bottlenecks and problems in your infrastructure.
- Graphite is introduced as a monitoring solution with several components, including the Graphite web application for creating and saving graphs, Carbon as the storage backend, and Whisper for data storage, which allows for different resolutions of data.
- StatsD, a node.js application, is discussed as a tool to transmit data points related to networks, servers, and applications, which can then be visualized in graphs.
- To handle the increased load, horizontal scaling for StatsD is mentioned, including the use of a StatsD Cluster Proxy that uses consistent hashing to ensure accurate metric aggregation.
Graphite web application
Graphite web application is the place where you can create graphs and plot data. The web application allows you to save graph properties and layouts.
Carbon
Carbon is the storage backend for graphite. Carbon is essentially a daemon that can be configured to run on TCP/UDP ports. To handle the increasing load and configure replication and sharding, multiple carbon daemon can be run on the same host, or multiple hosts, and can be load distributed using carbon relay.
Whisper
Whisper is a database format that graphite uses to store the data.
Whisper allows for higher resolutions (seconds per point) of recent data to degrade into lower resolutions for long-term retention of historical data.
Now that we have discussed, Graphite, we will discuss StatsD
StatsD
StatsD is a node.js application. It was made in order to transmit data points about networks, servers, and applications - which can then be rendered into graphs.
Setup
Here is the very simple docker-compose.yml:
version: "3"
services:
  graphite-statsd:
    image: graphiteapp/docker-graphite-statsd
    ports:
      - 2003-2004:2003-2004
      - 2023-2024:2023-2024
      - 8125:8125/udp
      - 8126:8126
      - 80:80
After running this docker image, browse to http://localhost, the browser will load the graphite web application as shown below:

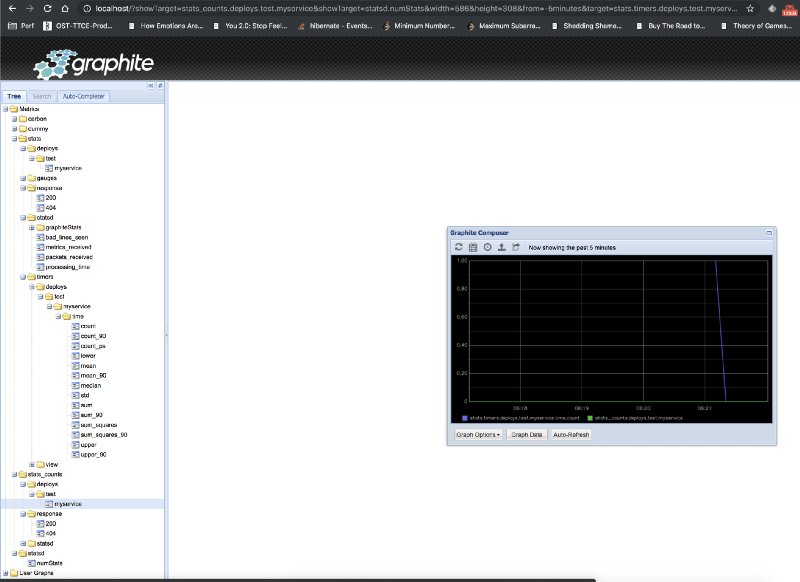
At this point, the Graphite metrics should be empty. Let’s test out the deployment, we can send a simple metric to our StatsD demon using the below command:
echo "deploys.test.myservice:1|c" | nc -w 1 -u localhost 8125
Here the syntax is as follows:
bucket:value|type
Bucket
The bucket is an identifier for the metric. Metric datagrams with the same bucket and the same type are considered occurrences of the same event by the server. In the example above, we used “deploys.test.myservice” as our buckets.
Value
The value is a number that is associated with the metric. Values have different meanings depending on the metric’s type.
Type
The type will determine what type of metric it is. There are different metric types such as timers, counters, gauges, histograms, etc.
Counters
Counters, as the name suggests, simply count an occurrence. For example, if you want to count how many times an order has been created. You would create a counter such as “order. create” and increment it every time an order is created within your application. The usefulness of this metric comes when observed over a time interval. That can give you the number of orders created within a day or number of hours etc.
Timers
Timers are different from counters as they measure the time interval. For example, if you want to measure how much time a REST API takes to respond, you would use a timer. The single metric of a timer is not very useful, for example, 100 ms. It's more useful when combined over a time interval, such as 6 hours. There are various sub-metrics automatically computed with each metric such as mean, standard deviation, 50th percentile, 90th percentile, 95th percentile, etc.
echo "deploys.test.myservice.time:55|ms" | nc -w 1 -u localhost 8125
Gauges
Gauges are used for fixed values which can either increase or decrease. For example, you could use a gauge to represent the number of threads in an application, or the number of jobs in a queue.
Here is our carbon web application showing both the counter and timer values on a single graph:
Integration with Node.js
Just now, we have seen how to send metrics through the command line. In real life, that won’t be the case as the metrics would be generated by some applications such as those running the Node.js or Java-based servers.
Let’s see how an application written in node.js can send metrics. Consider an express server running on port 3000 as seen below:
const express = require("express");
const app = express();

app.get("/", (req, res) => {
    res.send("Response from a simple GET API");
});

app.listen(3000, () => {
    console.log("Node server started on port 3000");
});
First, we need to install node-statsd using npm as:
npm i node-statsd --save
We then create an instance of the StatsD client as follows:
const StatsD = require("node-statsd"), client = new StatsD();
The StatsD constructor takes a number of optional arguments such as the host and port of the machine which is running the StatsD server. The full documentation can be found at https://github.com/sivy/node-statsd.
In my case, I was running the StatsD on the default option which is http://localhost and port 8125.
Once we have created an instance of the client, we can call various methods to send metrics to our application. For example, we can track the count and the timing of the API invocations as follows:
app.get("/", (req, res) => {
    res.send("Response from a simple GET API");
    client.increment("api_counter");
    client.timing("api_response_time", 110);
});
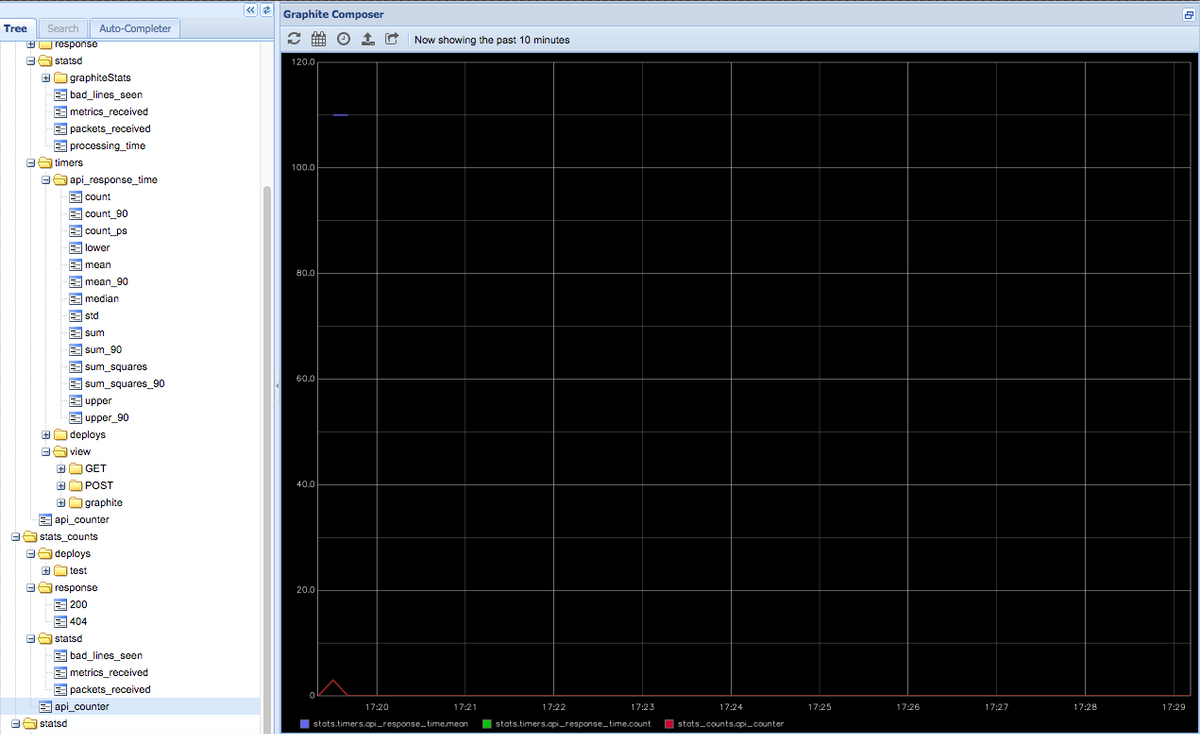
As soon as I type http://localhost:3000 in my browser, the API gets invoked and the StatsD client gets into action. I am able to see the updated metrics in my graphite web application.
For all the possible methods available on the client instance, check out the documentation at https://github.com/sivy/node-statsd.
Integration with Java
Integration with Java-based clients is very similar to Node.js. If you are using a build system such as Maven or Gradle (which is highly recommended), there is a utility jar available to make this integration easier. Add the following to the build configuration to have it included automatically:
For Maven:
<dependency>

      <groupId>com.timgroup</groupId>

      <artifactId>java-statsd-client</artifactId>

      <version>3.1.0</version>

</dependency>
For Gradle:
compile group: 'com.timgroup', name: 'java-statsd-client', version: '3.1.0'
Once the client library is imported, we will create the instance of the StatsDClient interface using the implementation class NonBlockingStatsDclient providing our desired prefix, hostname, and port on which our StatsD server is running.
As shown below, there are straightforward methods available on this interface such as time(), incrementCounter(), etc. which will send the Graphite to the StatsD server. For the full documentation, refer to https://github.com/tim-group/java-statsd-client.
package example.statsd;

import com.timgroup.statsd.NonBlockingStatsDClient;
import com.timgroup.statsd.StatsDClient;

public class App {

   private static final StatsDClient statsd = new NonBlockingStatsDClient("java.statsd.example.prefix", "localhost", 8125);

   public static void main(String[] args) {
       statsd.incrementCounter("java_main_method_counter");
       statsd.time("java_method_time", 125L);

       statsd.stop();
   }
}
Horizontally Scaling StatsD
Regarding the infrastructure, a single StatsD server would not be able to handle all of the load and would ultimately need horizontal scaling. Horizontal scaling with StatsD cannot be a simple round-robin load balancing because one can perform aggregation in StatsD as well. If the metrics for the same key are distributed across multiple nodes, a single StatsD cannot aggregate accurately over a metric.
Hence, the creators of SatsD have released a StatsD Cluster Proxy that uses consistent hashing to make sure that the same metrics are always sent to the same instance.
Below is a very simple configuration for the StatsD cluster proxy:
{
    nodes: [
    {host: 'host1', port: 8125, adminport: 8128},
    {host: 'host2', port: 8125, adminport: 8130},
    {host: 'host3', port: 8125, adminport: 8132}
    ],
    server: './servers/udp',
    host:  '0.0.0.0',
    port: 8125,
    mgmt_port: 8126,
    forkCount: 4,
    checkInterval: 1000,
    cacheSize: 10000
    }
Once the config file is set up, simply run it as follows:
node proxy.js proxyConfig.js
Proxy.js is available at the root of the StatsD installation directory.
Some of the configuration keys deserve an explanation:
- CheckInterval: determines the health check interval. If a node is offline, the cluster proxy will take it out of the configuration.
- Server: The server binary is loaded from the node's configuration specified in the “nodes” configuration.
Conclusion
StatsD and Graphite make an excellent choice for monitoring your infrastructure. All of the code mentioned above and the configuration is available in the github repository.
Some of the key advantages are:
- Low memory footprint: StatsD is a very simple node. js-based server resulting in a very low memory footprint, which means that it is very easy to kickstart this setup in your infrastructure.
- Network efficiency: Since StatsD can work over UDP, which is a connection-less protocol, a large amount of data can be transferred in a very short amount of time.
If you're interested in trying it out for yourself, sign up for our Hosted Graphite free trial. You can also sign up for a demo and we can talk about the best monitoring solutions for you.
This post was written by our guest blogger Madhur Ahuja. Follow him on twitter for more great ideas and information about monitoring!


