
Table of Contents
Introduction
An infrastructure, especially if it is scalable, can become extremely complex to visualize and observe. If something goes wrong, it would be difficult to fully understand the problem without a great data monitoring strategy. Information related to CPU, RAM, and statistics about SSH or HTTP servers are critical to understanding the performance of your web-application. Monitoring your application’s KPI and key behavioral metrics is also critical, beyond just monitoring the essentials of CPU, RAM and other infrastructure metrics.
We will look at monitoring the essentials in this tutorial, and in our next article, we’ll look at more creative ways to use StatsD and collectd to monitor application behavior.
This article will illustrate the amazing potential of monitoring your infrastructure using Graphite and Grafana ― two solid open-source products that will help you collect, manage, and display information in a user-friendly way.
Key Takeaways
-
Installing and configuring open source Graphite and Grafana can be time-consuming, taking 1-2 weeks for large infrastructure.
-
When running your own monitoring, you are responsible for everything, from strategy to emergencies.
-
It's easy to make security mistakes that can leave holes vulnerable to attackers in self-hosted monitoring systems.
-
Maintaining a self-hosted monitoring system requires a lot of time, taking days out of every month, not including updates and emergencies.
Self-hosted Monitoring Infrastructure Summary
As powerful as Graphite and Grafana are, many auxiliary challenges often go overlooked until you’re two months deep into the project. Security, upgrades, and backups can be complex to configure using just open-source projects. Along with this, the cost of running your own infrastructure monitoring within a company can be budgetarily burdensome or, even worse, financially untenable.
To handle these challenges, we often look to MetricFire as a hosted Graphite and Grafana service. MetricFire allows your company to focus on your data, and frees you from setting up the monitoring system ― MetricFire manages your Graphite instance quickly and easily, without making mistakes that could waste time and money.
Getting an infrastructure ready for monitoring has never been easier with the MetricFire free trial, which gives you access to Graphite and Grafana working in tandem. Just book a demo and we’ll sign you up. The installation process is seamless. All it takes is one click via a convenient web interface.
Like any thoughtfully built monitoring infrastructure, we need a time-series database that allows for proper time-based data management. The out-of-the-box installation of Graphite will include a time-series database (Called Whisper), so we will install Graphite on our system's central node.
Once we have our time-series database, we need to configure collectors that will write data to the database. Graphite is compatible with many data collectors, which are special daemons that use system calls to retrieve all data and values such as the number of processes, users connected, RAM, CPU, and much more. From CollectD to Prometheus, any data collector is fine for this tutorial. One of the strengths of Graphite is that it is compatible with many kinds of collectors.
Finally, to graphically display the data of our infrastructure, we will use Grafana, which allows for the creation of a dashboard that is sharable, secure, and easily understandable. We can also set alarms directly in Grafana, which is the recommended method. Graphite has an alarm UI, though it isn’t as easy to use. The possibility to set specific alarms and the simplicity of the configuration make Grafana a great choice for monitoring.
Graphite
Graphite is an open-source tool developed in Python by Orbitz Worldwide, Inc. that allows you to collect, store, and display different metrics. Since 2008, several companies including GitHub, Booking, and Reddit have been using Graphite to monitor their infrastructure.
Graphite is composed of three different parts:
- Carbon ― the daemon that is the core of our monitoring infrastructure. It manages the incoming data from the various data collectors and makes them available to Grafana, saving them via Whisper;
- Whisper ― a component that allows the permanent saving (on disk) of the data collected by Carbon, using the Whisper file format; and
- Graphite Web App ― a web application developed to display data. Since we will use Grafana in this tutorial, we will not install the web app; although, it is worth mentioning.
Carbon is a daemon developed with the Twisted engine that listens to time-series data. Using this framework allows you to manage multiple connections simultaneously without consuming too many resources. Moreover, Carbon uses Whisper, the second component of Graphite, to permanently store data on disk. Always referring to data retention policies, Carbon quickly makes available the latest data using a cache in RAM. Depending on the need, it can collect data through both TCP and UDP.
Whisper is a time-series database that provides real-time numerical data. Each piece of data, in fact, is associated with a different EPOCH time Unix (1970-01-01T00:00) that allows for easy analysis by external applications (such as Grafana). It uses a particular file design that does not permit efficient scalable solutions since each file needs to be "prepared" before shipping. On the contrary, MetricFire uses cluster-based which allows us not to worry about the preparation of Whisper files. Read more about the differences between vanilla Graphite and Hosted Graphite here.
Although the composition of Graphite seems minimal, there is a big disadvantage in its use: the data collection is obtained in PASSIVE mode. This means that the data collector must be configured to send the information to Graphite - Graphite doesn’t go and get information by itself.
Installation
To install Graphite, you must have the latest version of Python 2.x and PIP (at the time of writing, Python 2.7 and PIP 20.2.2 are the latest versions), including Django. On some distributions like Debian you also need to install some additional packages.
Since the tutorial is based on a Debian distribution, we start by installing the additional packages:
root@node ~ apt update && apt upgrade
root@node ~ apt install python-dev libcairo2-dev libffi-dev build-essential
We then proceed to install the Graphite set (including Carbon and Whisper) from pips:
root@node ~ pip install https://github.com/graphite-project/carbon/tarball/master --install-option="--prefix=/srv/graphite" --install-option="--install-lib=/srv/graphite/lib"
Alternatively:
pip install whisper
pip install carbon
Graphite Carbon is also available on Debian APT. In case of errors, it is likely that your system will miss some dependencies. To fix them, just call apt install with the package name.
Configuration
Keeping track of large amounts of data on your infrastructure requires significant space in terms of resources. This is why configuring a limit to how long you retain the data is convenient because it allows you to rotate information without taking up more space than you already have. Getting help with maintaining long-term storage for time series is one of the reasons Hosted Graphite by MetricFire is a useful service. If that’s your use case, check it out our Graphite interface.
To configure the Graphite set, we need to find the configuration files from where you installed Graphite:
root@node sudo cp /path/installation/carbon/graphite.wsgi.example /etc/carbon/graphite.wsgi
root@node sudo cp /path/installation/carbon/carbon.conf.example /etc/carbon/carbon.conf
root@node sudo cp /path/installation/carbon/storage-aggregation.conf.example /etc/carbon/storage-aggregation.conf
Let’s enable log rotation and cache by modifying the configuration file of Carbon /etc/carbon/carbon.conf:
root@node nano /etc/carbon/carbon.conf

ENABLE_LOGROTATION = true
CARBON_CACHE_ENABLED = true
We start carbon via shell (listening port 2003):
root@node ~ /opt/graphite/bin/carbon-cache.py start
Grafana
Visualizing the information managed by Graphite is essential to making sure we humans can interact with the data, as well as react to it and communicate about it. With pie charts, histograms, etc. Grafana allows you to view your infrastructure, systems, networks and more through a user-friendly dashboard that is available online and made accessible across all devices. With MetricFire, your Grafana dashboard is available right in-app, and will automatically publish your Graphite data without any extra steps!
Grafana is open-source software, developed in Go, which creates dashboards that integrate data from different sources. In addition, Grafana integrates with a lot of kinds of applications, such as Slack for notifications and business messaging, or Jira for ticketing. Grafana configures convenient alarms to keep you aware of critical events 24 hours a day. Whether it is Prometheus, Graphite, or InfluxDB, there is no database that Grafana does not support. Its flexibility and wide range of integrations are the key strengths of this software.
Among these features of Grafana, we find the additional possibility of adding annotations for certain data ranges or points ― this is extremely useful, especially because you can get your annotations to publish automatically when an event takes place in CircleCi or GitHub, making it easy to understand what events affected the trends in your graphs. For example, imagine a situation where we have changed our configuration in a capillary way after a certain date and noticed a sudden change in our data. Thanks to that annotation, anyone can associate that change with the change in the configuration of our infrastructure.
In addition, ad-hoc alarms allow you to warn, via corporate messaging apps (Slack, Telegram, etc.), of downtime and out-of-standard data. The integration is simple and, for further information, I recommend reading Slack as a Notification Channel for Alerts.
Installation
In order to install Grafana as a package and receive future updates, we first import the GPG key from the repository containing Grafana:
root@node ~ curl https://packages.grafana.com/gpg.key | sudo apt-key add -
root@node ~ sudo apt install -y software-properties-common
root@node ~ sudo add-apt-repository "deb https://packages.grafana.com/oss/deb stable main"
We then use apt to update the repository cache and install Grafana:
root@node ~ sudo apt update
root@node ~ sudo apt install -y grafana
We start Grafana through systemctl:
root@node ~ systemctl start grafana-server
Configuration
We access Grafana through the convenient web interface available on IP.OF.MY.VPS:3000 with username and password “admin”.
First, add the database of interest by going to “Configuration > Data sources”. Click on “Add data source” and choose the type of database, in this case, Graphite.

Fill in the form’s fields including the URL of the database (in this case http://localhost:8080), the possible authentication, and finish with “Save & test”. If the configuration is correct, we are ready to use the database for our dashboard!
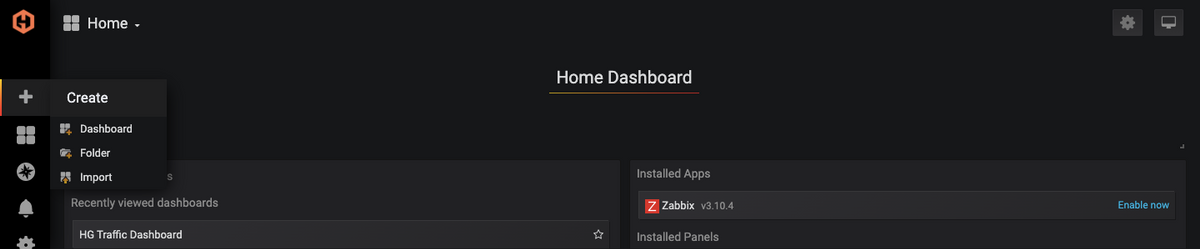
To create the dashboard, press the “+” and then “Dashboard”. At this point, click on “Add Query”. We will find an empty graph where we can add our data.
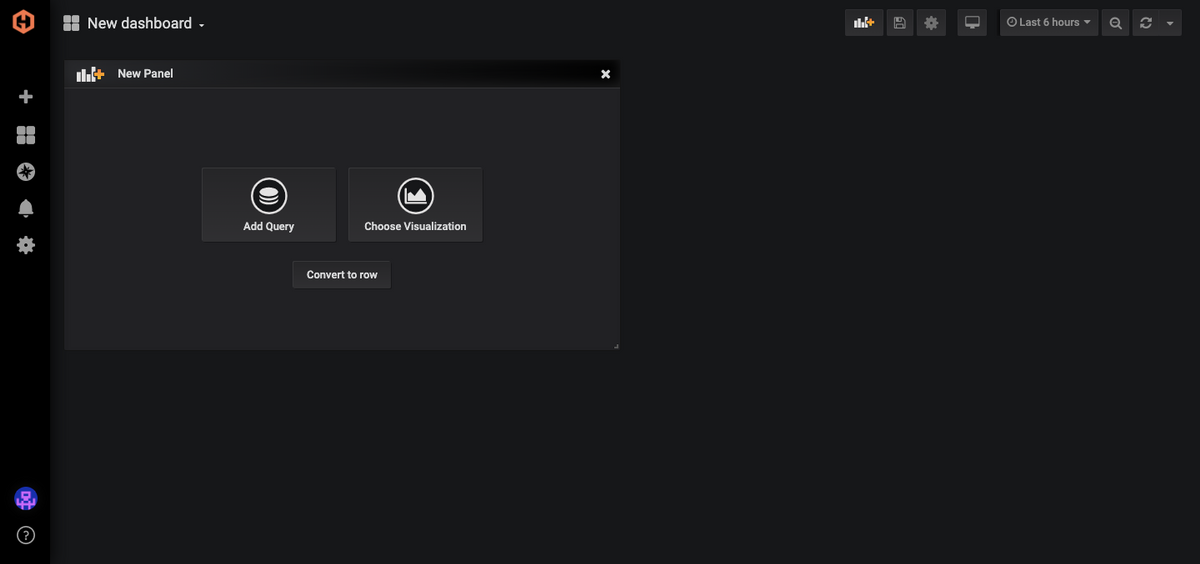
From the “Query” section we add our metrics. Grafana will propose, from a menu, the metrics available through an “Easy to Use Editor”.

Once this is done, hit “Save” and then we can repeat the following procedure for all the metrics we would like to monitor. Using Grafana is really that easy.
Self-hosted Monitoring Drawbacks
While the self-hosted infrastructure has many advantages such as full customization, all secondary aspects such as maintenance, security, and backup tend to hide some difficulties that, at first glance, are not obvious ― the level to which you experience these kinds of problems will depend on your use-case. If you have a limited use case, you’re probably going to be just fine running Graphite on your own. If your use case starts to scale, or if you have any specific criteria related to security or backups in your company, it will get increasingly challenging to maintain your monitoring system. Most people find that a self-hosted monitoring infrastructure requires continuous maintenance to be safe, fast, and efficient.
Just to install and configure the stack described in this guide, it took me between 6 and 7 hours to install the “core” and about 15 minutes for each added node to be monitored. This time estimate does not include the countless hours that can potentially be lost in situations where there are errors and dependencies to install. Between forums, Stackexchange, GitHub, etc., from experience, I can confirm that you could lose days before seeing the monitoring work. It can be quite a stressful experience.
In self-hosted infrastructure, you are on your own. No 24/7 support team can respond to you in case of problems, there will be no one to suggest the next step. Many aspects, mentioned above, will be handled exclusively by you. If you are inexperienced or do not understand specific commands, it will take a long time to find out what happens if things go wrong. If you do not, you will find yourself in trouble and will soon abandon the idea of creating your monitoring dashboard.
As well, beyond the challenge of setting it up and keeping it running lies the challenge of designing an effective monitoring strategy. MetricFire can consult you on what to monitor, and how to keep broad observability of your systems.
In addition to this, lack of experience could cause you to make catastrophic mistakes for your company. A misconfiguration of database configuration files such as Graphite could leave doors open for attackers. Older, outdated versions could pose a threat to the nodes you want to monitor, allowing for much-simplified access to your company’s infrastructure.
Costs and resources could increase. Months and months of monitoring can potentially take up significant space. Depending on what you monitor, log file sizes range from 50MB per month to up to 2GB per node. If you have “Pay-As-You-Use” enabled, with providers like AWS, Azure, and many others, in less than 6 months you might get an astronomical fee to pay. The costs of a self-hosted infrastructure are not predictable and sometimes these solutions exceed your budget. The cause? Backups and data retention policies are extremely complex to configure and may not always be efficient for your business. Not to mention the cost of your own time.
MetricFire has gone deep on an analysis of when it is better to monitor using your self-hosted monitoring infrastructure, and when it’s better to outsource to a service like MetricFire. To read more, check out the study!
You Have Another Option – MetricFire
If you have had a headache after reading words like “security risks”, “weeks of maintenance”, and “expensive to scale”, don’t worry. Another option to monitor nodes quickly and easily is to use MetricFire, which combines the 2 open-source products mentioned in the article into an easy-to-use, risk-free web app. MetricFire allows you to manage Grafana, Graphite, and many other applications (e.g. Prometheus, Elasticsearch) through a convenient web interface. No longer do you need to worry about reinventing the wheel. MetricFire provides the best open-source monitoring tools as a hosted service ― so you can focus on applying these tools to your business, whether that be for server monitoring or business intelligence. Book a demo with MetricFire and get started with the free trial!
Not only does MetricFire provide the hosted open source project, but MetricFire has also amplified these projects with some better features. For each plan, data retention is set for two years, and Graphite is also configured to use native clusters (which allows you to store much more information) without being redundant. I recommend that you read this document to find out more.
A support team with qualified, technical engineers is available to answer all your questions, no matter if you are CEO or a technician. Maintenance and safety will no longer be a problem and you can sleep soundly with MetricFire watching over your metrics. The experienced team is constantly working to update and improve the MetricFire dashboards, so you can focus squarely on data.
In summary, creating a monitoring infrastructure takes time, money, and a lot of patience. As we know, it is not always easy to configure Graphite and Grafana. On top of this, unexpected errors and continuous crashes could create endless headaches. If you have time constraints, want to work efficiently and effectively, and need a good stack of products, use MetricFire.
Book a demo with the MetricFire team, and talk to us about your monitoring needs! We’ll set you up with a free trial!

