Table of Contents

Introduction
You have your Prometheus instance(s) scraping your scraping targets for every scrape_interval time period, and that is all fine and dandy. But, what if some of your applications do not live long enough to be discovered and scraped by Prometheus? For example, if you are using Kubernetes service discovery, and your pods do not live enough to be picked up? Then the typical pull model of Prometheus does not fit anymore because Prometheus cannot find or scrape all of the targets. Some kind of solution is needed.
This is where Prometheus Pushgateways comes in. You can send metrics data to the Pushgateway from your short-lived scripts, then the metrics will be eventually ingested by Prometheus. This article on MetricFire’s blog will tell you everything that you need to know so that you can quickly start using Pushgateways. Everything below has been tested for version 1.2.0 of Prometheus Pushgateway.
If Prometheus is not the right fit for you, no need to fret! Check out our website and see what MetricFire can do for you.
You can sign on to our free trial, and get all of the benefits of Graphite and Grafana with none of the hassle of installation. Also, talk to us directly by booking a demo - we’re always happy to talk with you about your company’s monitoring needs.
Key Takeaways
- Prometheus Pushgateway is a solution for scenarios where some of your applications do not live long enough to be discovered and scraped by Prometheus, making traditional scraping challenging.
- You can run Prometheus Pushgateway as a self-contained binary on various operating systems or use Docker containers for quick setup.
- The default configuration options for Prometheus Pushgateway should work well for most use cases, but you can customize them to fit your needs.
- To send metrics to Pushgateway from batch jobs, you can use web requests or client libraries in languages like Powershell or Bash.
- Pushgateway labels, such as job and instance, are used for grouping metrics and can be added via the URL to make metrics discoverable by Prometheus.
Basic Usage
Running a Pushgateway
The first and most important question is - what do I actually need to run a Prometheus Pushgateway? The software is written in Go, so it is distributed as a self-contained binary that you can run on any of Go’s supported operating systems and architecture. If it is most convenient for you, then you can go to the GitHub page for Prometheus Pushgateway releases, and download those binaries there.
It's worth noting, though, that Prometheus isn't your only option. If you're looking for a change or your organization is just starting out, Graphite should also be on your radar. While Graphite was built in Python rather than Go, its interoperability with other systems is unequaled.
If you want to at least get a handle on running a Prometheus Pushgateway before making any decisions, though, here is a handy bash script to download, extract, and run the specified version:
#!/bin/bash
VERSION="1.2.0"
wget "https://github.com/prometheus/pushgateway/releases/download/v${VERSION}/pushgateway-${VERSION}.linux-amd64.tar.gz"
tar xvzf "pushgateway-${VERSION}.linux-amd64.tar.gz" "pushgateway-${VERSION}.linux-amd64/pushgateway"
rm -f "pushgateway-${VERSION}.linux-amd64.tar.gz"
mv "pushgateway-${VERSION}.linux-amd64/pushgateway" ./
rmdir "pushgateway-${VERSION}.linux-amd64"
Obviously, you ought to change the operating system and architecture in this snippet if it is different on your machine. This will give you a binary Pushgateway in your current working directory. You can use it to start your own Pushgateway.
If you would rather use a container then there are premade Docker images already waiting for you in the Docker hub. A simple:
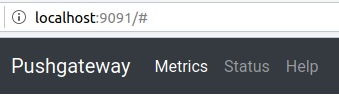
docker run -it -p 9091:9091 --rm prom/pushgateway
will give you a Pushgateway container that gets deleted automatically on shutdown on localhost:9091:
Finally, let’s talk about Kubernetes. Helm is the ubiquitous package manager for Kubernetes that we will use. It has a nice chart for Pushgateway that you can install with the following command:
helm install stable/prometheus-pushgateway
By default, the chart will create a Service that is also listening on port 9091. What’s more, the chart even integrates with the Prometheus Operator. What this integration means is that if you add serviceMonitor.enabled to that chart, then your Pushgateway will be automatically scraped by Prometheus. This is a huge topic in itself, and it is more related to Kubernetes than Pushgateways, so we will skip it in this article. Feel free to explore the links above to learn more about it.
The default options given by Pushgateway should work well in most cases. Here they are with the explanation of each of them:
- --web.listen-address=:9091, IP (optional) and port pair on which to listen for requests;
- --web.telemetry-path=/metrics, Path under which the metrics (both user-sent and internal ones) of the Pushgateway will be exposed;
- --web.external-url=, URL on which this Pushgateway is externally available. Useful if you expose it via some domain name;
- --web.route-prefix=, if specified then uses this as a prefix for all of the routes. Defaults to --web.external-url’s prefix;
- --web.enable-lifecycle, if specified then lets you shut the Pushgateway via the API;
- --web.enable-admin-api, if specified then enables the Admin API. It lets you perform certain destructive actions. More on that in the following sections;
- --persistence.file=, if specified then Pushgateway writes its state to this file every --persistence.interval time period;
- --persistence.interval=5m, how often the state should be written to the previously specified file;
- --push.disable-consistency-check, if specified then the metrics are not checked for correctness at ingestion time. Should not be specified in the absolute majority of cases;
- --log.level=info, one of debug, info, warn, error. Only prints messages with levels higher than that;
- --log.format=logfmt, possible values: logfmt, json. Specify json if you want structured logs that could be used with, for example, Elasticsearch.
Sending Metrics
Now we have a Pushgateway up and running. However, how do you send your own metrics to it from your ephemeral batch jobs? There are two ways:
- You can use a program that can do web requests, or
- You can use a client library.
The former is more applicable in cases where your batch job is written in a language such as Powershell or Bash.
With Powershell, you can use the canonical Invoke-WebRequest which sends a web request to the given URL and given data. To send metrics data to a Pushgateway on Windows Powershell you can use this snippet:
$metrics = "
# TYPE some_metric
gaugesome_metric 42
# TYPE awesomeness_total counter
# HELP awesomeness_total How awesome is this article.
awesomeness_total 99999999
"Invoke-WebRequest-Uri "http://localhost:9091/metrics/job/metricfire/instance/article" -Body $metrics -Method Post
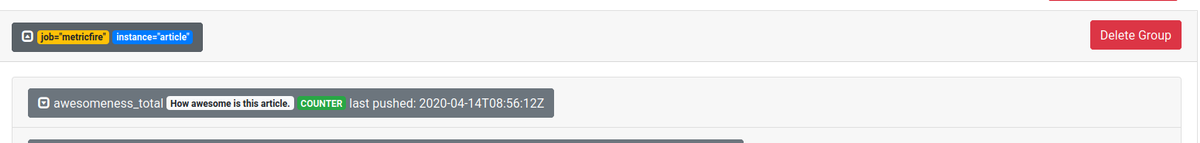
Running the above snippet will give you the following result in the user interface at localhost:9091:
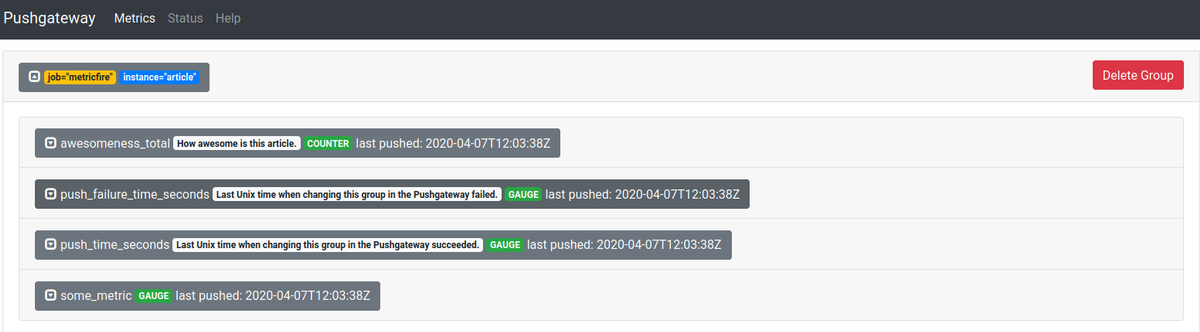
Consequently, the /metrics end-point now has the following data:
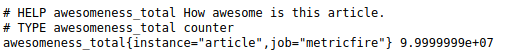

As you can see, there are two labels, job, and instance. If Prometheus can't find them, it will attach them by itself if the configuration value honor_labels is true. In the snippet above they have been added to the metrics data via the URL that we have used to make the request.
For Linux and other Unix(-like) operating systems, we can use the widespread cURL to do this request. The following snippet achieves the same result as the previous one:
cat <<EOF | curl --data-binary @- http://localhost:9091/metrics/job/metricfire/instance/article
# TYPE some_metric gauge
some_metric 42
# TYPE awesomeness_total counter
# HELP awesomeness_total How awesome is this article.
awesomeness_total
99999999
EOF
The labels specified in the URL are used for grouping metrics together. This enables them to be easily deleted later on because we can refer to small groups of metrics together.
In the case where your job or other labels contain a slash (/) character, then you will need to do extra work. You can find more information here.
The only label that is necessary to pass metrics via the URL is the job label. Also, note that any of the labels passed via the URL will overwrite whatever labels that the metrics passed via the body might have. If you have any doubts then you can always push some example metrics and check what is being exposed to Prometheus by checking the /metrics (or some other path, if you have it changed via --web.telemetry-path): http://localhost:9091/metrics.
If everything succeeds then you will get a response with 200 HTTP status code. If you have disabled the consistency check then you might get a 202 HTTP status code, which means that your metrics have been queued for inclusion into the next scrape and that they haven’t been checked yet. The actual scraping might fail if you’ve pushed some invalid metrics. For example, if you have pushed them with different types, even if you have written the name exactly the same.
Finally, a 400 HTTP status code means that you’ve pushed some invalid metrics and they have been rejected. In such a case, the HTTP response indicates what is wrong. For example, pushed metrics are invalid or inconsistent with existing metrics: pushed metrics are invalid or inconsistent with existing metrics: collected metric "some_metric" { label:<name:"instance" value:"article" > label:<name:"job" value:"metricfire" > label:<name:"label" value:"test" > gauge:<value:12345 > } was collected before with the same name and label values.
This means that the same metric has been defined twice in one request. It is invalid to redefine the metric’s value in the same request or scrape.
Scraping Metrics
The configuration that you might have is highly variable depending on the different service discovery mechanism(-s) that you have at your disposal. Explore the different configuration options available here. The simplest option is to statically define a Pushgateway target from which to scrape metrics:
scrape_configs:
- job_name: pushgateway
  honor_labels: false
  static_configs:
  - targets: ['localhost:9091']
    labels:
      pushgateway_instance: metricfire
This will make your Prometheus scrape a Pushgateway instance at localhost:9091 if you are running a Pushgateway locally. Another thing to consider is enabling the honor_labels parameter. Having it enabled means that Prometheus would opt to choose whatever comes from the Pushgateway instead of what Prometheus is trying to attach when it tries to add certain reserved labels or labels which have you specified in the scraping configuration. For example, if you had a metric in your Pushgateway awesomeness{pushgateway_instance=”notmetricfire”} then it would use the value notmetricfire for that label instead of metricfire as defined in the scraping configuration that you can see in the code snippet above. Without it, the original label will be renamed to exported_pushgateway_instance which would have the value notmetricfire.
Enabling honor_label is useful in cases where you want to preserve all of the labels that the Pushgateway exposes, such as the mandatory job label. It will be much clearer when you can use the same job label when querying the metrics that are in your Pushgateway.
Deleting Metrics
There are three ways to delete metrics:
- via clicking near the group of metrics in the UI,
- via the wipe end-point on the admin API if that has been enabled by --web.enable-admin-api,
- and by making an HTTP request with the verb DELETE.
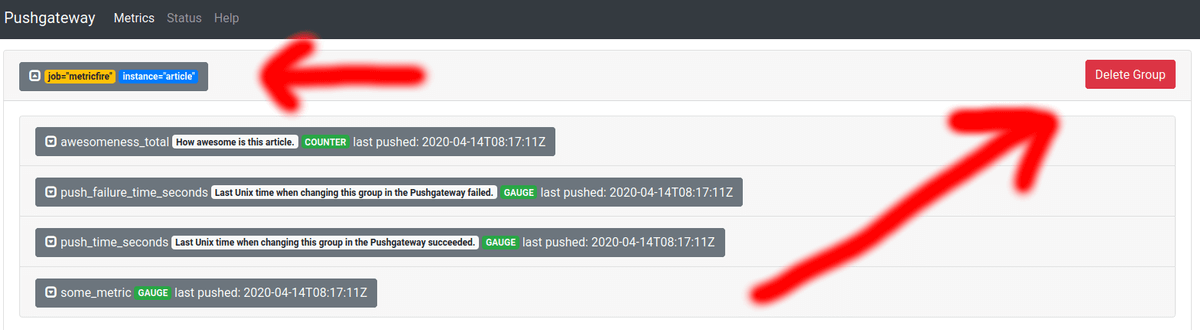
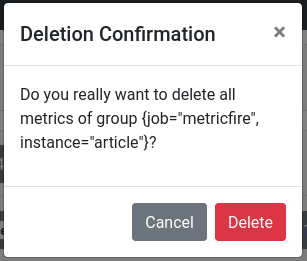
Deleting via the UI is simple. Go to http://localhost:9091 if you are running your Pushgateway locally. Then, find the group of metrics that you are interested in deleting, and expand them. Expanding metrics before deleting them is a great way to check clearly what something is, so you can be absolutely certain that you will not delete something that you need. Finally, click Delete Group, and then confirm your action by clicking Delete again. Here is how it looks on the interface:
And now the metrics have disappeared:
The admin API, on the other hand, only provides a way to wipe all of the metrics. Simply send a call to /api/v1/admin/wipe with the verb PUT. The -X parameter of cURL lets you change what verb it will use. This is how it looks with cURL:
curl -X PUT http://localhost:9091/api/v1/admin/wipe
If that succeeds then you will get a response with a 2xx HTTP status code.
Enabling it also makes a nice button appear in the UI which lets you do the same thing:
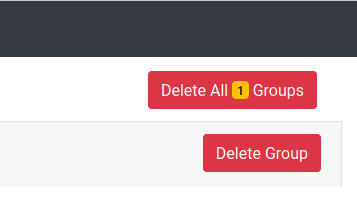
So, you are free to either call the API or push this button.
Finally, you can use the grouping labels that you have used before to delete the metrics. It is exactly identical to sending n metrics, but instead of the POST verb, you need to use DELETE. You can specify that via -X for cURL or -Method for Powershell. For example, if you have some metrics identified by job=”metricfire” and instance=”article” then you can delete them with cURL by sending a request:
curl -X DELETE http://localhost:9091/metrics/job/metricfire/instance/article
This deletes the following group:
Please note that only the most specific metric group gets deleted by this call. It means that if you had another metric group within the job label as metricfire group, with the instance label set to ebook, then the following call:
curl -X DELETE http://localhost:9091/metrics/job/metricfire
would not delete all of the metric groups which have the label job equal to metricfire. It would only delete a metric group that is identified by a sole label job that is equal to metricfire. In this example, it would not touch the above metrics group nor any of the other metric groups that have the label instance equal to article or ebook.
Alerting
With all of these things in place, it is a good idea to add some alerts on top so that you know when things go haywire. Pushgateway pre-generates some useful metrics that you can use for this. Typically, we want to know when:
- Someone has tried to push inconsistent metrics;
- The Pushgateway has not pushed metrics for a longer time than expected;
- The Pushgateway is down.
groups:
- name: PushgatewayAlerts
  rules:
  - alert: PushgatewayDown
    expr: up{job="pushgateway"} != 0
    for: 10m
    labels:
      severity: page
    annotations:
      summary: A Pushgateway is down
  - alert: PushesDelayed
    expr: time() - push_time_seconds{job="pushgateway"} > 300
    for: 5m
    labels:
      severity: critical
    annotations:
      summary: Pushgateway pushers are delayed
  - alert: InconsistentMetrics
    expr: rate(pushgateway_http_requests_total{code="400",handler="push",job="pushgateway"}[2m]) > 0
    for: 5m
    labels:
      severity: critical
    annotations:
      summary: Someone is continuously trying to push inconsistent metrics to the Pushgateway
Obviously, you should adjust the thresholds and other things according to your setup. Especially the second alert, since it assumes that all of your pushers are constantly pushing new metrics to your Pushgateway. If that is not the case then you will need to add extra metric selectors so that it would apply only for the cases where it makes sense.
Aggregation
Pushgateway has been intentionally designed not to aggregate metrics that it receives i.e. once it gets them, they are exposed to Prometheus forever. This may not fit all of the use cases. For example, we might have small batch jobs that process a number of job units. Then, we would like to have an ever-increasing counter that shows how many of them have been processed since the beginning of time.
So, with ordinary Pushgateways we would have to keep that value somewhere so that it would be known between restarts and multiple instances of the same job. This could potentially increase the complexity significantly since you would have to maintain extra infrastructure that would handle concurrent access to the same counter and so on. To solve this problem, some people have made an aggregating Pushgateway.
The aggregating Pushgateway aggregates different values that it receives over its lifetime. For example, counters with the same label names and values are added together. You can find the software here. The ways it is different from the ordinary Pushgateway is documented here. So, if you have this problem then you could use that instead as it is a drop-in replacement. This also means that all of the advice given here also applies to it.
High Availability
Unfortunately, Pushgateway does not provide any strong consistency guarantees. As mentioned earlier, the best that it can do is to save metrics to disk for every specified time period. These are controlled by the parameters --persistence.file= and --persistence.interval= respectively.
This means that the best you can do is to have some kind of mounted storage that is writable by one node (which serves the traffic), and then others would have the persistent storage mounted as read-only. In the Kubernetes world, you can achieve this with a persistent volume claim with the mode ReadWriteOnce. You can explore all of the different options available here.
The Pushgateway helm chart already has support for this via persistentVolume.enabled: true. You can specify that parameter like this:
helm install --name metricfire-pushgateway --set

persistentVolume.enabled=true stable/prometheus-pushgateway
Explore all of the other available options here.
Conclusion
Now we have seen everything we need to know about Pushgateway to get them up and running. We have seen how to send metrics, scrape metrics, delete metrics, and alert on metrics. For more information on high availability monitoring with Prometheus, check out our article on integrating with Thanos. As well, check out the MetricFire blog for more information relating to monitoring with Prometheus.
Of course, it's important to not overlook your other options. Hosted Graphite holds many advantages over Prometheus in the areas of scraping data, sending metrics, and more. And when it comes to interoperability with other platforms, Graphite easily stands out. Even better, the MetricFire free trial is a great way to explore your options.
Sign up for the MetricFire trial and start monitoring your Pushgateways in minutes. If you’re interested in scaling your monitoring service with MetricFire’s Hosted Graphite, book a demo and talk to our team directly.

