Table of Contents
Introduction
Engineers are increasingly embracing open-source server monitoring tools for their flexibility and cost-effectiveness. These tools offer functionality without the need for additional investments. In this article, we'll explore the top open-source server monitoring tools: Graphite, Grafana, ELK Stack, and Nagios. These actively maintained tools have thriving communities. Let's delve into their features and benefits.
Key Takeaways
- Open-source server monitoring tools provide engineers with freedom and customization options while saving costs.
- Graphite, Grafana, ELK Stack, and Nagios are popular open-source monitoring tools with active communities.
- Users often combine open-source monitoring tools with proprietary or other open-source solutions to enhance their monitoring capabilities.
- Each tool has its strengths and weaknesses, such as Graphite's long-standing reputation, Grafana's powerful visualization, ELK Stack's log monitoring capabilities, and Nagios' versatility.
Overview of Server Monitoring Tools
There are hundreds of server monitoring tools out there, all with slightly different levels of customer support and functionalities. In today’s development environment, many engineers are opting for open-source monitoring to get more freedom and customization. Open-source server monitoring tools allow us to gain functionality without spending more.
If you do it right, using open-source server monitoring can save you money. Of course, using open source can become expensive due to higher head-count costs, usually caused by the time and expertise needed to make the open-source software run. However, you can save a lot when using open source for specific and focused tasks.
Users often apply open-source monitoring tools in conjunction with other open-source tools, or with proprietary tools. For example, it’s very common for AWS CloudWatch users to pull Grafana into their stack for better dashboarding, despite already having a wide range of tools at their disposal. Similarly, it’s common to use Elasticsearch simultaneously, one for time series and the other for logs.
Let’s take a look at the best open-source monitoring tools available today. These tools are all currently being maintained, and have huge communities of contributors and users.
Graphite
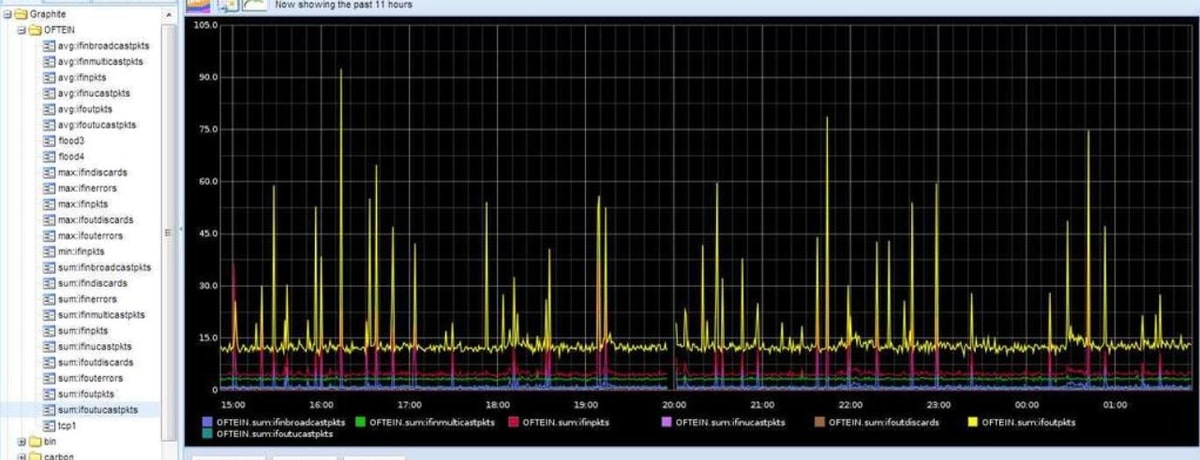
Graphite is a tried and true time-series monitoring tool that was first released in 2008. It has over 5,000 stargazers on GitHub and 300 contributors. This tool was one of the first open-source server monitoring tools, and it has been a strong player on the field ever since.
Graphite is built on a set of subcomponents that work together as one monitoring stack. There is Carbon, Whisper, Graphite server, and Graphite Web UI. Each piece plays a specific role and is interchangeable with other technology if the developer prefers something else.
Graphite requires clients to push metrics to it, while it listens and receives metrics. This usually requires the use of a daemon, such as StatsD or collectd. For more information on Graphite architecture, read up on Graphite Architecture and Concepts.
Recently there has been a push to make Graphite more compatible with Docker and Kubernetes. You can check the adaptations on the GitHub project, such as the official docker image and test scripts. However, Graphite has a few persisting issues, such as data aggregation, cluster-native storage, and a lack of good alerting.
Hosted Graphite by MetricFire improves upon Graphite, and offers a solution to the biggest issues with Graphite. If you’re interested in Graphite, definitely check out Hosted Graphite as a way to get around some of the issues with Graphite, and to make it easier to scale.
Prometheus
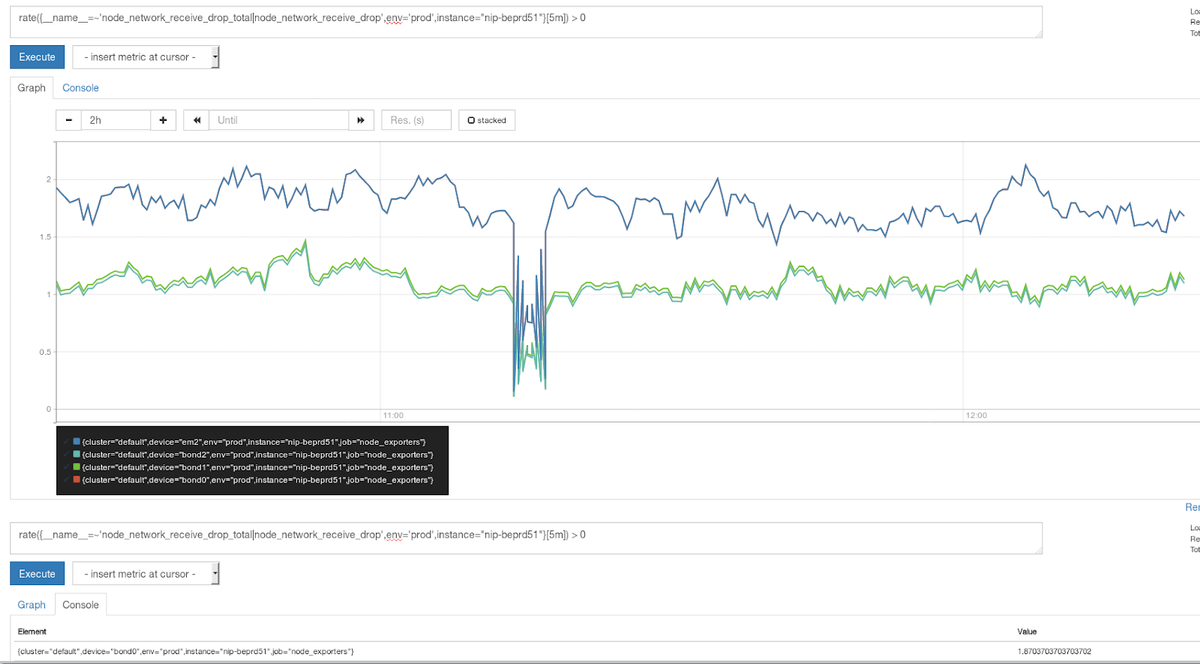
Prometheus is a newer product, developed by Soundcloud in 2012. Prometheus is a one-stop shop for time-series monitoring. With one installation you get data collectors, the Prometheus server, data aggregation with a complex labeling system, visualization, querying, indexing, alerts, and notifications.
Prometheus is built to monitor Kubernetes and Docker, and is almost always used alongside Grafana for visualizations. Prometheus has its own dashboard, called the Prometheus Expression Browser, which is a good console for deep diving into your metrics. You can query with Prometheus’s own query language called PromQL, which is a powerful tool when combined with Prometheus’s multi-dimensional data structure. However, Grafana is a better dashboard tool, which supersedes the Expression Browser for long-term data monitoring, alerting, and notification.
Prometheus has a few downsides. The first problem is long-term storage, where the open-source project is only configured to store data for a maximum of 14 days. To get long-term storage on the order of months and years, you’ll need to set up remote storage. This can be time-consuming and expensive. The second problem occurs when monitoring multi-process applications as seen in many Python web apps. Prometheus is not built for multi-process multi-threaded applications, but workarounds are possible.
Grafana
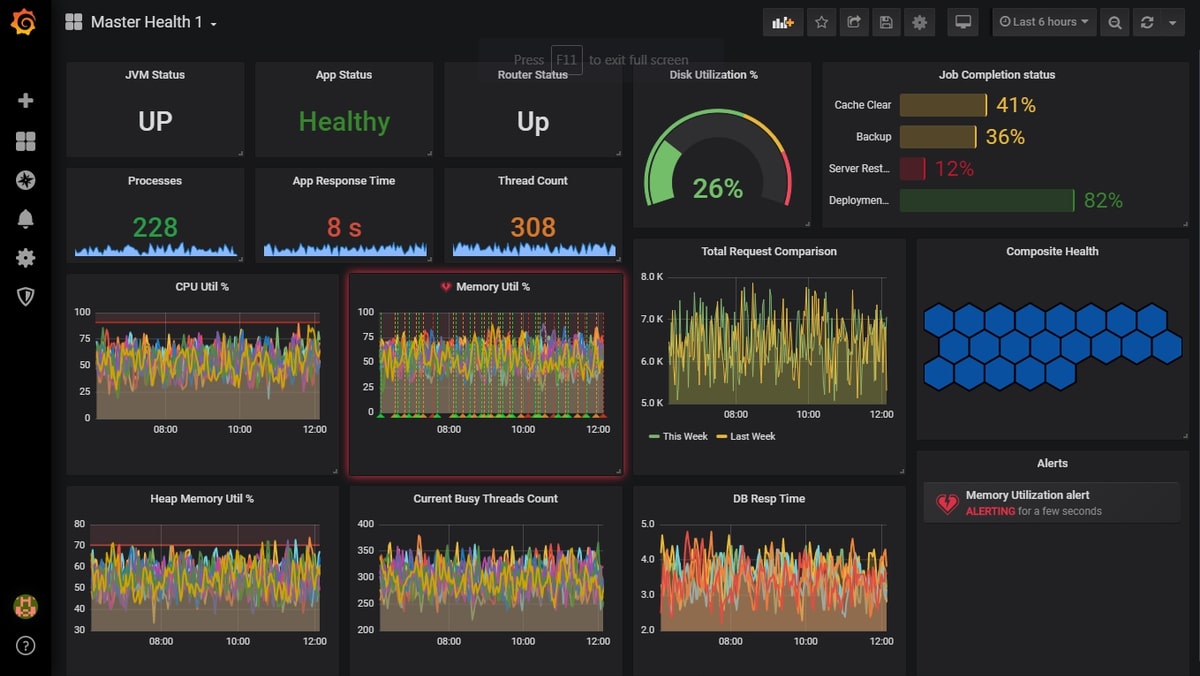
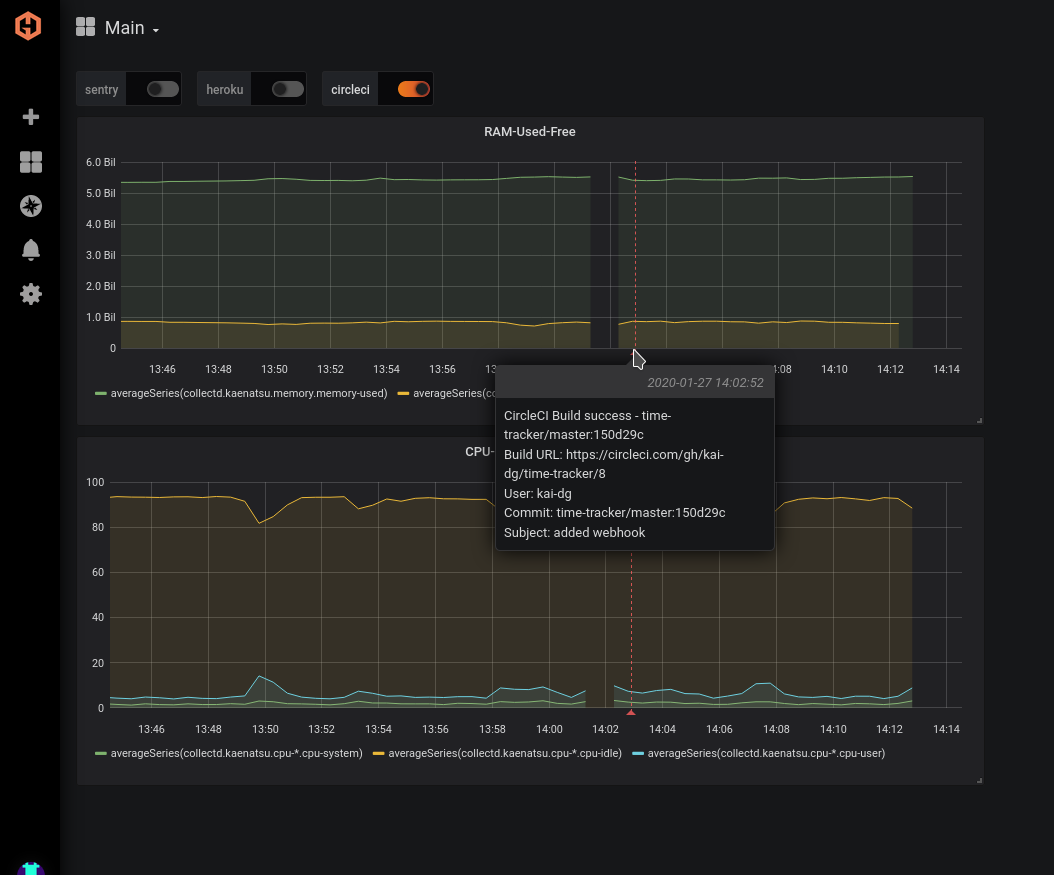
Although Grafana is only a dashboard tool and not a full server monitoring tool, it is pivotal in any monitoring stack. Grafana can do what time-series databases can’t. Grafana can build great graphs, alert on complex alert rules, and push the alerting information directly to your smartphone with notifications.
Grafana is easy to use and easy to set up. For more information on how to set up Grafana, check out our article on Getting Started With Grafana. You can also see our article Our Favorite Grafana Dashboards, which shows exactly what we watch when doing server monitoring.
Grafana allows you to build dashboards out of panels, where each panel consists of one type of visualization. You can choose from panels such as Single Stat, Histogram, Guage, Bar Guage, Polystat, Table, Alert List, and more. Each panel can be configured to watch specific metrics coming from any data source in your monitoring stack. Data sources can be anything from Elasticsearch to AWS.
ELK stack
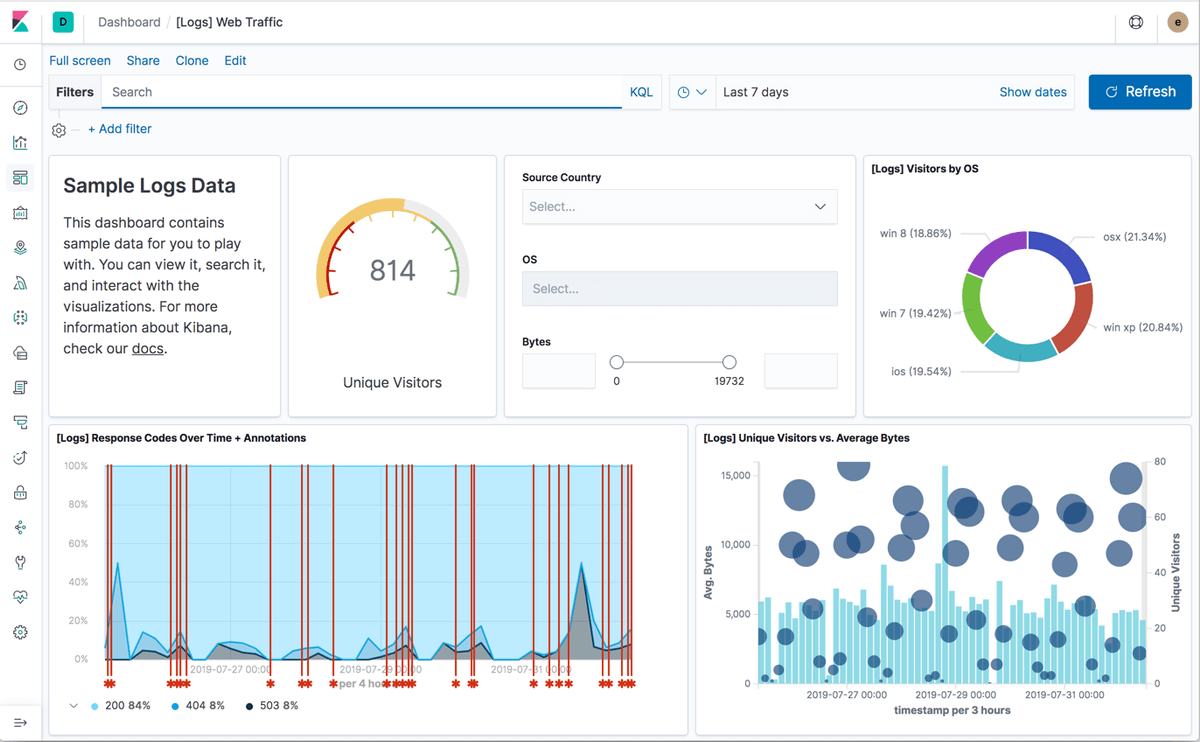
The ELK stack, made up of Elasticsearch, Logstash, and Kibana, is a great tool for monitoring machine logs. However, the ELK stack is not as strong as Prometheus and Graphite when it comes to time series.
Kibana has some similarities with Grafana, but it plays a more specific role. Kibana is the console and UI for Elasticsearch and Logstash, and it can not exist without using those two technologies as their data source. Grafana is more independent and can be used to monitor a broader range of technology. Kibana is much more effective at monitoring logs, whereas Grafana focuses mostly on time series. With the release of Loki, in Grafana 7.0, Grafana improved its ability to monitor logs. For more information comparing Grafana and Kibana, see our article Grafana vs Kibana. Also, take a look at our comparison of Prometheus and ELK.
Nagios
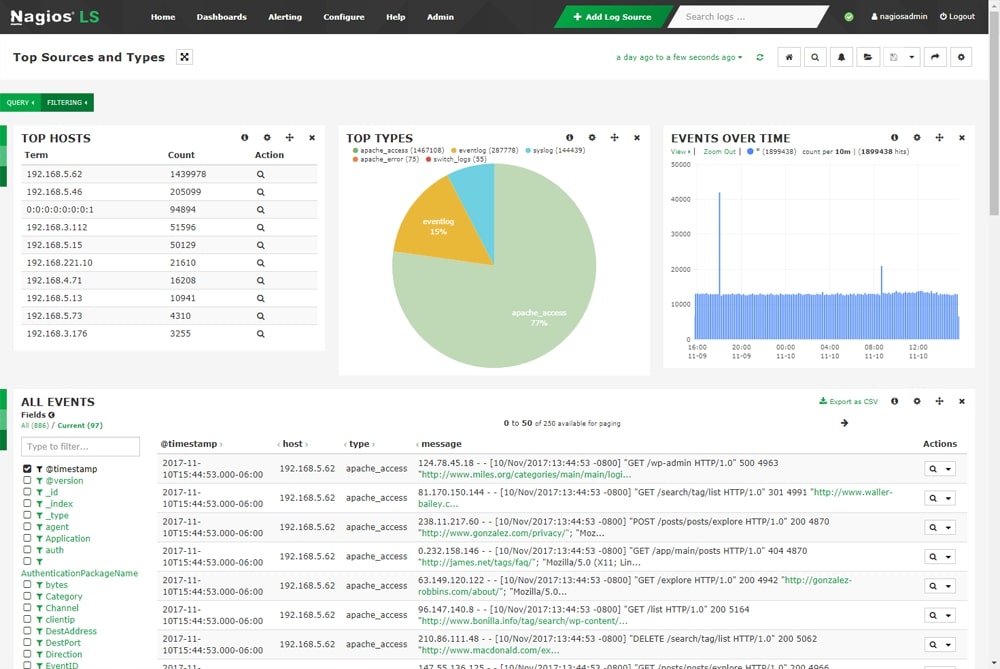
Nagios was initially released in 2002 as open-source software and has developed into a multi-product enterprise offering. While the open source software still exists, it has a relatively small community when compared to Graphite or Grafana.
The open-source software is written in C and is published under the GNU General Public License. The software provides monitoring of network services (via SMTP, POP3, HTTP, PING, etc) and host resources (processor load, disk usage, etc.). The software is also versatile in that it has a plugin interface that allows developers to add custom tools.
For more information on Nagios, head to the GitHub page and their enterprise offering home page.
MetricFire
MetricFire is an enterprise-ready platform that offers infrastructure, system, and application monitoring using a suite of open-source monitoring tools. The platform allows you to use either Graphite-as-a-Service and have your metrics displayed on aesthetically pleasing Grafana dashboards.
Using MetricFire, you can understand complex systems at a glance because of its powerful monitoring capabilities. MetricFire gives you all of the benefits of open source, while still providing the customer service of an enterprise monitoring product.
Get started with MetricFire by signing up for the Free Trial. You can pipe metrics directly into our cloud platform by installing a simple agent. Once your metrics data is in the platform you can start to play around with the Grafana dashboards. MetricFire comes with hundreds of default dashboards already set up for various purposes, such as server monitoring, Kubernetes monitoring, and more. You can even check out some cool applications of MetricFire, such as monitoring Raspberry Pi 4.
On the MetricFire reviews page, you can see that many of our customers are using MetricFire for server monitoring. Some of the most relevant cases are one customer’s success story of moving off of SolarWinds, and then also Coveo’s story of working with Hosted Graphite.
Sign up for the MetricFire free trial today, and start monitoring your metrics using open-source technology in a hosted platform. Also, book a demo with the MetricFire team and talk to us directly about your monitoring needs.

