Table of Contents
Introduction
Grafana
Grafana is a very versatile visualization tool. It is able to read data from a variety of data sources and plot with many different visualization options such as graphs, gauges, world maps, heatmaps, and more. Check out our articles on Grafana dashboards, and our comparison of Grafana and Kibana.
MetricFire offers a Hosted Grafana solution, so you can try it for yourself on the MetricFire free trial! You can also book a demo and talk to us directly about what MetricFire can do for you.
Elasticsearch
Elasticsearch is an open-source, distributed data store for analyzing and searching data. Elasticsearch uses JSON based document structure to store and index data. It uses a data structure called Inverted Index to enable a very fast search on the stored data. Many firms use Elasticsearch to power their search across their databases.
MetricFire is a hosted Grafana service where our engineers can set up any Grafana plugins for our customers upon request, with this service included in all packages. Check out how to do it below, and if you're looking to offload that work, sign up for our free trial.
Additionally, be sure to check out our Hosted Graphite services. Our Hosted Graphite services offer three times the redundant storage (above the default Graphite storage), control by APIs for automated resources, and tagged metrics for easy viewing and analysis.
Elasticsearch support in Grafana
Elasticsearch support in Grafana is very exciting because one of the major use cases of Elasticsearch is storing event data and metrics. Hence, it's natural for a tool like Grafana to be used to visualize this data. In this article, we will walk through the step-by-step process of integrating Grafana with an Elasticsearch instance and then perform some queries.
Setup
We will use docker to set up a test environment for Grafana and Elasticsearch. We will use the official docker images available at:
https://hub.docker.com/r/grafana/grafana/
https://hub.docker.com/_/elasticsearch
While Grafana is a great tool for visualization, we will need some extra tools to visualize data sitting in Elasticsearch with Grafana. Elasticsearch doesn’t come with any tools to see data in a browser out of the box. It uses REST based interfaces to interact with the data. So the first step is to get a web UI for Elasticsearch.
Try MetricFire now!
Interested to see how MetricFire can help you with the process and help you get new organizational insight? Now's the time! Try a free trial or book a demo.
To get a web interface with Elasticsearch, we will use an open-source Elasticsearch UI called Dejavu. Its docker image is available here:
https://hub.docker.com/r/appbaseio/dejavu/
Here is a very simple docker-compose file that starts Grafana, Elasticsearch, and Dejavu.
version: '3'
Services:

  grafana:
    image: grafana/grafana
    ports:
      - 3000:3000

  elasticsearch:
    image: docker.elastic.co/elasticsearch/elasticsearch-oss:7.0.1
    container_name: elasticsearch
    environment:
      - discovery.type=single-node
      - http.port=9200
      - http.cors.enabled=true
      - http.cors.allow-origin=http://localhost:1358,http://127.0.0.1:1358
      - http.cors.allow-headers=X-Requested-With,X-Auth-Token,Content-Type,Content-Length,Authorization
      - http.cors.allow-credentials=true
      - bootstrap.memory_lock=true
      - 'ES_JAVA_OPTS=-Xms512m -Xmx512m'
    ports:
      - '9200:9200'
      - '9300:9300'
    # elasticsearch browser
  dejavu:
    image: appbaseio/dejavu:3.2.3
    container_name: dejavu
    ports:
      - '1358:1358'
    links:
      - elasticsearch
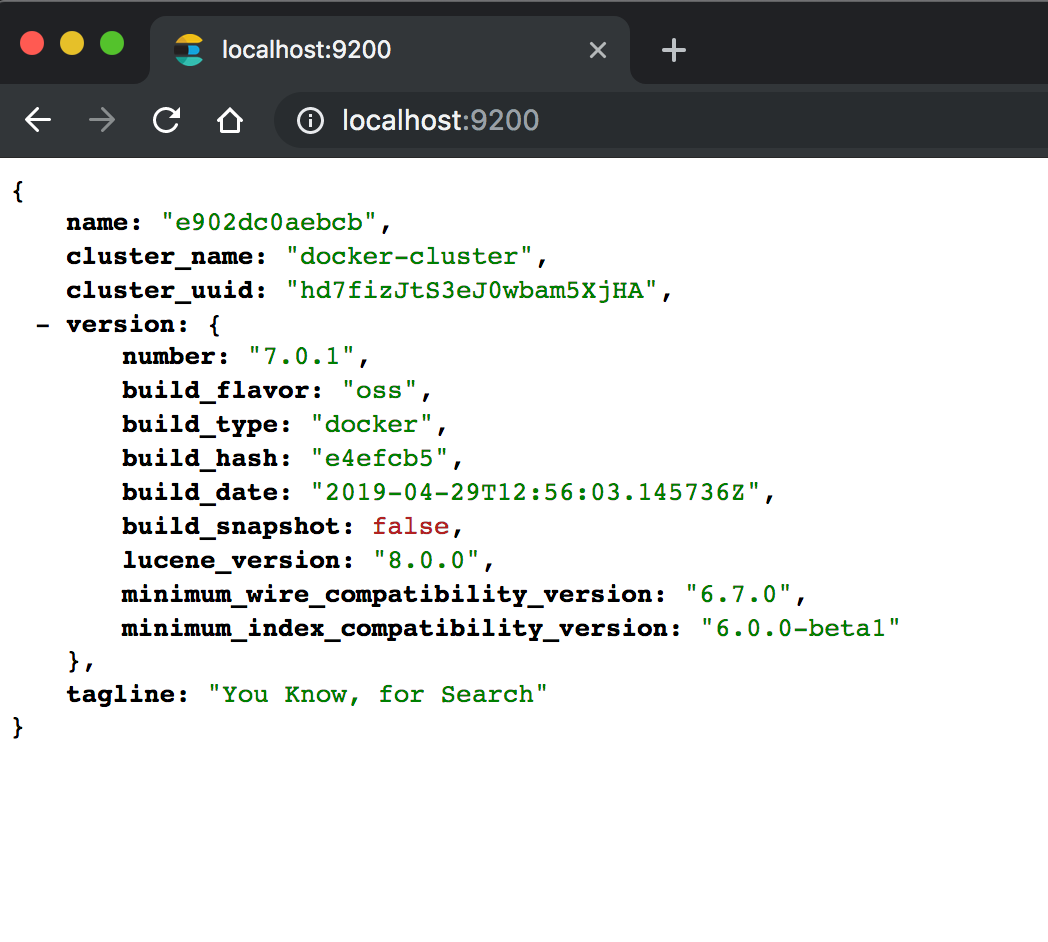
After running this docker-compose file using docker-compose up -d , browse to http://localhost:9200 to verify that Elasticsearch is up and running. The output should be similar to below.
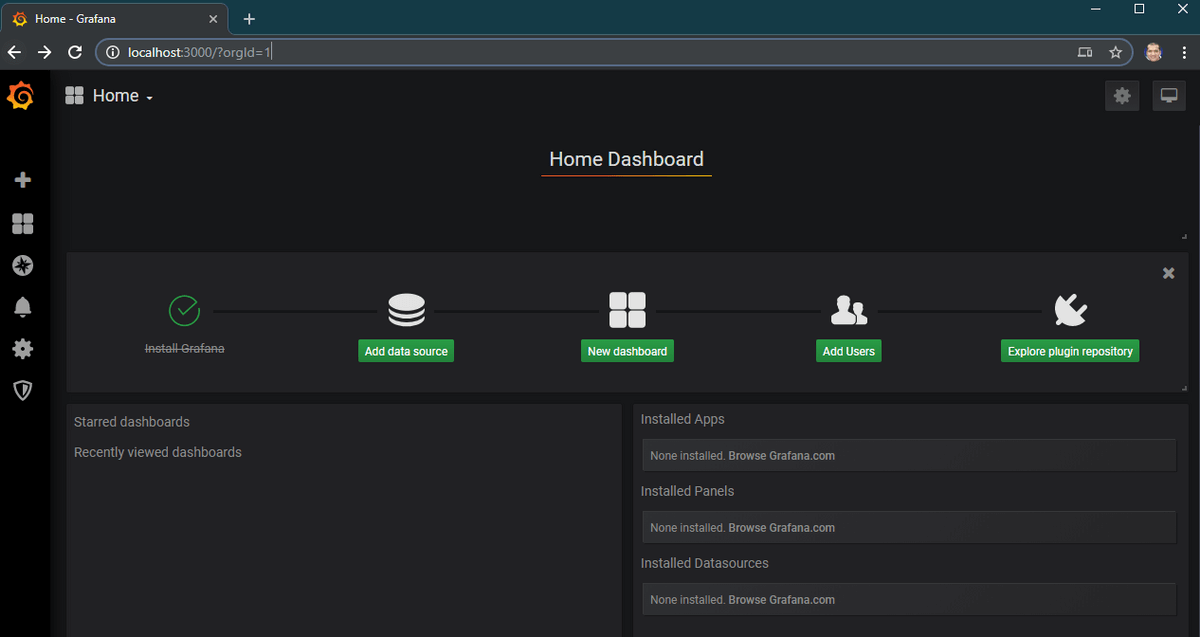
We will also verify that Grafana is up and running by going to http://localhost:3000. The default credentials are admin/admin.
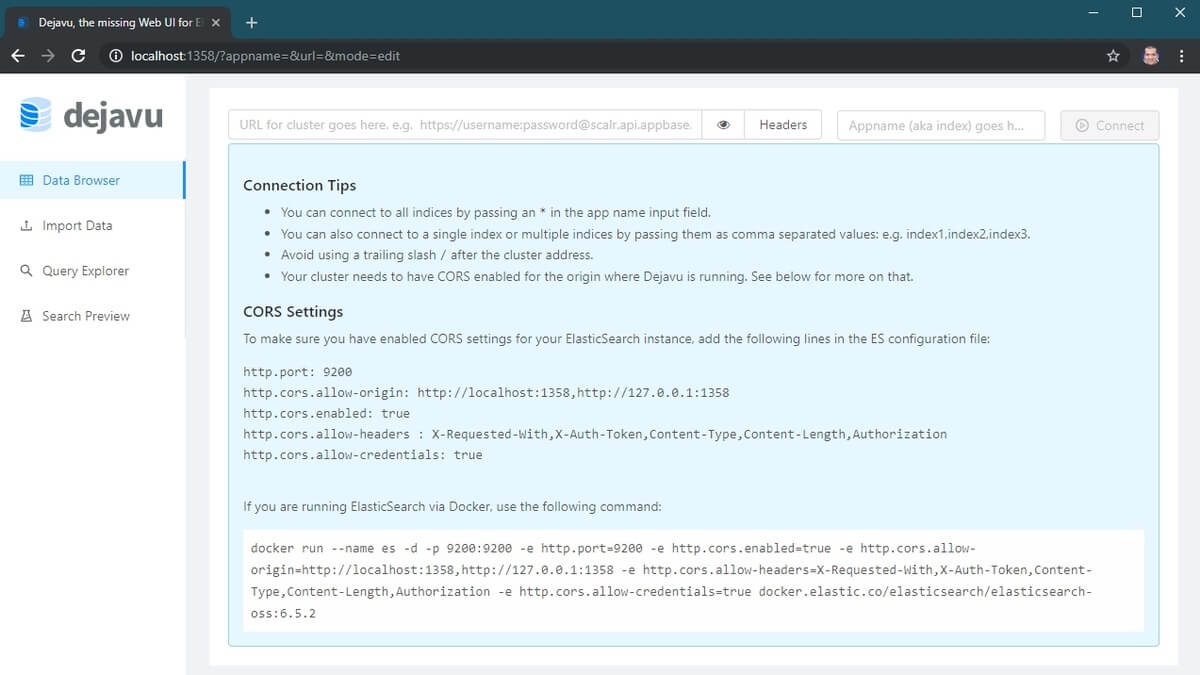
If we go to http://localhost:1358, you’ll see the interface of Dejavu.
Now, we will import the sample data into Elasticsearch. We’ll simply follow the steps on the official Elasticsearch site to load logs.json data into Elasticsearch.
Specifically, we will execute the following commands:
1. We will download the logs.jsonl file from the elastic servers:
curl -O https://download.elastic.co/demos/kibana/gettingstarted/7.x/logs.jsonl.gz
2. Gunzip the file:
gunzip logs.jsonl.gz
3. And finally, upload to our Elasticsearch instance:
curl -H 'Content-Type: application/x-ndjson' -XPOST 'localhost:9200/_bulk?pretty' --data-binary @logs.jsonl
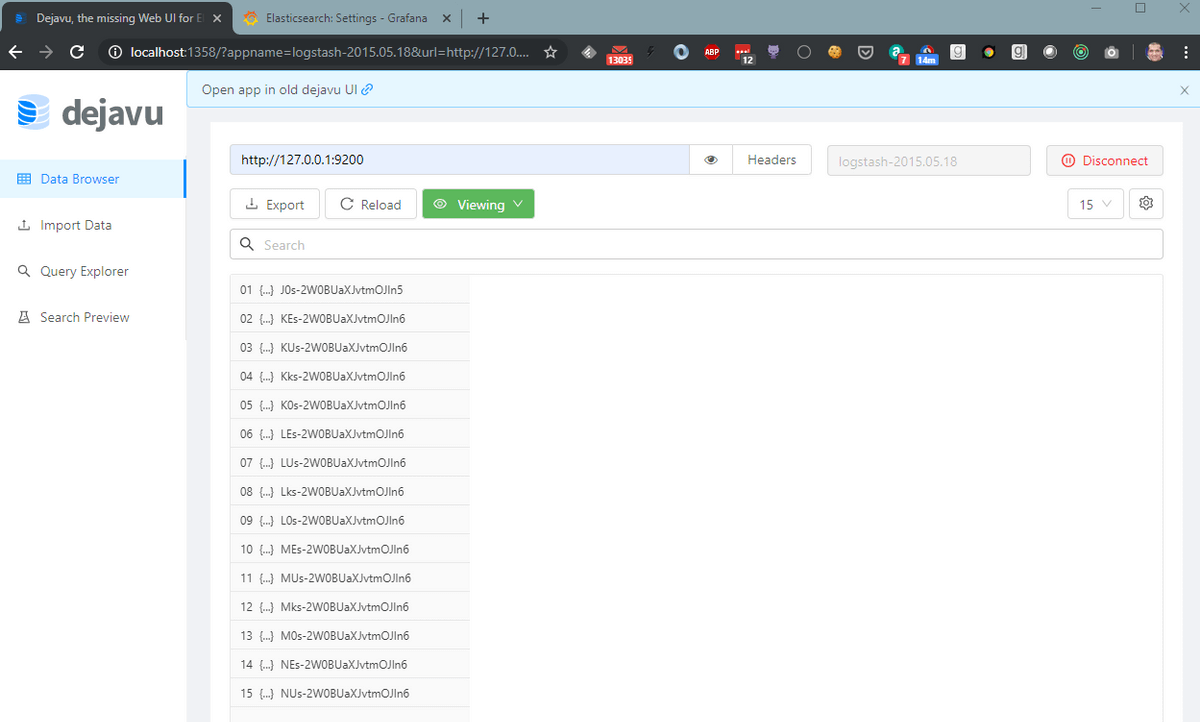
We can confirm the data load by connecting the Dejavu UI to http://127.0.0.1:1358 and logstash-2015.05.18 index:
Now, for the exciting part. We will connect the Elasticsearch data source to Grafana and create visualizations on top of it.
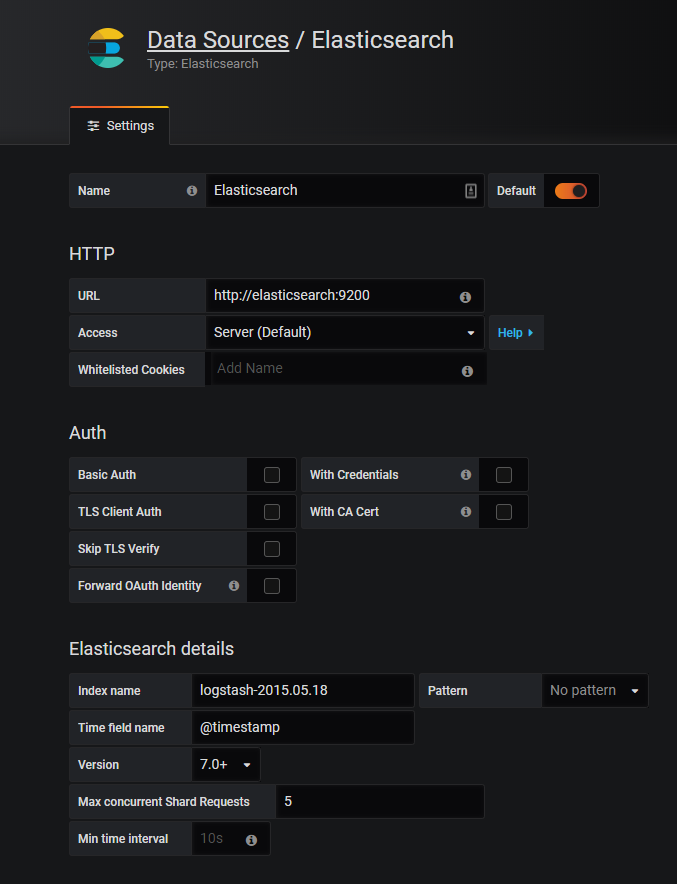
So, head over to Grafana at http://localhost:3000 and add a datasource of type Elasticsearch.
Note: the URL will be http://elasticsearch:9200 if you are using docker as described in this article. This is because we want Grafana to connect to Elasticsearch from the backend (where it says Access: Server) rather than the browser frontend. For the Grafana container, the location of Elasticsearch is http://elasticsearch:9200 and not http://127.0.0.1:9200, as you might expect.
The version would be 7.0+, and we will define the Time field name as @timestamp.
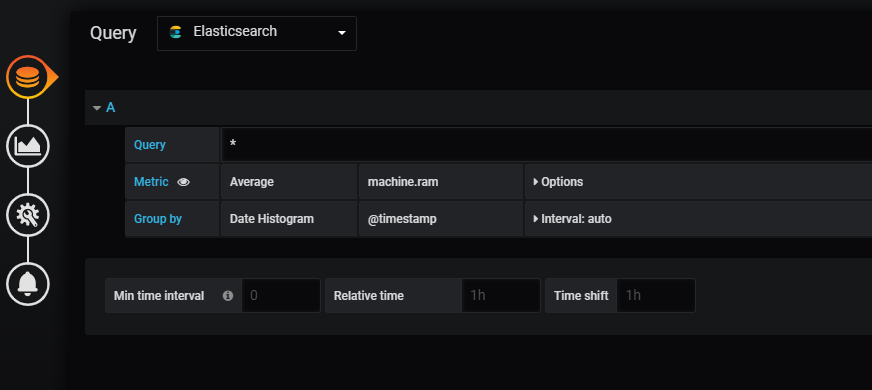
Now let’s create a simple Grafana dashboard and add a simple graph. This is fairly straightforward. The tricky part is configuring the data source and providing the query.
We will make a visualization of the Average machine RAM from the log data. In the query dropdown box, choose Elasticsearch as the data source, and we will use machine.ram as the average metric as shown below:
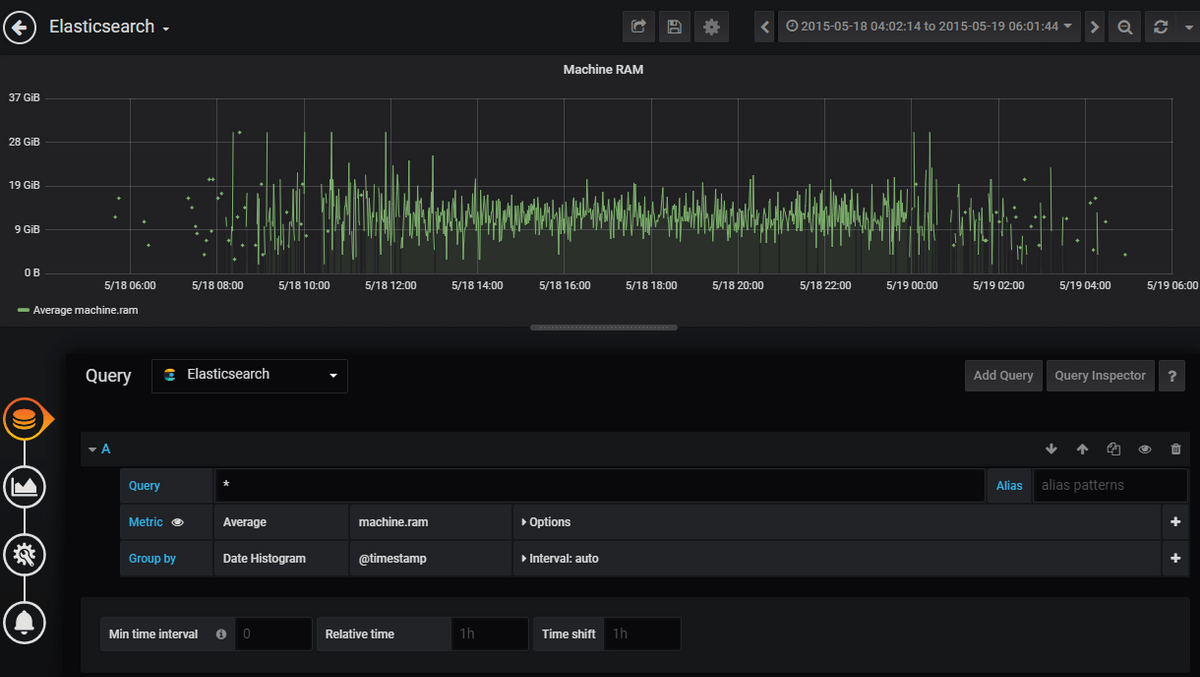
Save the visualization, and we will choose the custom time range in the top right box. This is because our log data contains entries from the month of May 2015. Configuring to this time range gives us the following visualization:
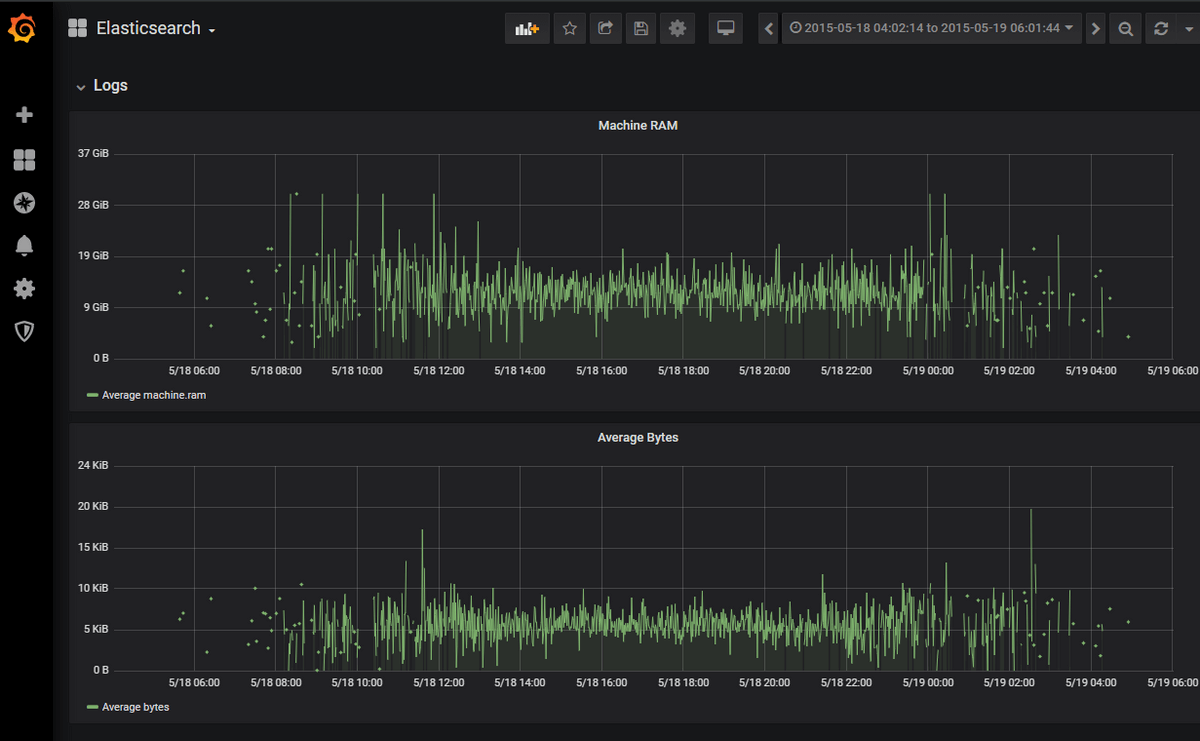
Similarly, I will add the visualization for Average Bytes, and our Grafana dashboard will look like this:
Interested to see how MetricFire can help you with the process and help you get new organizational insight? Now's the time! Try a free trial or book a demo.
Conclusion
We have seen that Grafana provides a seamless way to connect to the Elasticsearch data source, and it provides great visualization through queries. Get on to the MetricFire free trial today and start sending your Elasticsearch data. Also, feel free to book a demo and talk to us directly about the best monitoring solutions for you.
This post came from our guest blogger Madhur Ahuja. Follow him on Twitter for more great ideas and information about monitoring!


