Table of Contents
The proliferation of IoT devices means we have more data about our surroundings than ever before. However, data itself is not useful unless we can take action based on it. In this article, we will show you how you can visualize and monitor your IoT data so that you can effectively act upon them. Note that we use the term IoT data and metrics interchangeably throughout this article.
Get a free trial with MetricFire and start visualizing your data. You can also book a demo and talk to us directly about what MetricFire can do for you.
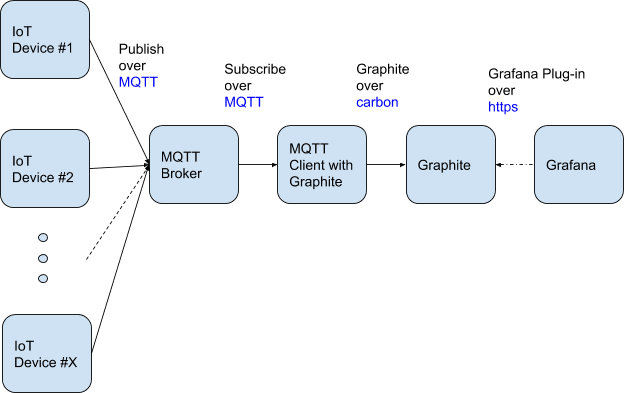
Architecture Diagram: MQTT, Graphite & Grafana
To visualize IoT metrics, we need to make our IoT devices send metrics over MQTT protocol to a time-series data storage platform, such as the popular open-source Graphite, which then exposes API endpoints that an open-source dashboarding system, such as Grafana, can retrieve metrics and display. See "Quick Explanation" for a concise summary of MQTT, Graphite, and Grafana.
Quick Explanation:
- MQTT - MQTT is a lightweight protocol designed specifically for use by IoT devices, which has low battery, and less than ideal network connectivity.
- Grafana - Grafana, simply put, is a beautiful and powerful dashboard system that can be used to display any data from data sources that Grafana has a plug-in for
- Graphite - Graphite is a time-series data collector system. Time-series data stored in Graphite can be retrieved from a set of API endpoints.
Implementing MQTT, Graphite & Grafana
There are 2 ways to implement these, and which way you choose depends, in some way, upon the kind of person you are. Which one are you?
- "I am a busy person and I don’t want to be woken up at night by a failure in my setup
Use a hosted service/MetricFire. Setup takes 5 minutes (minimal skill set)
- "I am a real IT man/woman!"
Set up everything yourself! Setup can take over 10 hours (depending on skillset)
Here are the brief steps required for each method:
Method 1: Use a Hosted Service (5 minutes)
- Configure your IoT devices to send data over MQTT protocol to an MQTT broker using a QTT channel
- Configure Grafana to retrieve IoT data from Graphite for display
Method 2: Set up Everything Yourself (> 10 hours)
- Set up MQTT broker
- Set up Graphite
- Set up Grafana
- Configure your IoT devices to send data over MQTT protocol to an MQTT broker using an MQTT channel
- Configure the MQTT client to subscribe to the MQTT broker
- Configure the MQTT client to send the IoT data over carbon protocols to Graphite
- Configure Grafana to retrieve the IoT data from Graphite for display
Method 1: Use a Hosted Service
We will primarily focus on the simpler ‘Use a Hosted Service’ method in this article and leave the gory details for the more complex ‘Setup Everything Yourself’ method for a future article.
Step 1. Sign up for a Hosted MQTT/Graphite/Grafana service, e.g., MetricFire
Step 2. Get the MQTT broker endpoint and channel this from the dashboard
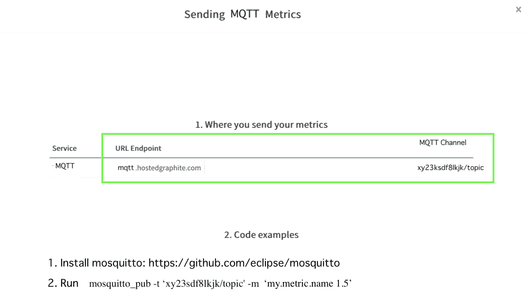
Step 3. Configure your IoT devices to send to the MQTT broker endpoint/channel
This depends on your IoT device but, in general, you just need to point your IoT device from the MQTT client (publisher) to the MQTT broker hostname/IP address and MQTT channel from the previous step.
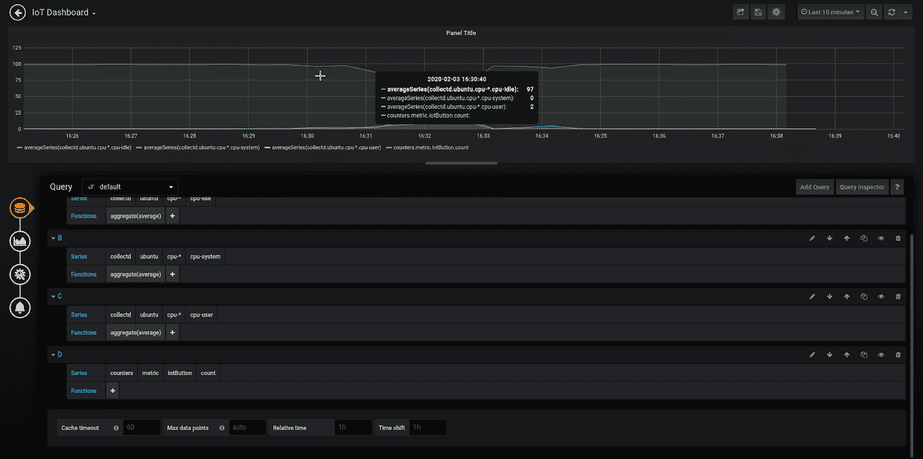
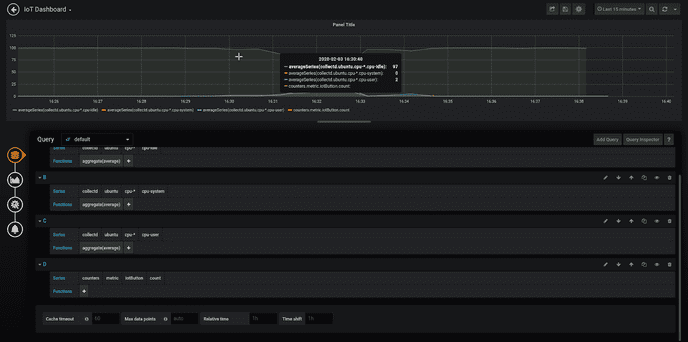
Step 4. On the left-hand menu, click on Grafana, and visualize your dashboard!