Table of Contents
MetricFire is a full-scale platform that offers infrastructure, system, and application monitoring using a suite of open-source monitoring tools. The platform allows you to use Graphite-as-a-Service and have your metrics displayed on aesthetically-pleasing Grafana dashboards.
Using MetricFire, you can understand complex systems at a glance because of its powerful monitoring capabilities. In this article, we will highlight everything you need to know to understand and use MetricFire for your business.
Get started with MetricFire by signing up for the Free Trial. You can get on the platform and see what tools we have to offer. Also, book a demo and talk to us directly about your monitoring needs.
Key Features of MetricFire
As mentioned, MetricFire offers its users a complete ecosystem of end-to-end infrastructure monitoring, which is made up of two of the most popular open-source monitoring software services: Graphite and Grafana. As well, plugins for a number of other open-source projects are preconfigured, such as StatsD and collectd. You get all these within a hosted environment as a single product. Not only does MetricFire fit well into the infrastructure monitoring use-case, such as network monitoring and server monitoring, but we also do application monitoring and business intelligence.
Through this hosted environment, MetricFire works to boost the unique features of the open-source projects to give you more functionality than the original products. Below are some of the MetricFire features at a glance:
Cloud and on-Premise Monitoring
MetricFire offers cloud monitoring for any business scale, or customers can opt for on-premise. You can use Hosted Graphite to view real-time metrics through the Grafana dashboards. The Hosted Graphite service goes beyond the open-source project by offering better data aggregation, pre-setup APIs, alerting, and improved collector daemons such as “the Hosted Graphite agent”. You will be able to see all metrics on the eye-catching Grafana dashboards.
You will get long-term storage and Grafana dashboards as part of the hosted package. You can choose whether to retain your metrics for months, years, or even indefinitely. Your data is secured, as all read and write operations take place over the secure HTTPS protocol. Integration with an in-house setup is as simple as making a single change to your config file.
Hosted Graphite
Graphite as a monitoring tool is best for a few key use-cases. It specializes in two things: storing numeric time-series data and rendering graphs for said data. Graphite itself was not designed to collect data, but it includes a component called Carbon which passively listens for time-series data, and is usually deployed with a collector agent such as StatsD or collectd. MetricFire uses its own agent, called the Hosted Graphite Agent, which makes collecting data easier than with third-party collectors.
The data is then stored within a library called Whisper. Using the stored data, you can render on-demand graphs. To use Graphite, external applications should be configured to send data to the Carbon component, since Graphite doesn’t actively pull data. MetricFire’s Hosted Graphite also improves upon Whisper with a cluster-native storage system.
MetricFire takes all the good aspects of open-source Graphite and then adds all the features that were missing to make it much more useful. Some add-ons include team accounts, an inbuilt collector agent, integrations to services and other technologies like AWS and Heroku, logging tools, granular dashboard permissions, and many more.
Through MetricFire’s hosted Graphite, you can get alerts for any actionable events through multiple online channels, control access to your dashboards, collaborate and share with your team, and modify or automate what you need to do through the MetricFire APIs.
Grafana Dashboards
Through MetricFire's hosted Grafana dashboards, you can gain a deeper understanding of your data on a slick, feature-rich graph and dashboard editor. The intuitive user interface makes it easy to create and edit dashboards. You can add panels and rows, apply zoom, and use many other features to customize your graphs as needed. MetricFire’s Grafana gives you access to:
- Hundreds of pre-built dashboards customized for different plugins
- Easy alerting according to your preferred notification channel
- Managed servers and data storage centers
All of the MetricFire plans include Grafana dashboards for data visualization, regardless of the size of the plan.
Pricing and Plans
MetricFire has designed plans according to the needs of different organization types. Each plan can be run as Graphite with Grafana Dashboards on all plans. Smaller and growing teams need smaller plans with limited metrics, and the details are as follows:
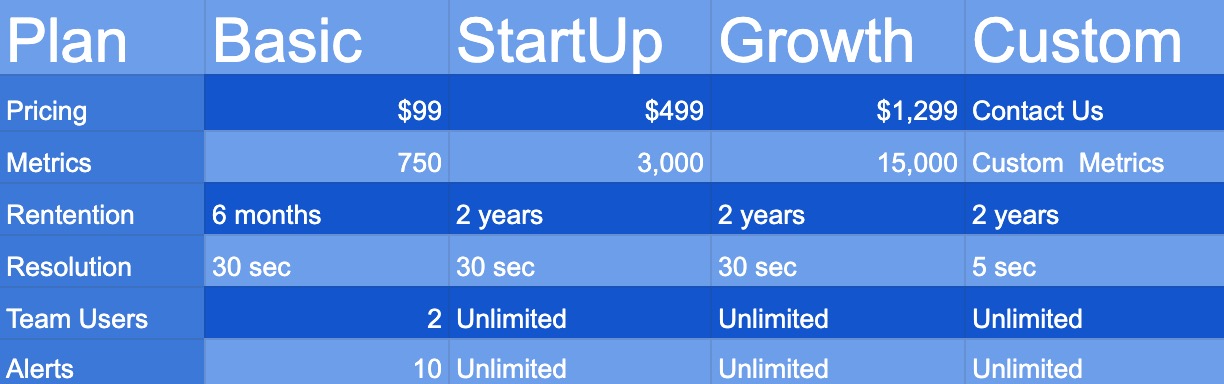
MetricFire is dedicated to supporting all customers to get the most out of the MetricFire product. We’re here to consult customers on the best alerting design and monitoring design. We work with our customers to build out metrics that exactly meet their needs, and to build custom dashboards in the cases where the defaults are not quite right. Get us on a video call by booking a demo, and we’ll be happy to talk more about what your company is looking to monitor.
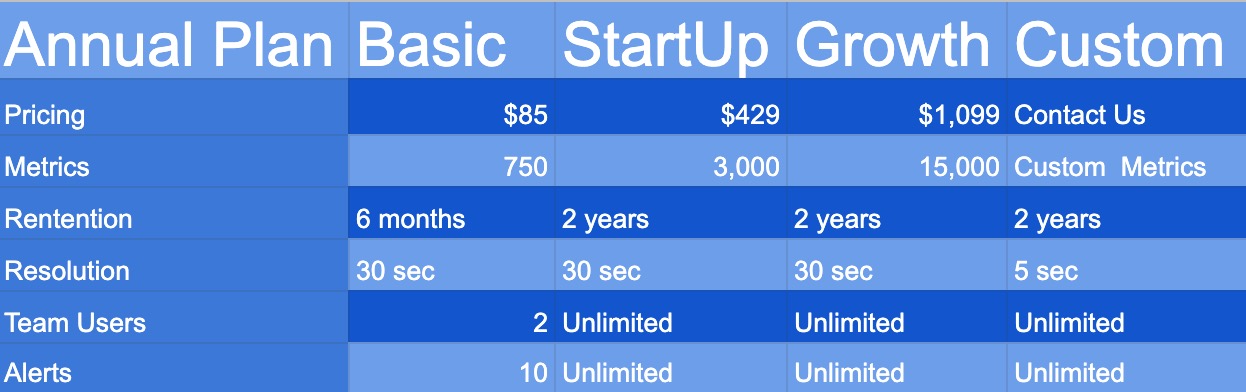
Annual plans are ideal for larger teams with augmented metrics and scaling needs. The Growth annual plan is ideal for larger teams requiring increased metrics. Large teams requiring powerful solutions may benefit from custom Custom solutions. The details for annual plans are as follows:
Sign up for a free 14-day trial which gives you a full taste of hosted Graphite, Grafana, Tasseo, Graphite Dashboards, Team Accounts, and Hosted StatsD. The trial comes with a soft limit of 1,000 metrics, but you can ask for more. Once received, your first metric data will show after about one minute, but subsequent data will reflect on your account immediately.
The trial package includes 5 team users, but you can also ask for more users if needed. The app includes a support link, where all questions are addressed by qualified and experienced MetricFire engineers.
Prometheus vs. Graphite: Which One Should I Use?
Whether to use Prometheus or Graphite is a great question. We’ve looked deeper into this decision in our blog article, Prometheus or Graphite. While Prometheus is a newer software that has a multidimensional data structure, Graphite is robust and sufficient. The key thing to remember is that Hosted Graphite by MetricFire is more than just Graphite. Our Hosted Graphite product actually adds data dimensionality and better data storage. Talk to our engineers for more information about what will work best for you by booking a demo.
If you need a more detailed comparison, check out these features:
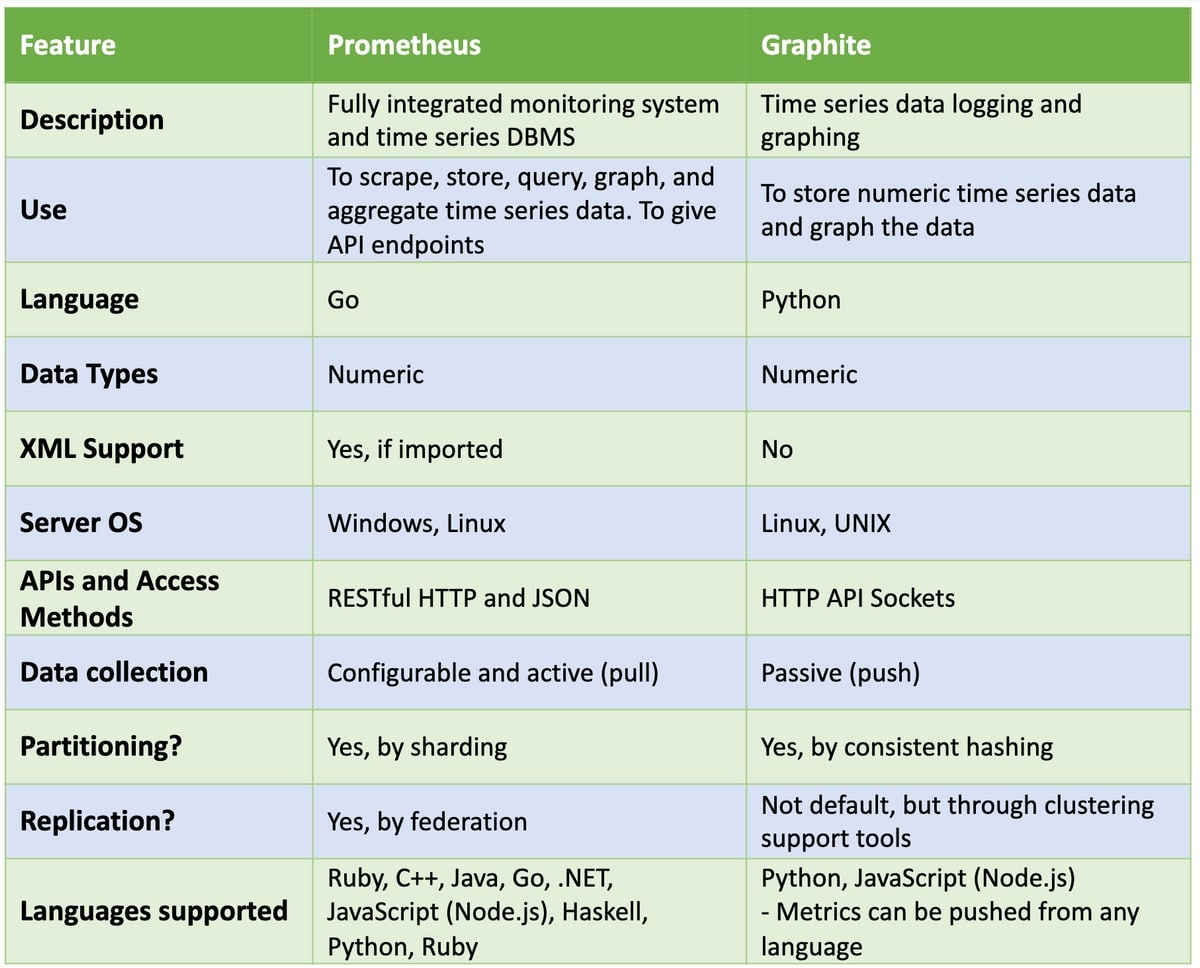
Prometheus values accuracy and reliability, therefore it isn’t a good fit where the data collected isn’t complete or detailed enough. You need 100 percent accuracy, otherwise, you should use Graphite to collect and analyze the incomplete data and Prometheus for the rest of your system monitoring.
Benefits of MetricFire
No vendor lock-ins
MetricFire allows you to request for a full export at any time because you will always own the data you input. You get all the benefits of an open-source tool with the stability and security of a SaaS tool.
Budgeting
A structured pricing model allows you to save time and work within your budget. The predictability and transparent pricing allow you to keep your costs in check and plan for the future.
Transparency
MetricFire works transparently on all aspects of its operations of SaaS system monitoring. You can see their own internal system metrics on their public status page.
Robust Support
Technical support is provided by engineers for engineers, so you can expect detailed and relevant answers to your queries.
Conclusion
Whether your system needs to use Graphite, you will benefit from having hosted toolkits provided by MetricFire. Not only will you benefit from the stability and security of a hosted platform, but you will also enjoy the additional features unique to MetricFire’s deployments of these open-source tools. MetricFire is constantly updating and offering new plugins, allowing you to use the technology without worrying about updates, installs, or maintenance.
Getting started with MetricFire depends on your unique organizational needs and the nature of your infrastructure. If you’re not sure where to begin, someone from MetricFire can help you figure out where to begin on a demo. If you have any questions, reach out to our technical support with MetricFire’s engineers. Sign up for a free trial today and get started!

