

Table of Contents
Great systems are not just built. They are monitored.
MetricFire runs Graphite and Grafana as a fully managed service for growing engineering teams, taking care of storage, scaling, and version updates so your team doesn't have to. Plans start at $19/month, billed per metric namespace rather than per host, and include engineer-staffed support. Integrations work natively with Heroku, AWS, Azure, and GCP, and data is stored with 3× redundancy in SOC2- and ISO:27001-certified data centres.
Introduction
As modern infrastructure grows more dynamic and distributed, collecting logs alongside metrics becomes a critical part of any observability strategy. To make this easy and powerful, MetricFire now supports a direct logging pipeline using Grafana Loki. This allows you to forward system logs from your servers to Hosted Graphite's Loki backend and visualize them in your Hosted Grafana dashboards with full control over queries, filtering, and alerting.
This guide outlines how to set up and use this new integration. We'll walk through installing a collector on an Ubuntu server, forwarding your entire syslog output to the Hosted Graphite Loki endpoint, configuring Grafana to use Loki as a data source, and building dashboard panels that show both raw logs and extracted metrics.
Start a chat with us today if you are interested in testing MetricFire's new Logging Integration for FREE. We will help you every step of the way, from collection to visualization!
Step 1: Install a Collector on your Server
We support log collection via OpenTelemetry Contrib and Promtail. In this example, we'll detail how to configure Promtail since it is the official log shipping agent for Grafana Loki. It runs as a lightweight binary that tails log files (like /var/log/syslog) and forwards them to a Loki endpoint over HTTP.
Install/unpack Promtail (Ubuntu)
wget https://github.com/grafana/loki/releases/download/v3.5.3/promtail_3.5.3_amd64.deb

sudo apt-get install -y ./promtail_3.5.3_amd64.deb
Configure Promtail to Forward Logs
Update your Promtail configuration file at /etc/promtail/config.yml to include the following:
server:
  http_listen_port: 9080
  grpc_listen_port: 0

positions:
  filename: /tmp/positions.yaml

clients:
  - url: https://<YOUR-API-KEY>@www.hostedgraphite.com/logs/sink

scrape_configs:
  - job_name: syslog
    static_configs:
      - targets:
          - localhost
        labels:
          host: <HOST-NAME>
          job: syslog
          __path__: /var/log/syslog
NOTE: Make sure to replace YOUR-API-KEY and HOST-NAME in the above config and restart the Promtail service:
sudo systemctl restart promtail
sudo systemctl status promtail
You may also need to assign permissions to allow Promtail to read your /var/log files:
sudo usermod -aG adm promtail
sudo systemctl restart promtail
Step 2: Configure a Loki Data Source in MetricFire's Hosted Grafana
If you reach out about trying our new Logging feature for free, we will create a Loki Access Key in your Hosted Graphite account. If you don't already have a Hosted Graphite account, sign up for a free trial here to obtain a Hosted Graphite API key and Loki Access Key.
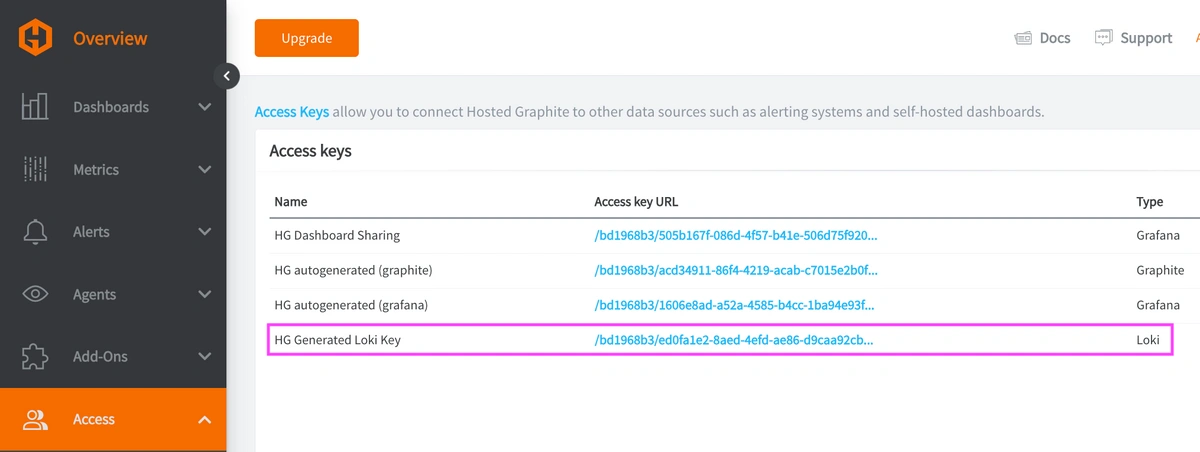
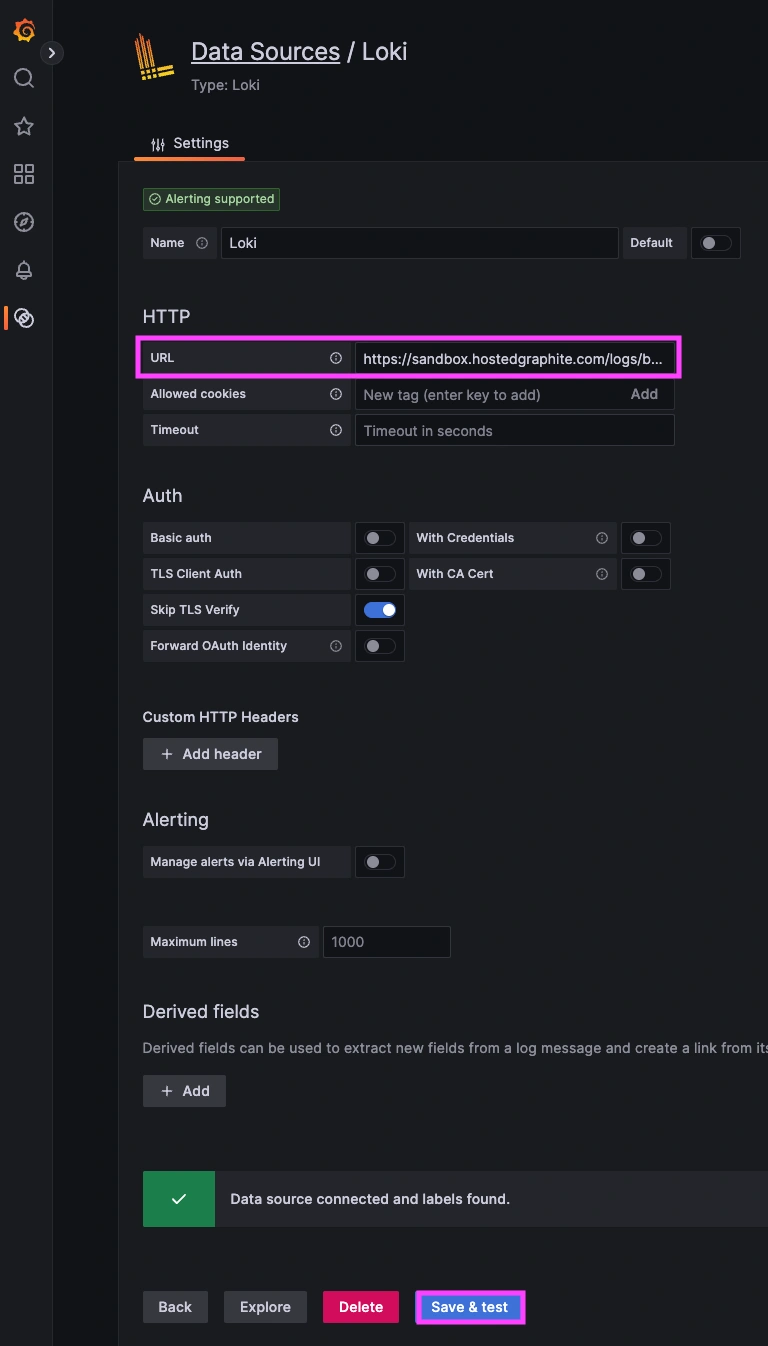
Now you can navigate to your Hosted Graphite Dashboards => Settings => Data sources => Add New Data source (Loki). Now you will be able to add a URL for our Loki endpoint, which includes your Loki Access Key:
https://www.hostedgraphite.com/logs/<UID>/<LOKI-ACCESS-KEY>
Step 3: Query and View Logs in Hosted Grafana
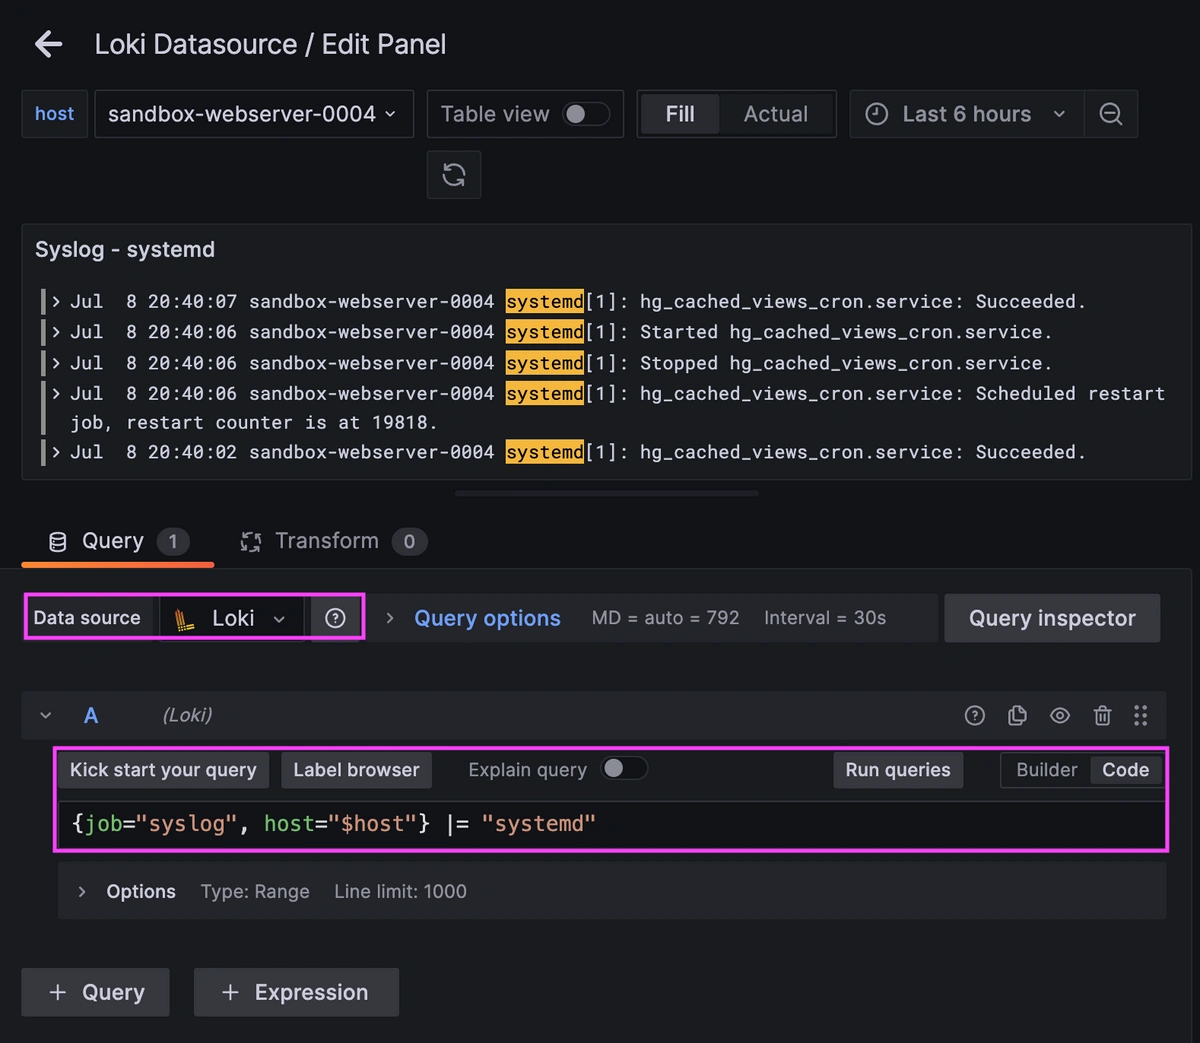
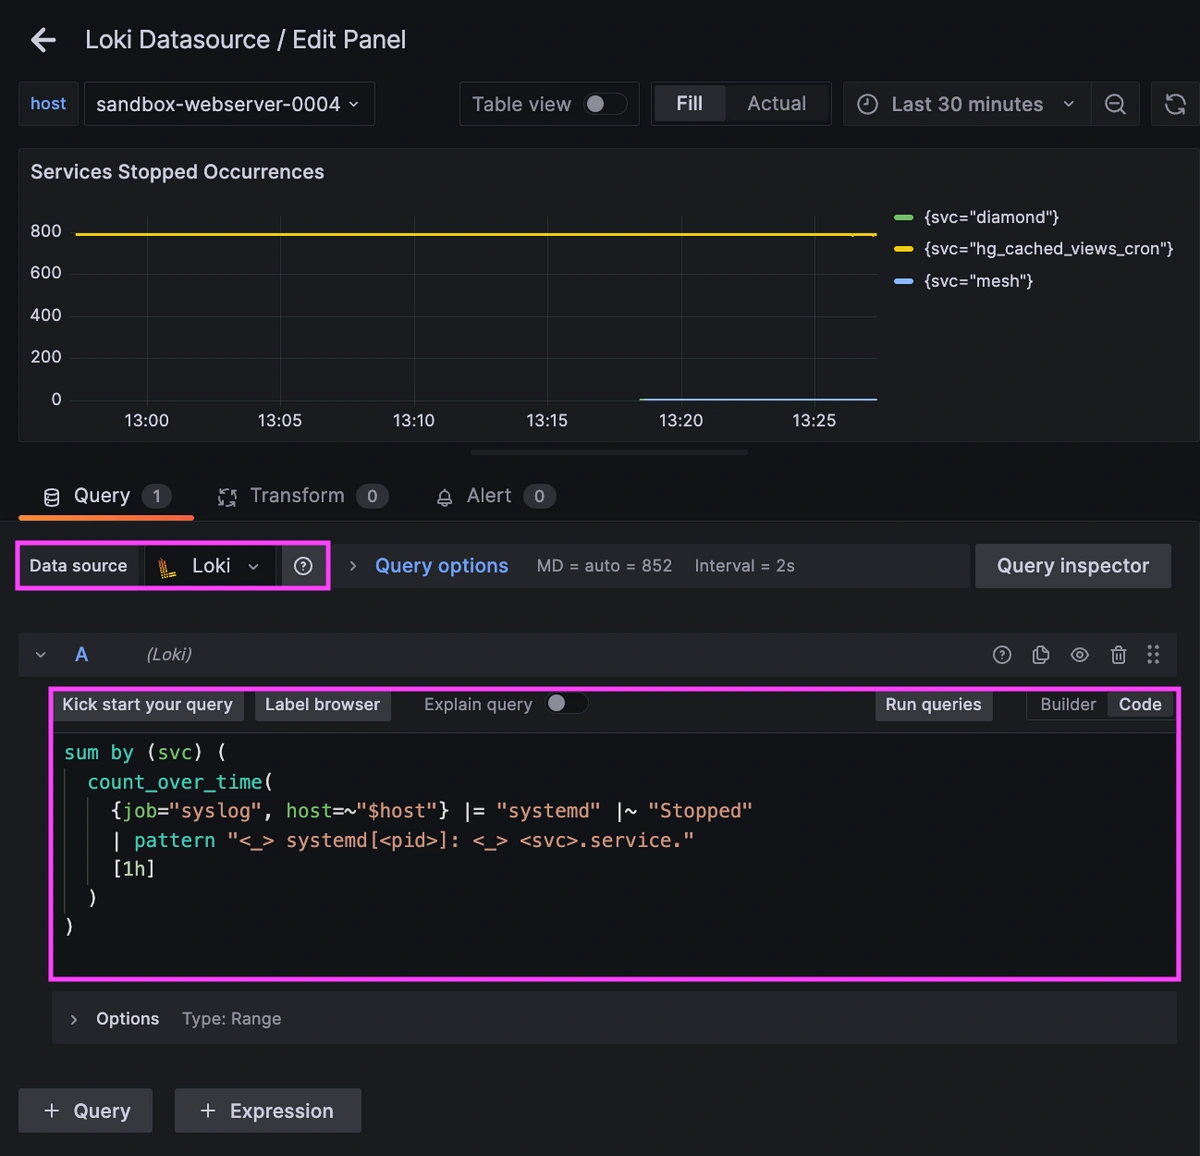
After logs are ingested by Loki and the data source is connected, you can create a new dashboard panel, select Loki as your Data source, and format a query in 'code mode'.
To view syslog messages from your server:
{job="syslog", host="<HOST-NAME>"}
You can filter further using log content:
{job="syslog", host="<HOST-NAME>"} |= "systemd"
Loki supports a powerful LogQL syntax with regex filtering, line parsing, and field extraction.
Step 4: Extract and Graph Log-Based Metrics
Loki allows you to convert logs into metrics using count_over_time() and similar functions. This turns raw log patterns into quantifiable data that you can graph and alert on. By extracting metrics from your logs, you gain the ability to correlate log-based signals with your existing metrics infrastructure, enabling richer observability across your entire stack.
Count CRON executions
sum by (cmd) (
  count_over_time(
    {job="syslog"} |= "CRON"
    | regexp "CMD \\((?P<cmd>[^)]+)\\)"
    [1h]
  )
)
Count Errors
count_over_time({job="syslog"} |= "ERROR" [5m])
Track service starts/stops by name
sum by (svc) (
  count_over_time(
    {job="syslog"} |= "systemd" |~ "Stopped|Started"
    | pattern "<_> systemd[<pid>]: <_> <svc>.service."
    [1h]
  )
)
Conclusion
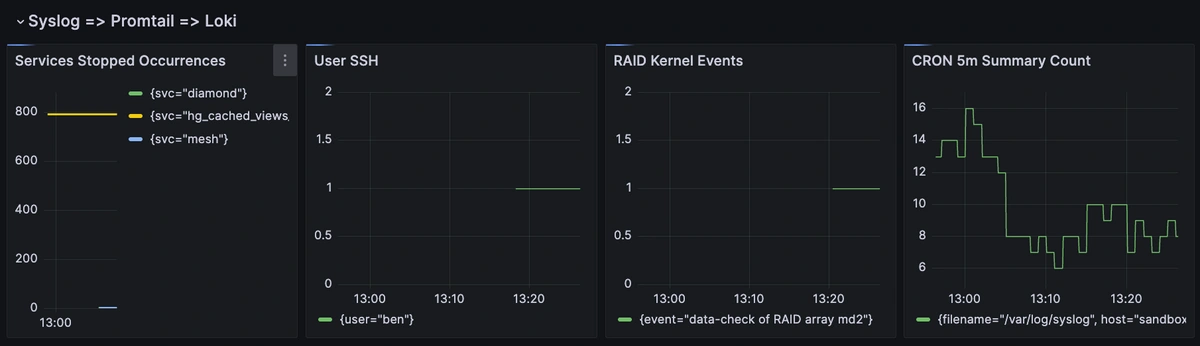
Bringing logs and metrics together in one place gives you a much clearer picture of what's happening on your systems. In this guide, we walked through setting up Promtail on an Ubuntu server, forwarding syslog data to Hosted Graphite's Loki endpoint, connecting that data to Grafana, and building useful dashboards that let you see both raw logs and visualized metrics.
By combining logs and metrics in Grafana, you can troubleshoot faster, spot patterns more easily, and get critical context around performance issues or system events. Instead of jumping between tools or manually inspecting your server logs, you can correlate a spike in metrics with the exact log line that makes sense in a single dashboard.
This Loki-based logging integration is quick to set up but powerful in practice. Whether you're tracking service restarts, failed jobs, or kernel anomalies, it gives you the visibility you need to stay ahead of problems and reduce time to resolution. If you're looking to expand this pipeline with automated alerts, structured log parsing, or advanced Graphite metrics, we'd love to help.
Reach out to the MetricFire team today and let's build something great together!


