Explore insightful articles, tutorials, and updates on MetricFire’s blog. Stay informed about the latest trends in monitoring, cloud services, and best practices for optimizing your infrastructure and applications.

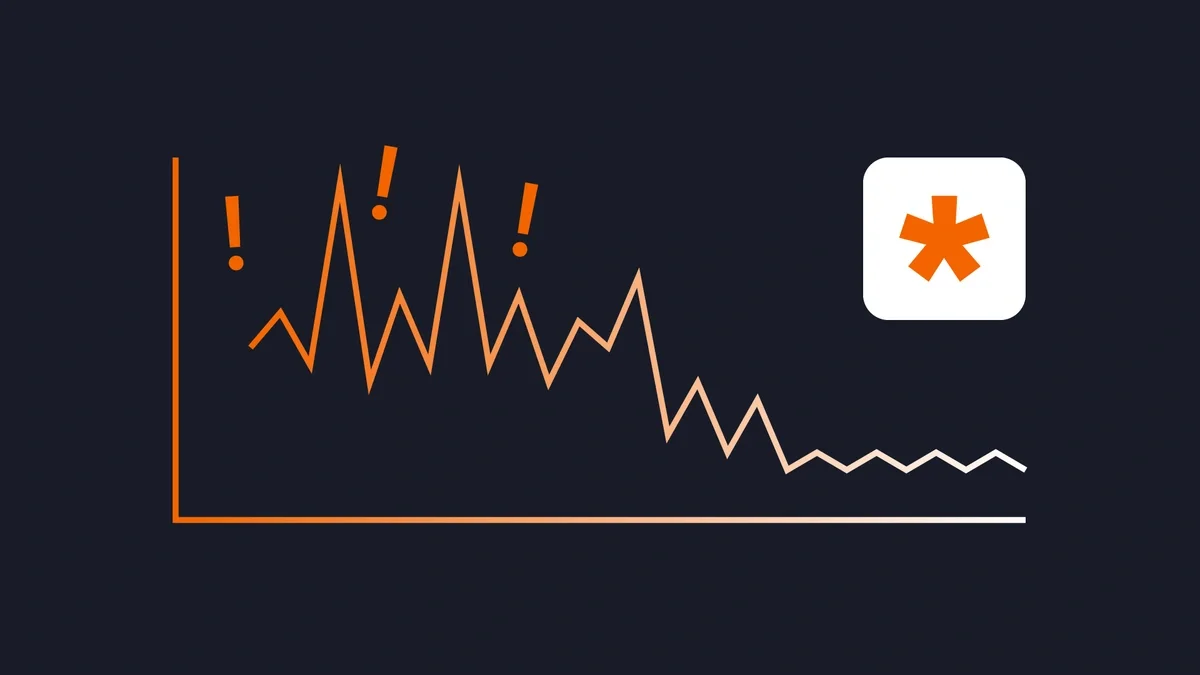
Compare Datadog alternatives on market position, pricing, and core strengths. We'll look at Datadog vs. MetricFire, New Relic, and more. Continue Reading
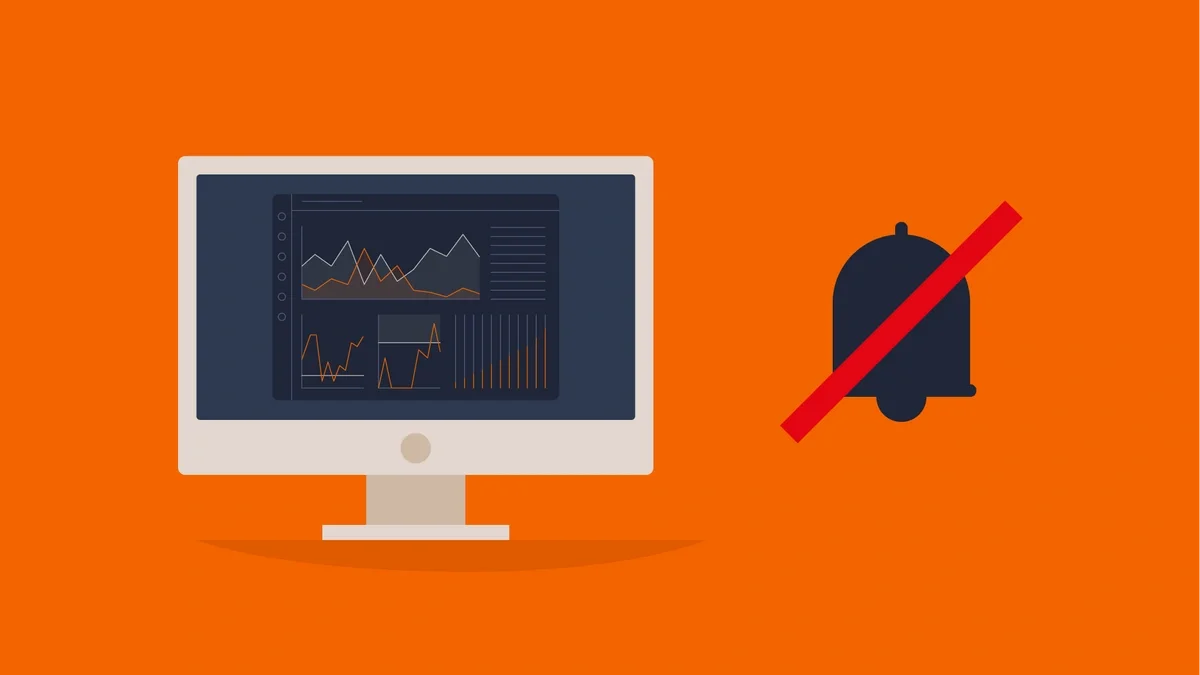
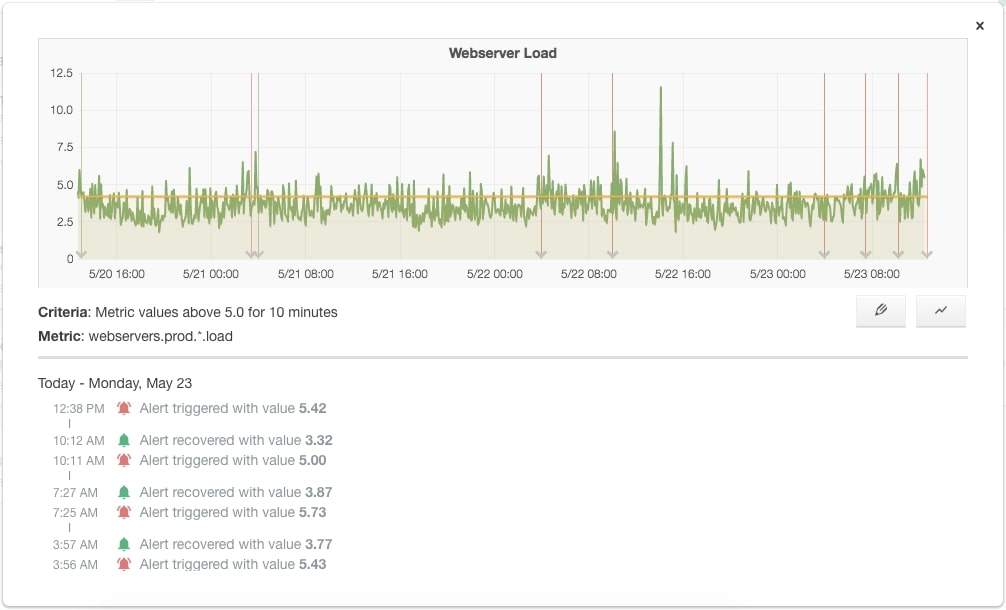
Learn how MetricFire reduced noisy infrastructure alerts by restructuring Graphite alerts around services and... Continue Reading
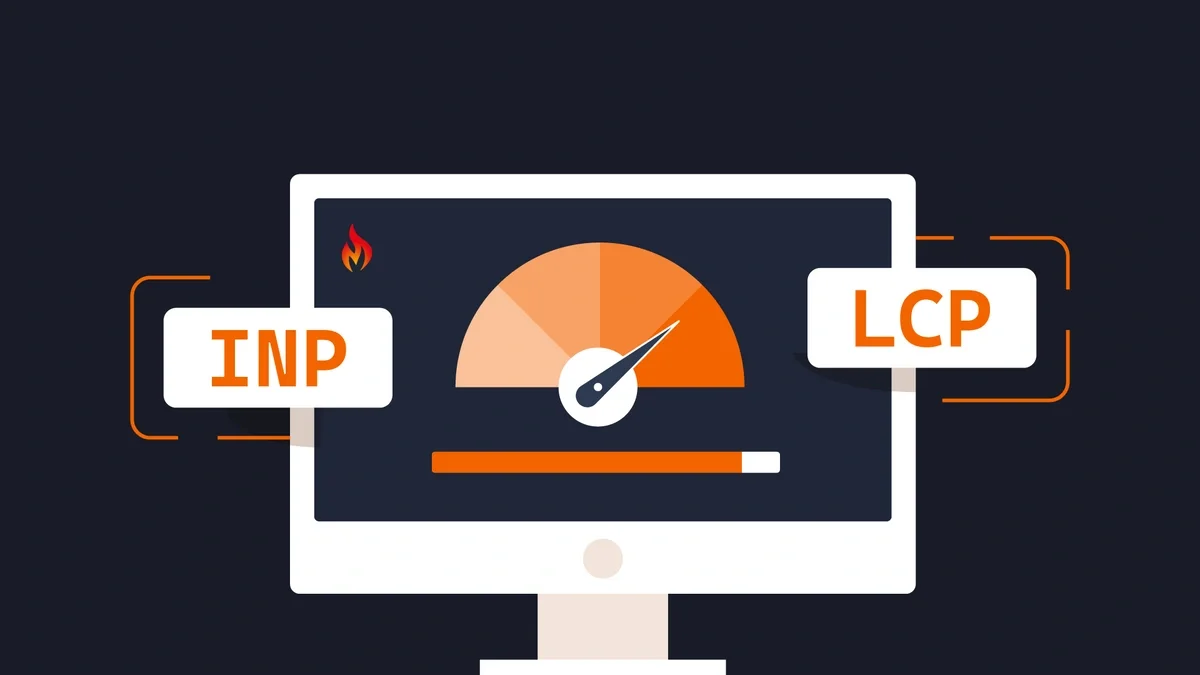
We improved LCP by 35% on metricfire.com by optimizing the critical rendering path, and... Continue Reading

Service-level alerting reduces noise by grouping related signals into a single view of a... Continue Reading
By grouping Graphite metrics using wildcard queries, alerts can be defined around meaningful dimensions... Continue Reading
Learn how to structure Graphite metrics using "services" and "signals" to create efficient, service-level... Continue Reading
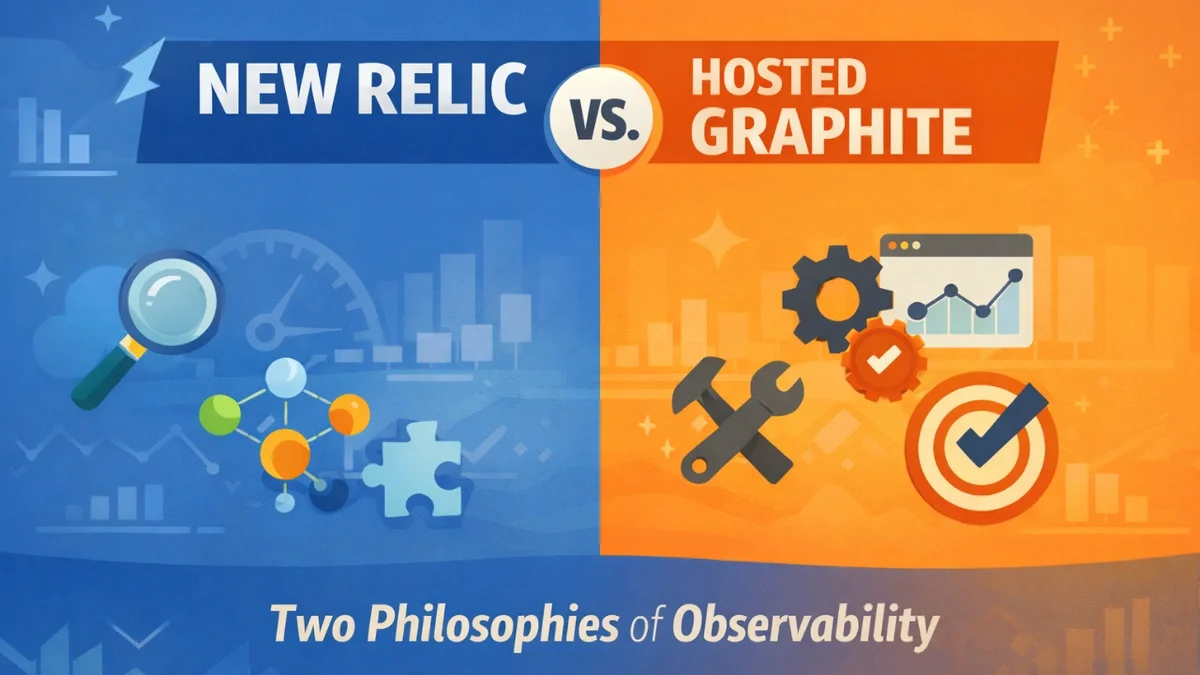
A balanced, developer-focused comparison of New Relic and Hosted Graphite, exploring the tradeoffs between... Continue Reading

Choosing the right IoT metrics tool turns unused smart meter data into real-time insights... Continue Reading

Reduce latency and balance IoT metrics in multi-cloud Kubernetes using edge computing, LoadBalancer tuning,... Continue Reading
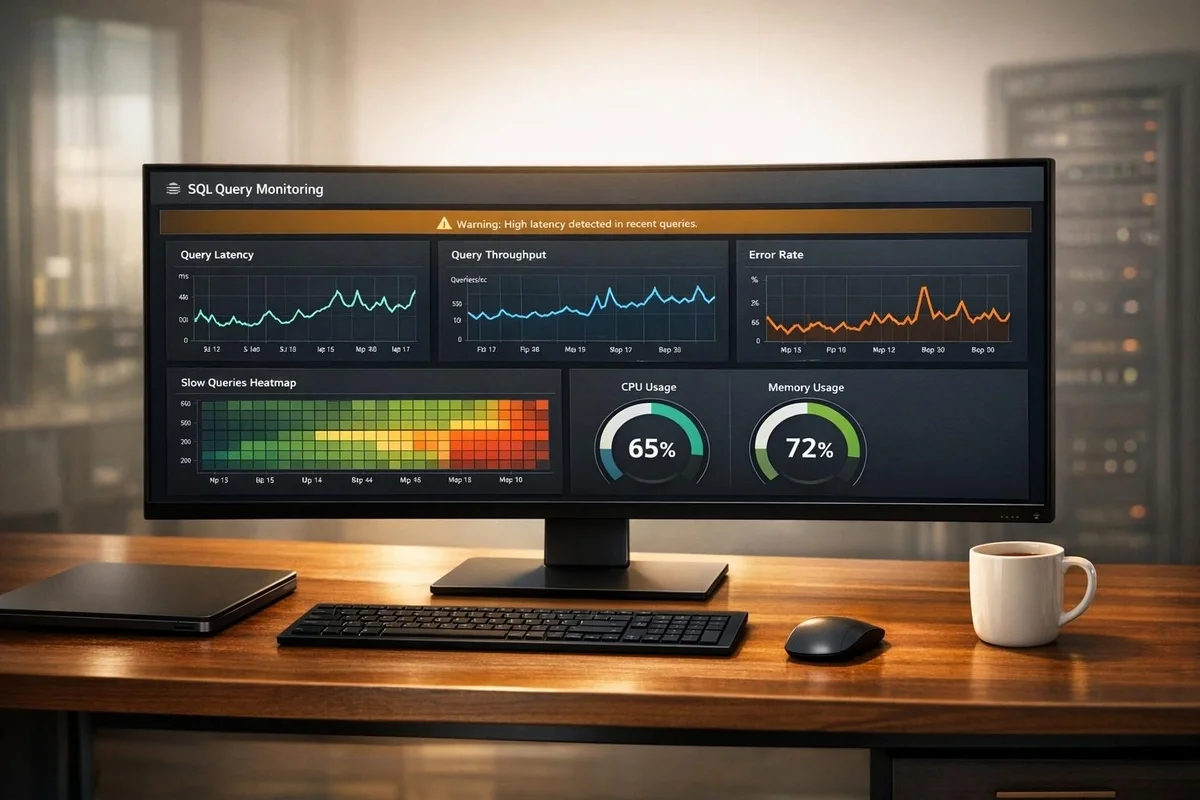
Guide to monitoring SQL queries with Grafana: key metrics, dashboard design, alerting best practices,... Continue Reading
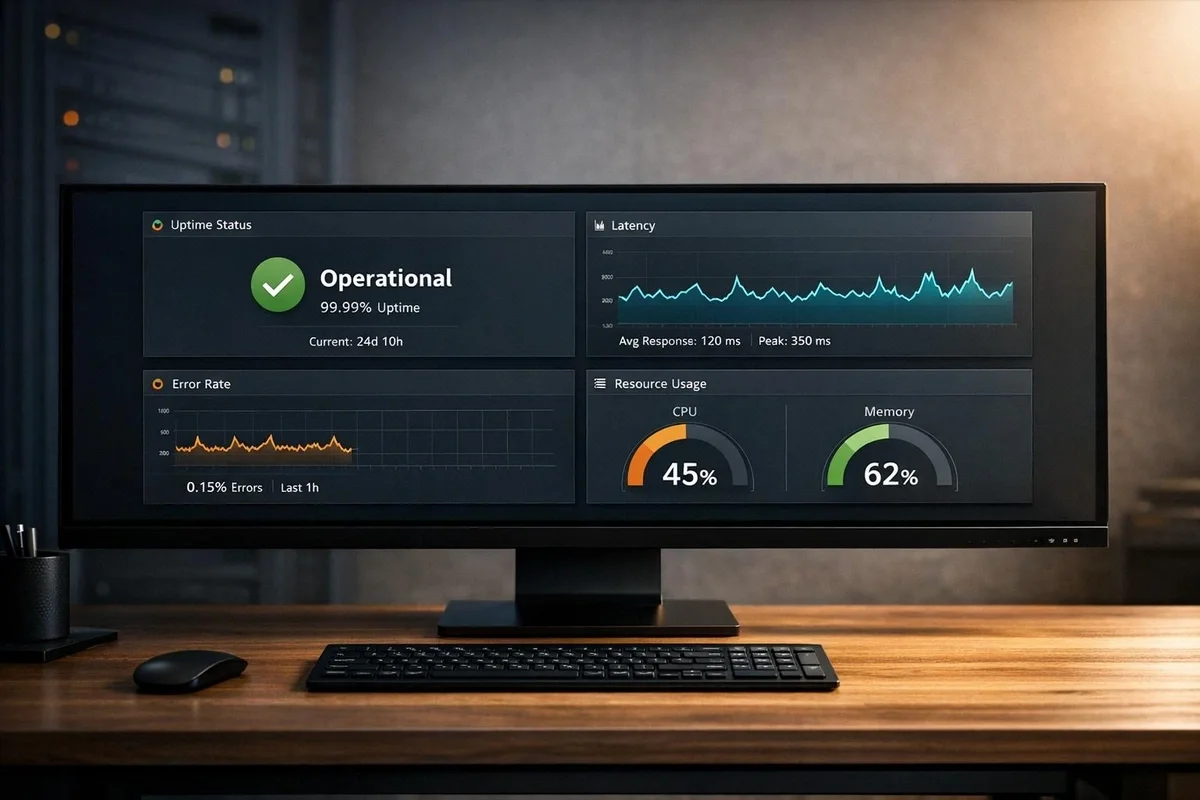
Monitor database uptime, latency, errors, and resources with Grafana: install exporters, configure data sources,... Continue Reading

Real-time visibility into system metrics with fast dashboards, live streaming, and optimized alerts for... Continue Reading

Send plaintext custom metrics via TCP, UDP, or HTTP to Hosted Graphite, visualize them... Continue Reading
Step-by-step Grafana guide: install on Windows/Linux/macOS, connect Prometheus and other sources, build dashboards, set... Continue Reading
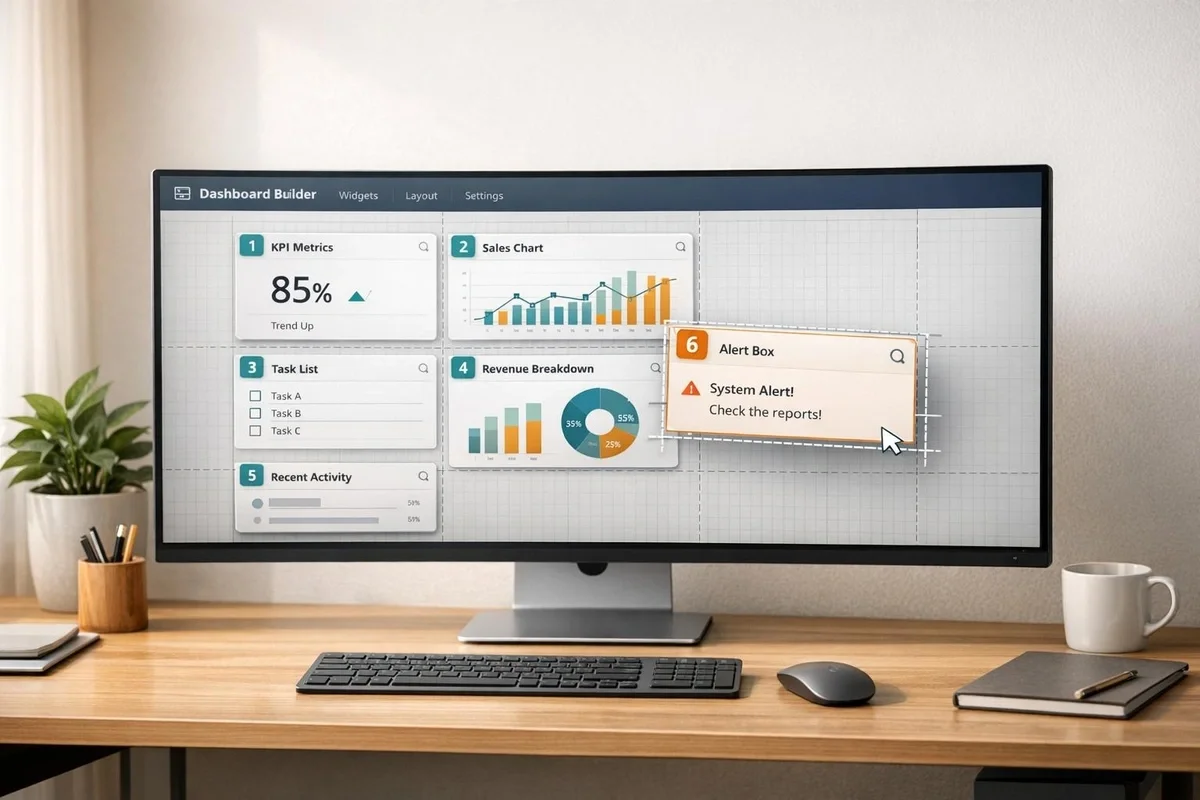
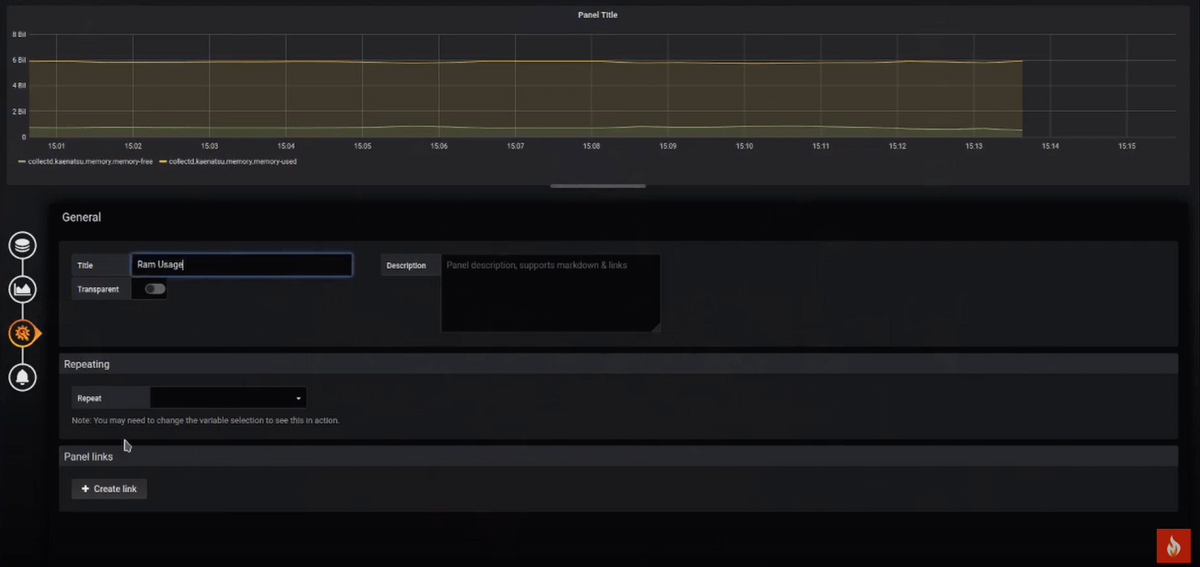
Step-by-step guide to build custom Grafana dashboards with hosted data sources: setup, panels, variables,... Continue Reading
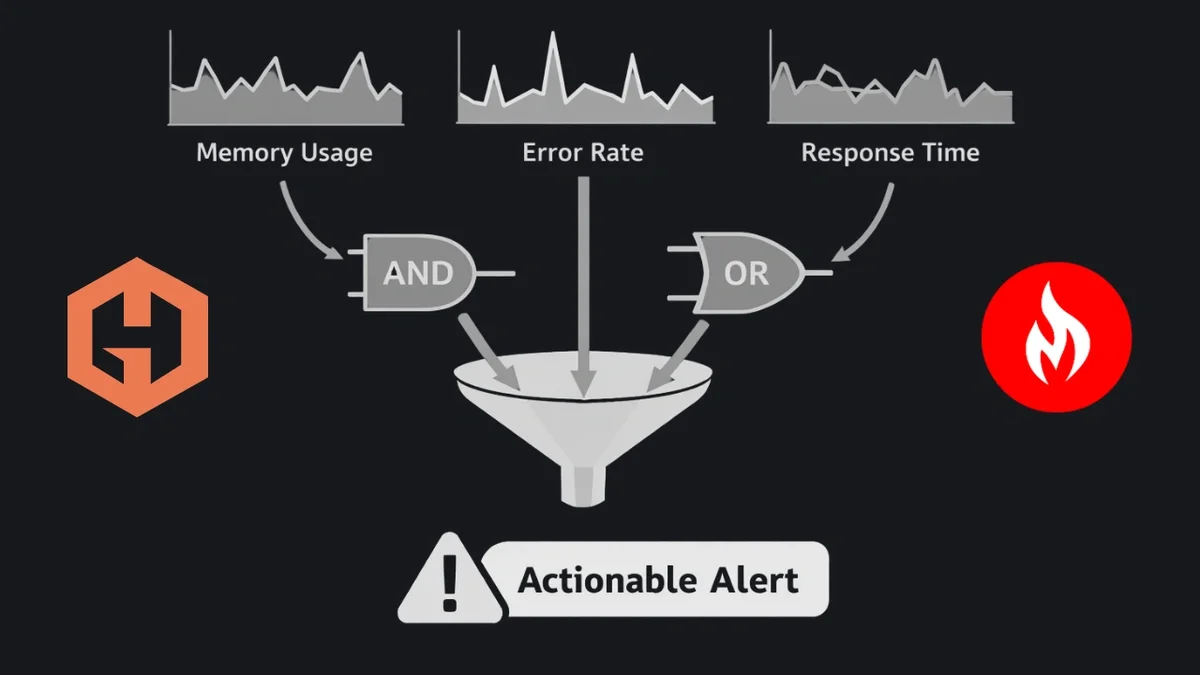
Composite alerts in Hosted Graphite help SRE teams reduce alert noise by triggering only... Continue Reading
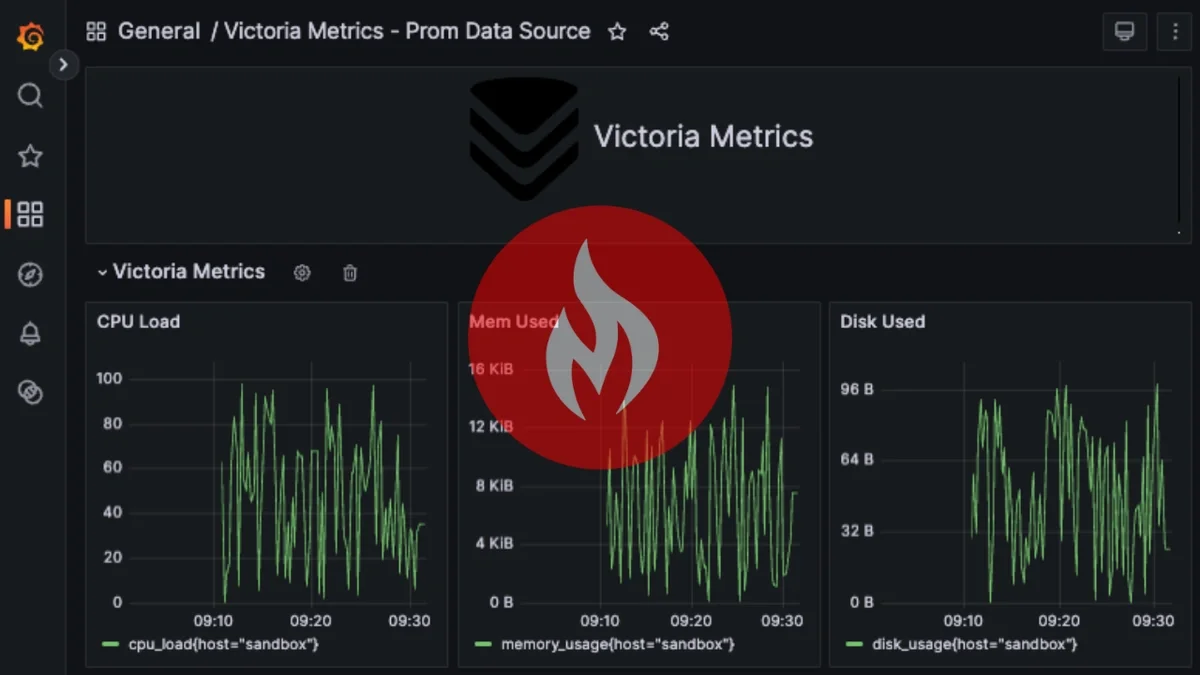
VictoriaMetrics is a powerful and flexible solution for storing and querying time-series metrics, especially... Continue Reading
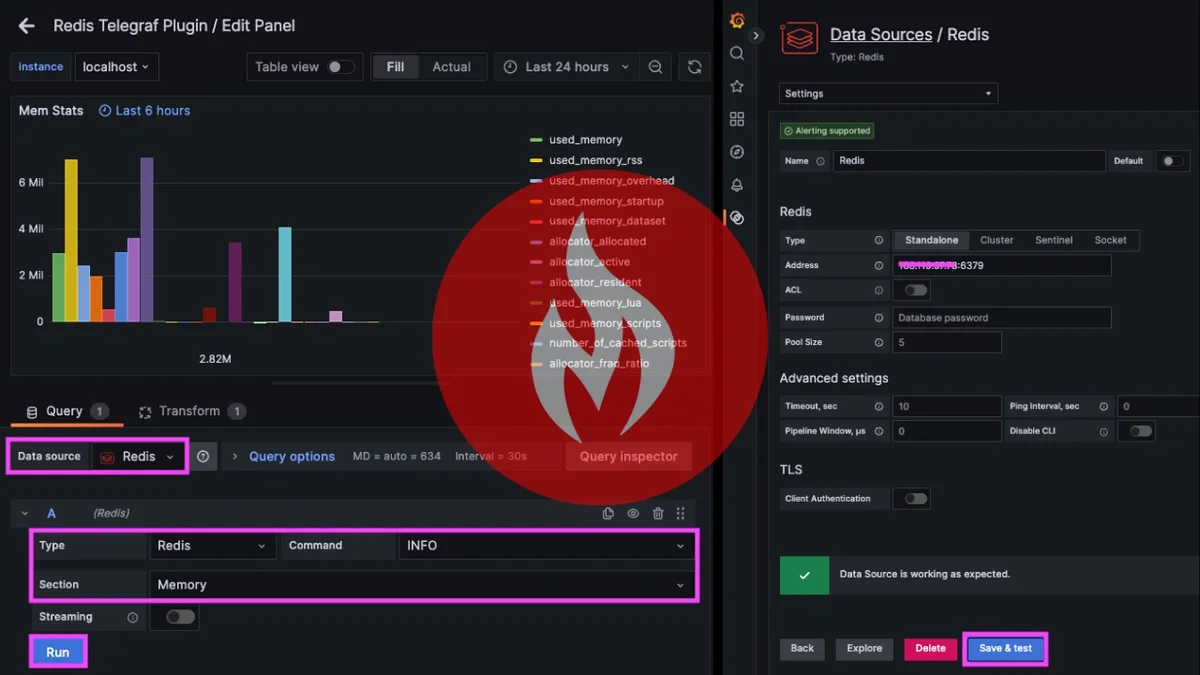
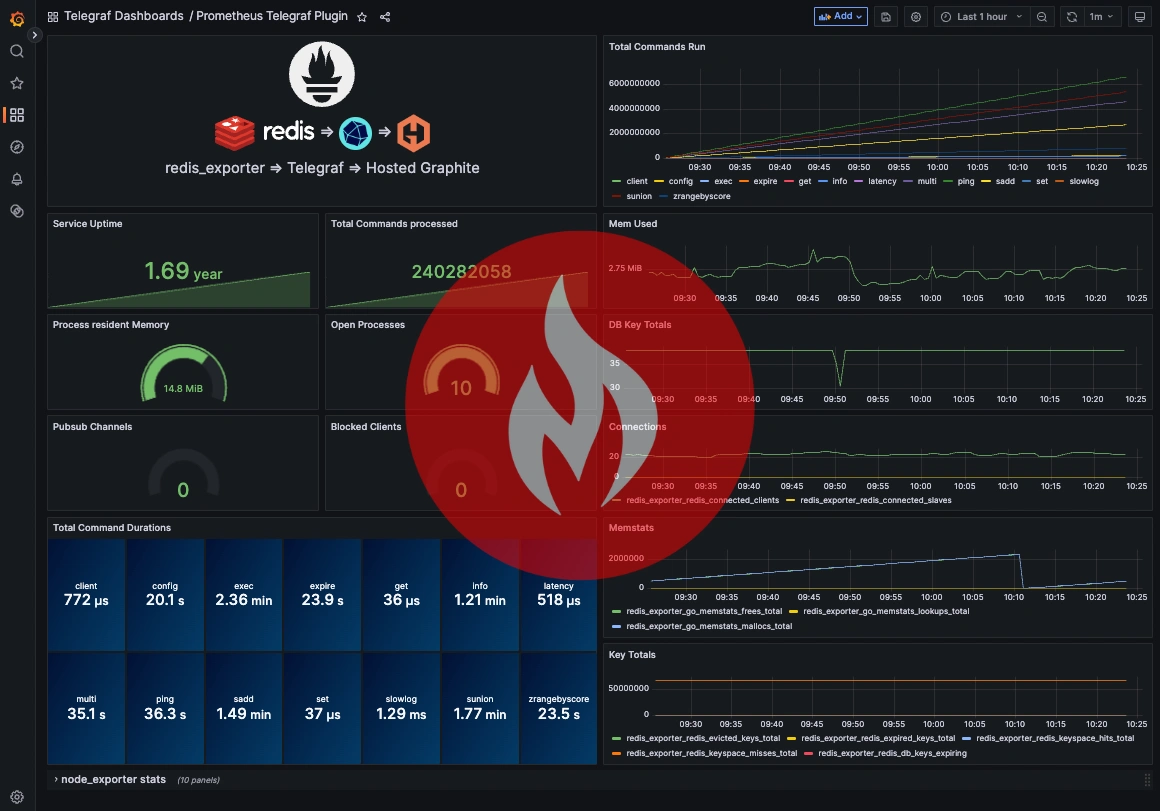
Redis provides valuable operational signals that can be easily visualized using Grafana’s Redis datasource.... Continue Reading
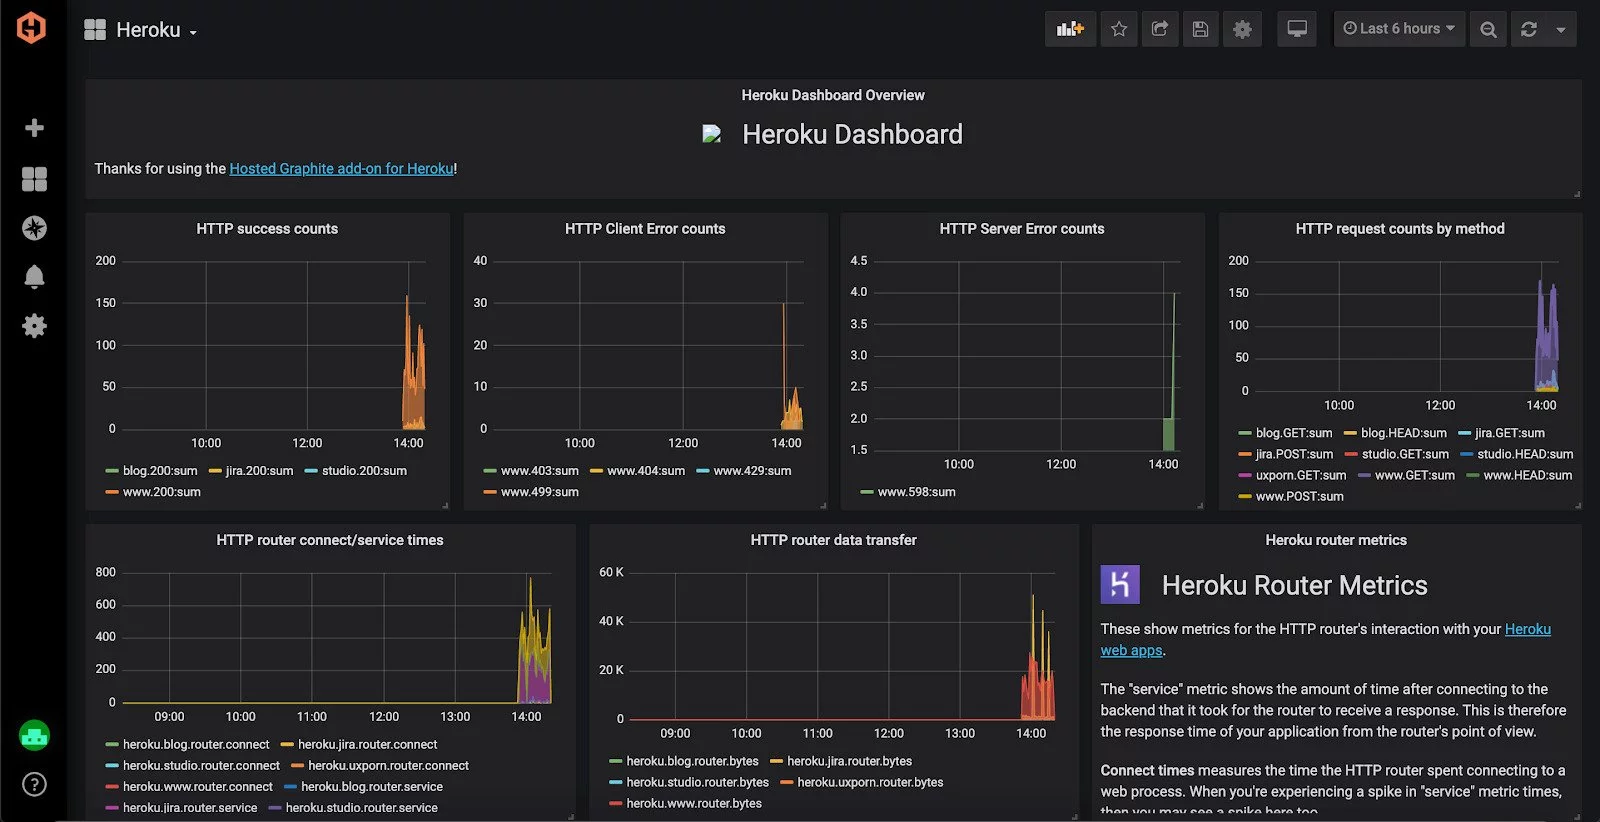
Heroku makes it easy to deploy and run applications, but keeping them healthy in... Continue Reading
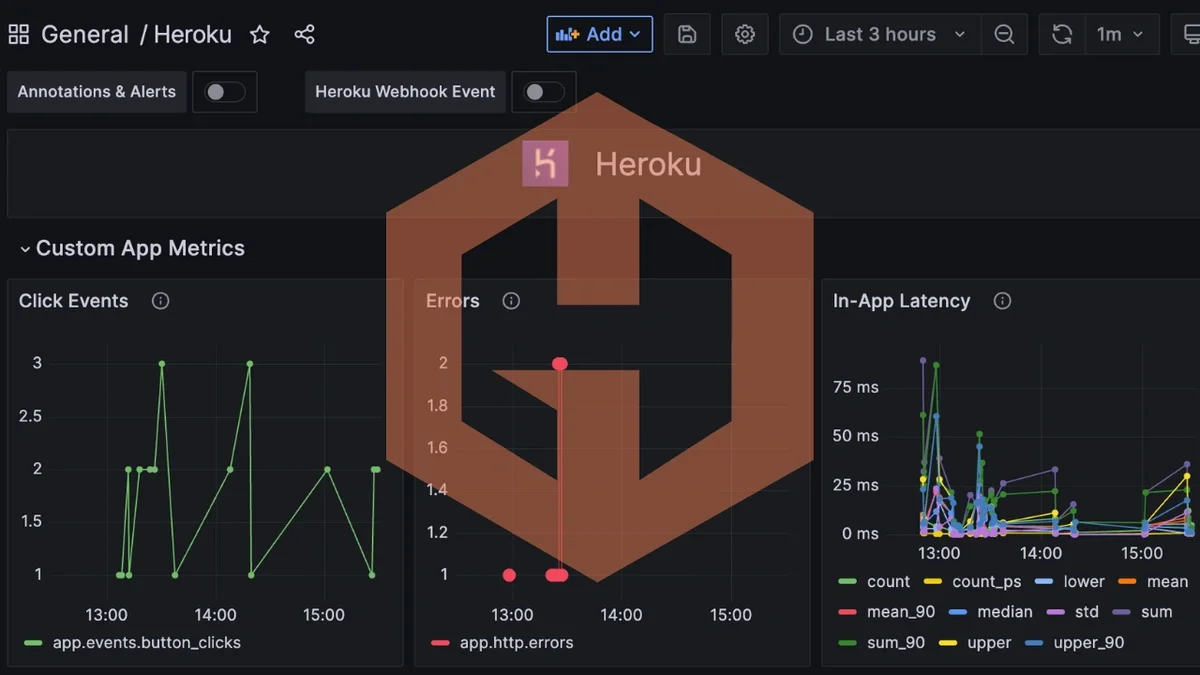
Adding custom application metrics to a Heroku app doesn’t require complex tooling or heavy... Continue Reading
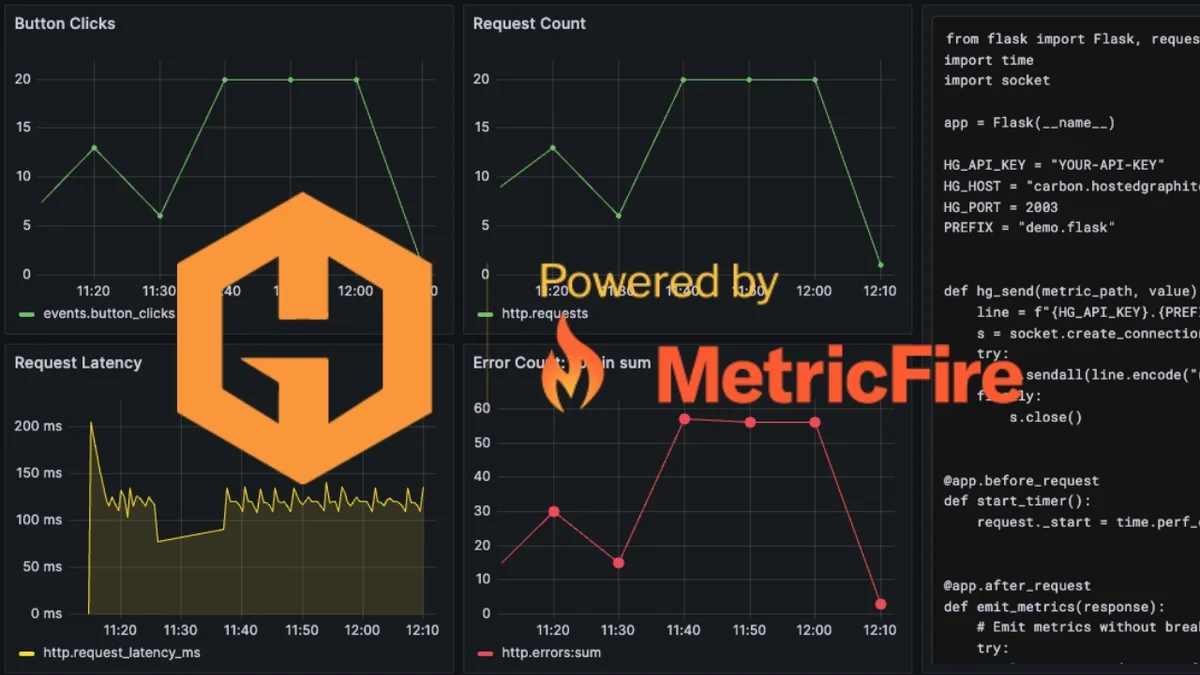
Sending custom application metrics to MetricFire doesn’t require complex tooling, agents, or heavy instrumentation.... Continue Reading
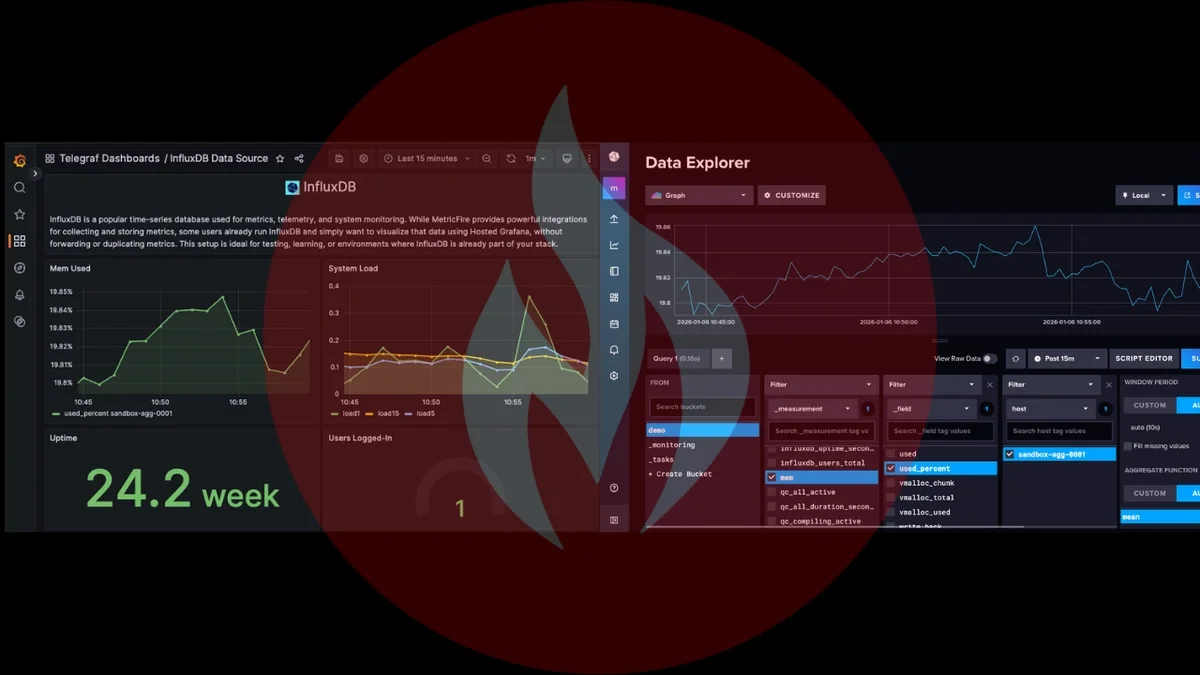
In this guide, we’ll walk through installing InfluxDB on an Ubuntu server, collecting basic... Continue Reading
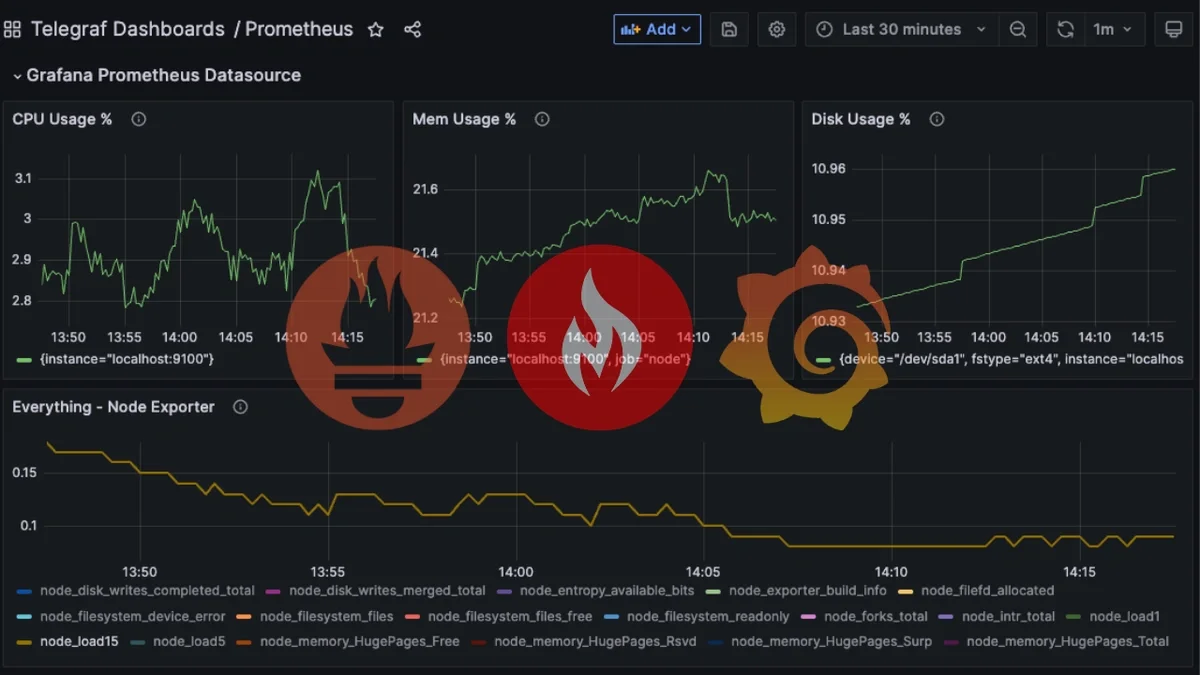
Prometheus and Node Exporter give you deep visibility into your Linux servers with almost... Continue Reading
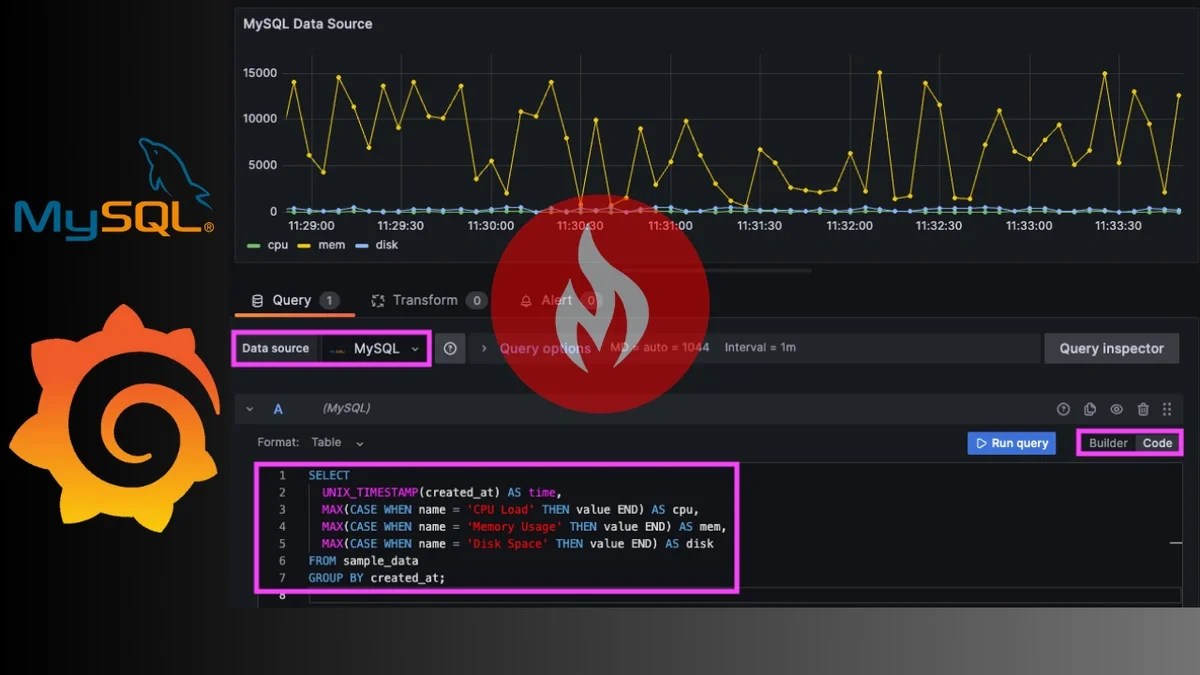
Visualizing key MySQL metrics in Grafana gives teams real-time insight into query performance, resource... Continue Reading
Level up your Heroku monitoring: key metrics, built-in tools vs add-ons, alerting tips, and... Continue Reading

In this article, we'll explore the unique monitoring needs of nonprofits and compare 5... Continue Reading
Learn container monitoring basics, key features, and the best tools for 2026. Compare options... Continue Reading
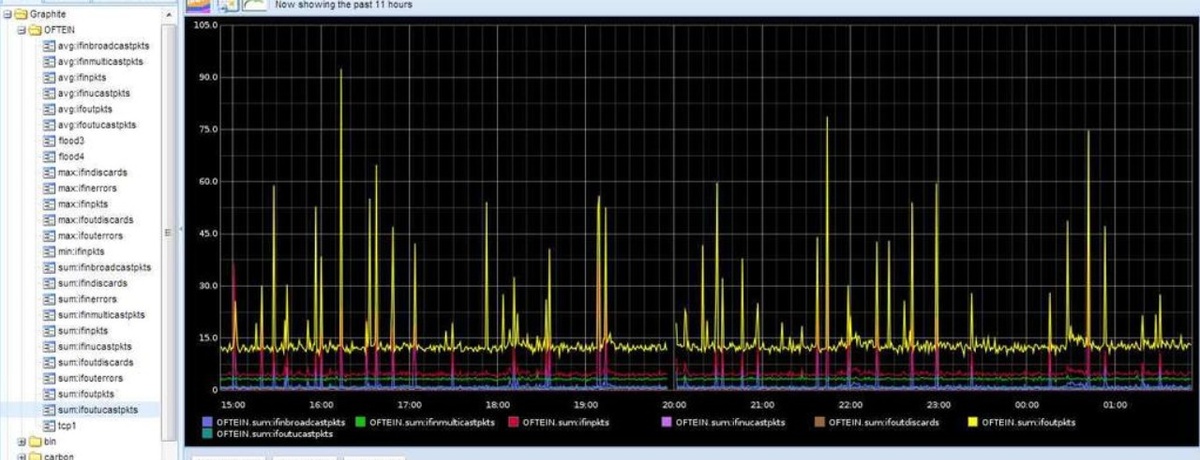
MetricFire provides the best hosted open-source Cisco switch network monitoring solution. It is the... Continue Reading

Telegraf provides a practical way to regain control of your telemetry pipeline and choose... Continue Reading
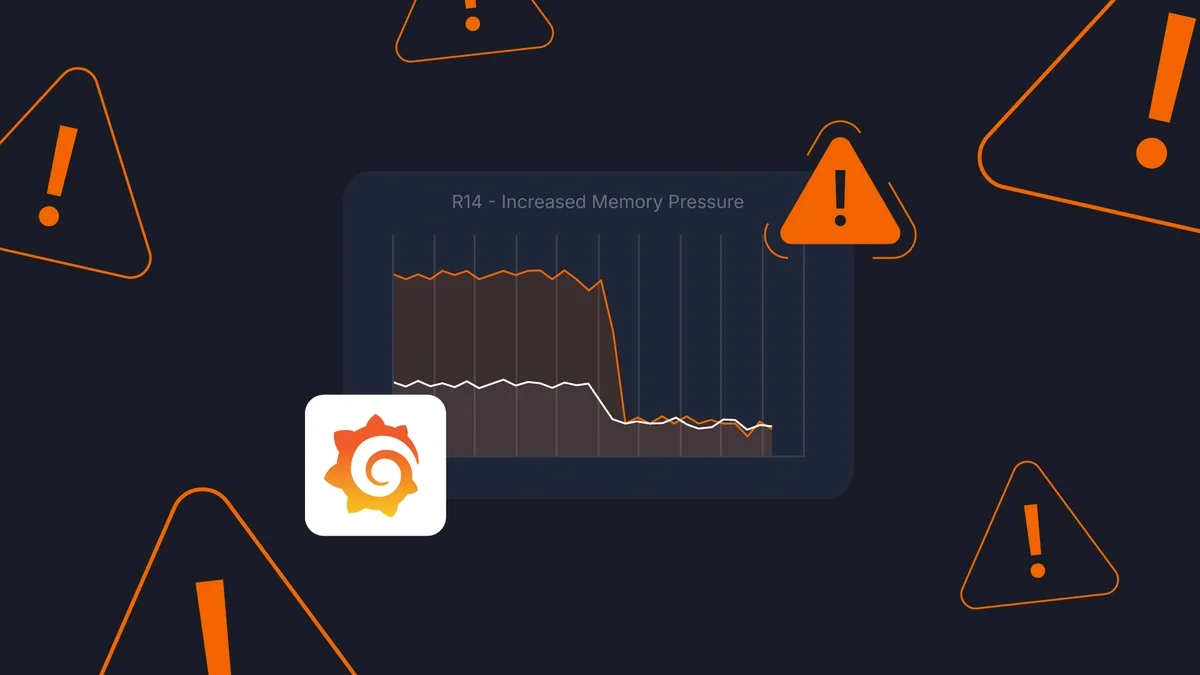
Learn how to detect and alert on Heroku R14/R15 memory errors with MetricFire to... Continue Reading
Compare the best open source dashboard tools—Grafana, Kibana, Freeboard, and more. See use cases,... Continue Reading

Track the right mobile game KPIs. From DAU/MAU and stickiness to LTV, ARPU, CPI,... Continue Reading
Fix the 502 Bad Gateway NGINX error caused by PHP-FPM issues. Learn top causes,... Continue Reading
Learn how Grafana access groups work in Hosted Graphite. Control who can view, edit,... Continue Reading

Learn how to integrate Grafana with Elasticsearch for real-time data visualization. Follow this step-by-step... Continue Reading

Visualizing Redis logs alongside metrics gives you insight into trends and root cause under... Continue Reading
Good monitoring catches problems before users do and with Promtail + Loki + LogQL,... Continue Reading

Use HAProxy logs with Loki and get key visualizations that provide a single source... Continue Reading
Set up NVIDIA DCGM monitoring fast. Learn DCGM exporter installation, key GPU metrics, Grafana... Continue Reading

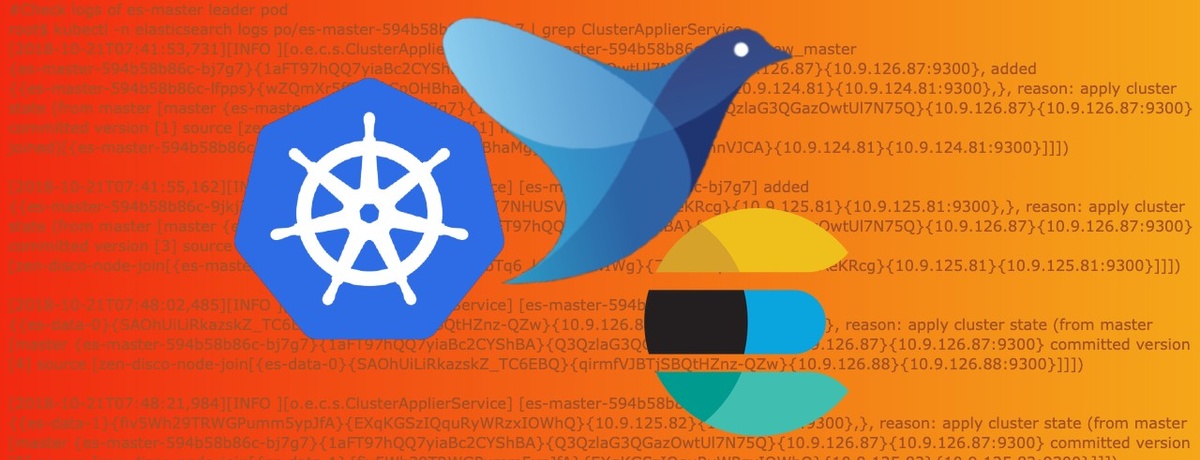
Elasticsearch is a powerful system, but it’s only as reliable as your visibility into... Continue Reading

Slow query log gives you the exact SQL behind slow downs, while metrics are... Continue Reading
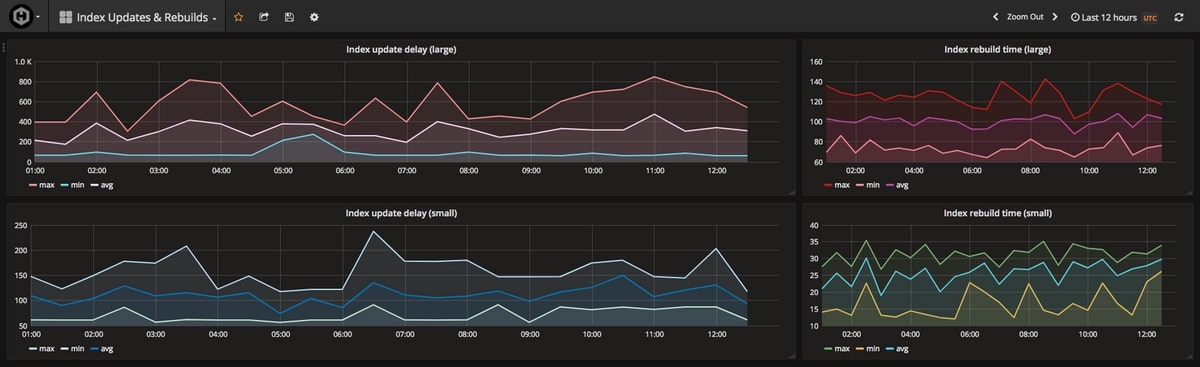
Monitoring slow queries gives you an early warning system for index gaps and query-plan... Continue Reading
Learn how to monitor Apple Silicon GPU metrics using macmon GPU and Hosted Graphite.... Continue Reading

In this guide you’ll enable slow-query logging, make the logs readable for MetricFire's Hosted... Continue Reading
Learn how to collect and visualize Nginx logs and metrics using Loki, Promtail, and... Continue Reading

In this complete observability guide, we’ll walk through enabling the MySQL slow query log,... Continue Reading

When you combine logs with metrics, you stop guessing and start knowing. Metrics highlight... Continue Reading
By combining logs and metrics in Grafana, you can troubleshoot faster, spot patterns more... Continue Reading
If you’re serious about your application, you need to be serious about your monitoring.... Continue Reading
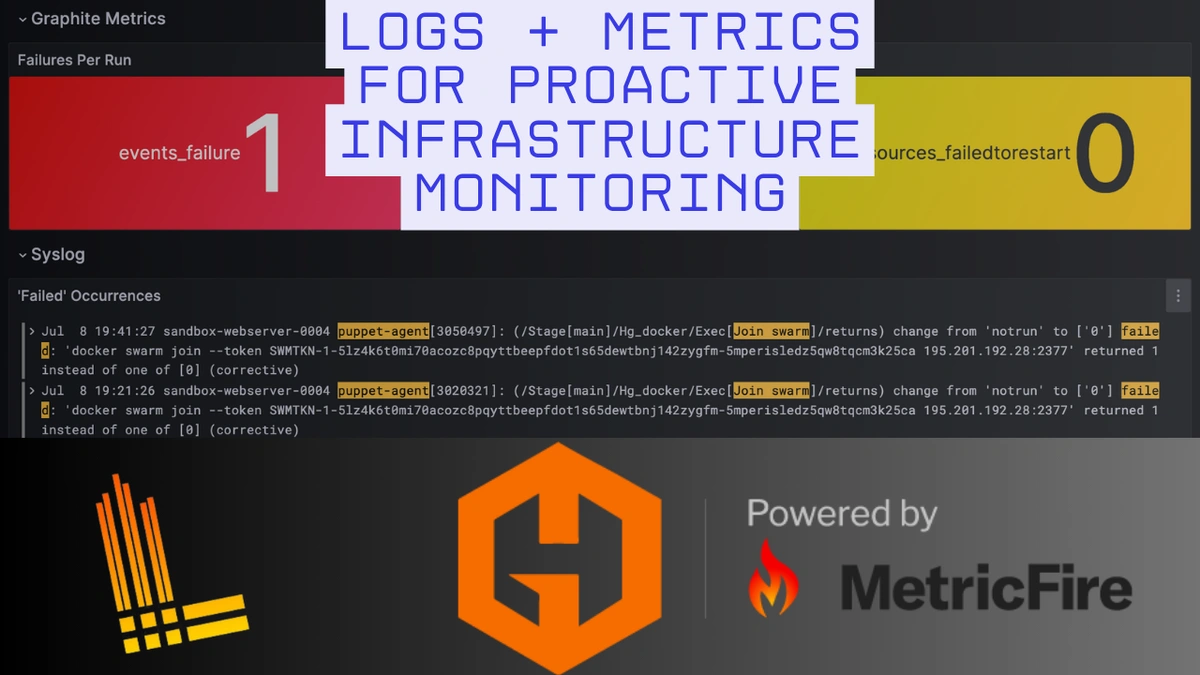
By combining logs and metrics in MetricFire's Hosted Grafana, you can troubleshoot faster, spot... Continue Reading
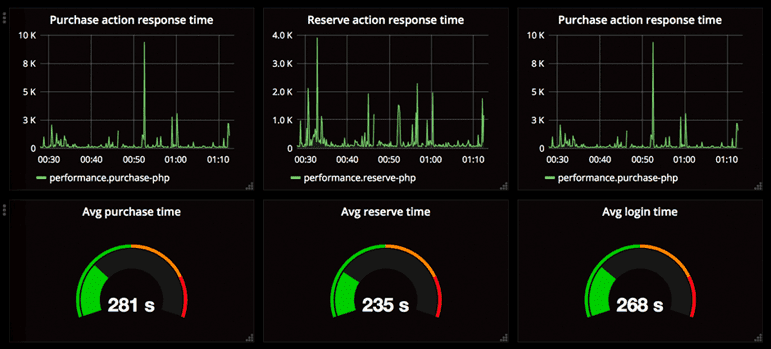
Monitor millions of microtransactions with ease Continue Reading

Monitoring your MinIO instance is a safeguard against unexpected slowdowns, storage issues, or data... Continue Reading
Podman is a great tool for developers who want a fast, secure way to... Continue Reading
Monitoring your Heroku stack helps you understand the performance of your application and infrastructure.... Continue Reading
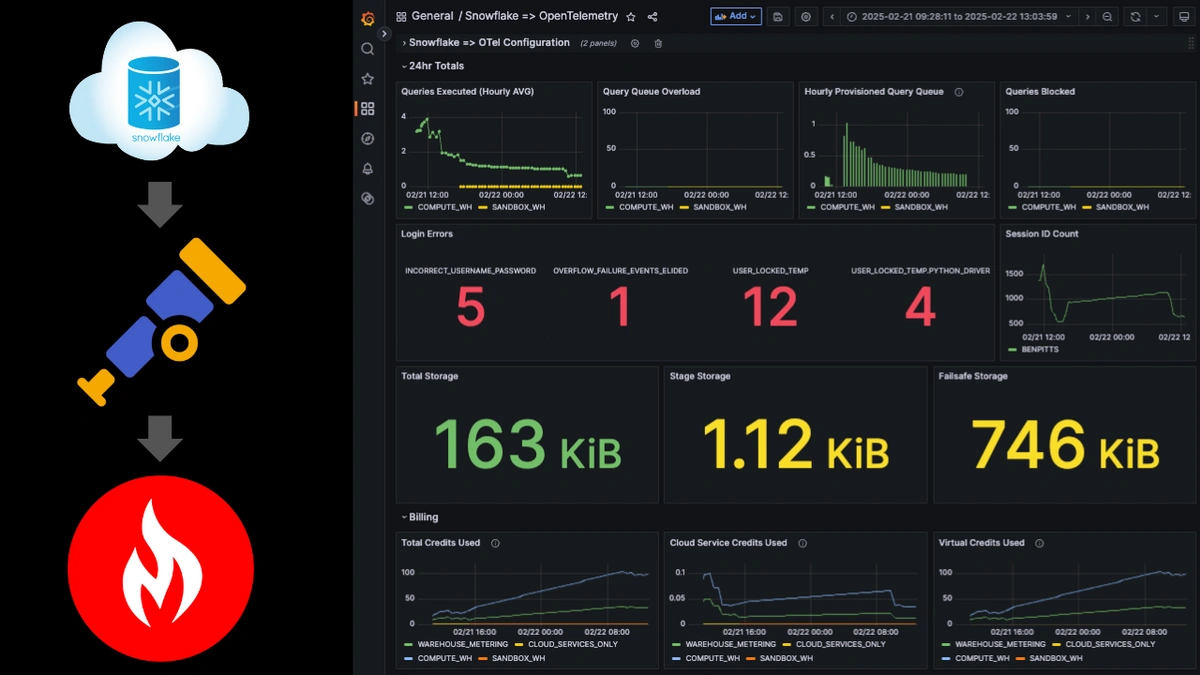
Setting up OpenTelemetry with Snowflake gives you enhanced visibility into how your data warehouse... Continue Reading
We'll cover Heroku's benefits and offer a guide on deploying apps. Heroku simplifies app... Continue Reading
This article covers some basics of Heroku applications and how one can approach metrics... Continue Reading
Wavefront was once a pioneer in the industry, before Prometheus took over and tools... Continue Reading
By integrating Flink with OpenTelemetry and a backend like Hosted Graphite by MetricFire, DevOps... Continue Reading

Discover key details about Docker and Docker Compose as well as how to deploy... Continue Reading
Use Docker to containerize an application, then run it on development environments using Docker... Continue Reading

In this guide, we'll show you how to transform some raw logs into usable... Continue Reading
Monitoring doesn't always need to be complex. In this guide, we'll show you how... Continue Reading
Protect your IoT devices from growing threats with effective firewall monitoring. Learn how to... Continue Reading
Compare 10 WiFi monitoring tools for access points. Features, use cases, and tips. Learn... Continue Reading

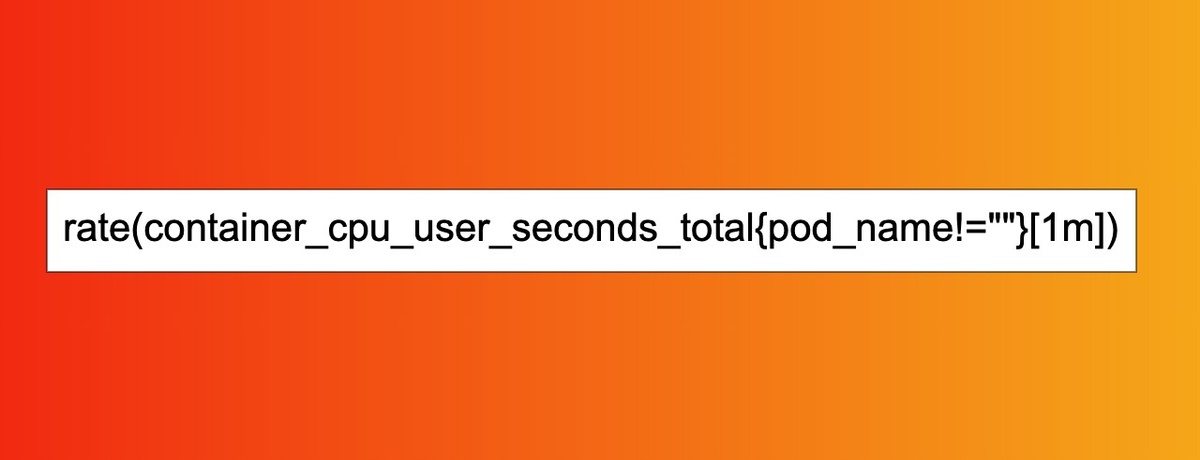
Learn how to use Prometheus's rate() function. See two example use cases for rate()... Continue Reading
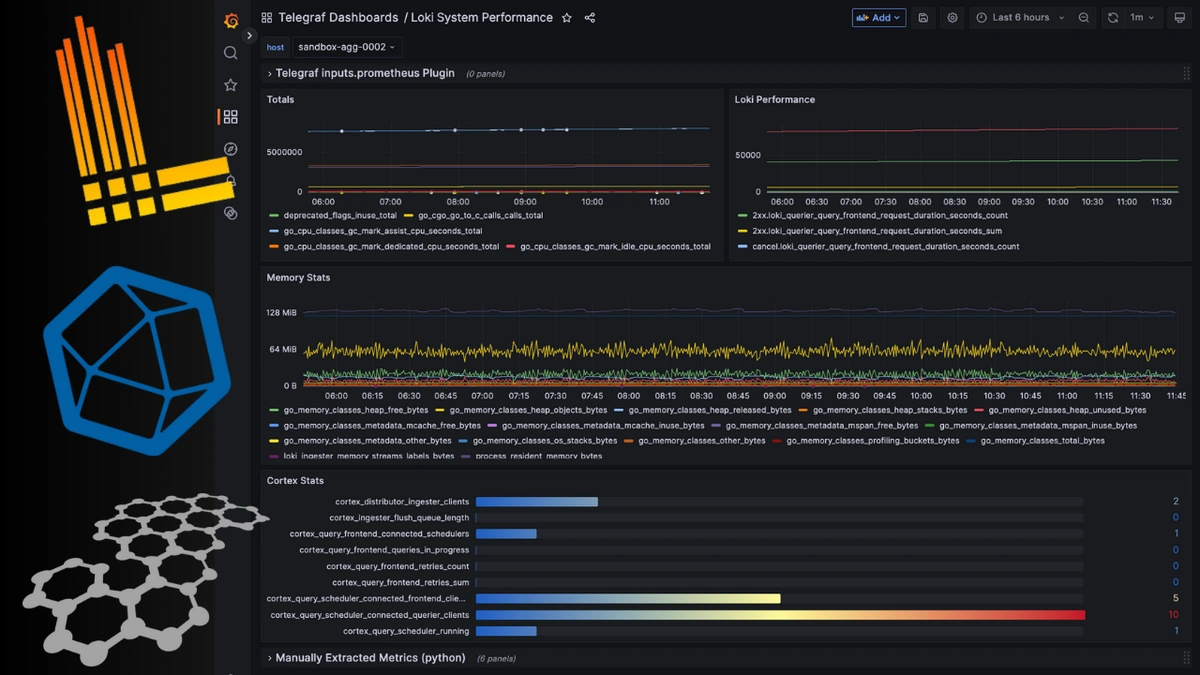
By combining Loki’s native /metrics endpoint with Telegraf’s Prometheus input plugin, you can build... Continue Reading

Tracking the International Space Station (ISS) as it orbits Earth is not just a... Continue Reading
At MetricFire, we’re committed to making infrastructure monitoring as seamless and accessible as possible.... Continue Reading
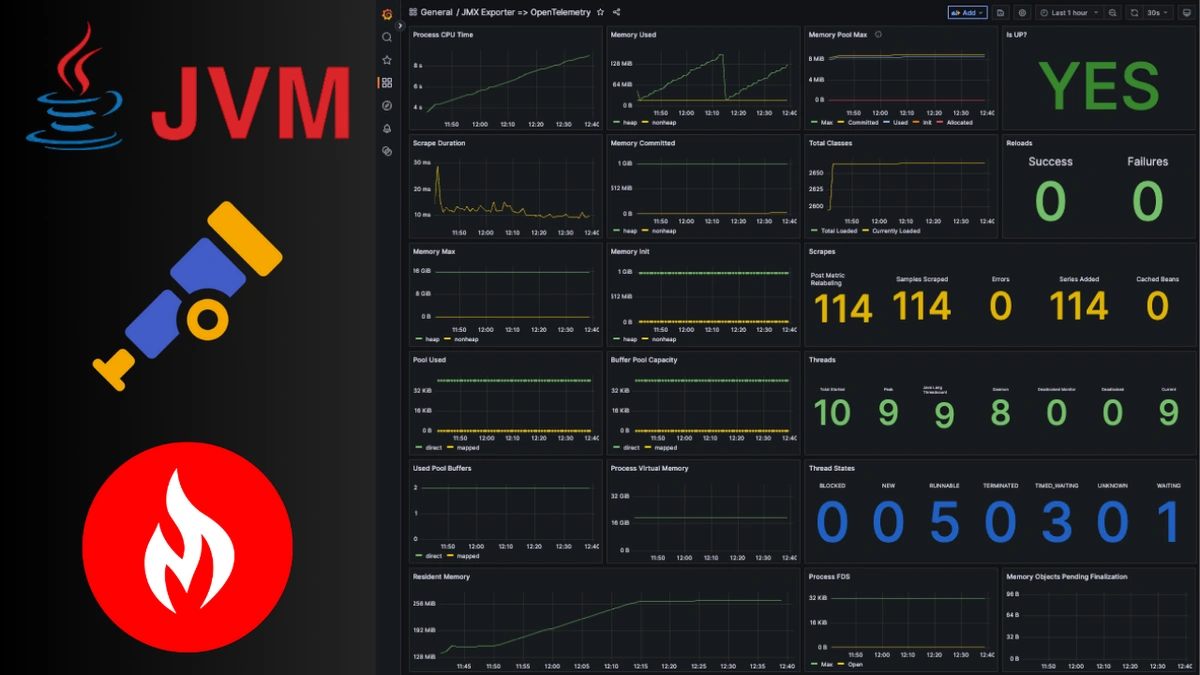
When you're running a Java application, the JVM is doing a ton of work... Continue Reading
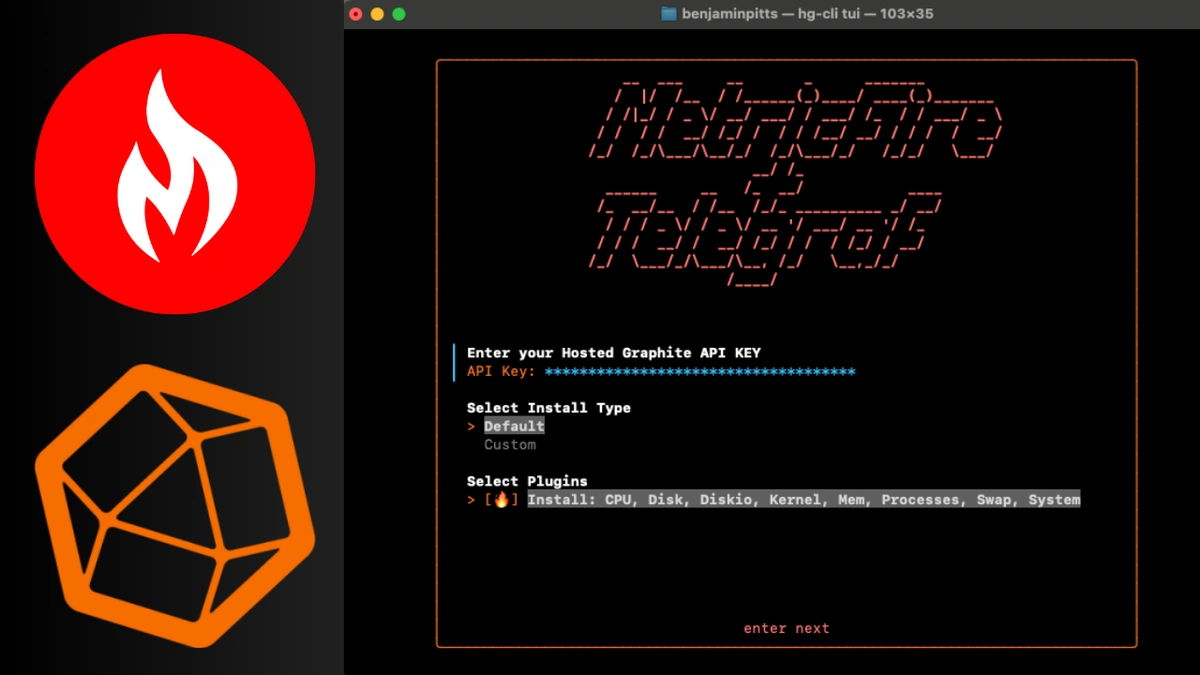
MetricFire's HG-CLI is a powerful command-line tool for fast, easy server monitoring. It automates... Continue Reading
When you're running a Java application, the JVM is doing a ton of work... Continue Reading
At MetricFire, we love talking with engineers about their tech stacks, SRE challenges, and... Continue Reading
Monitoring your Docker environment is critical for ensuring optimal performance, security, and reliability of... Continue Reading
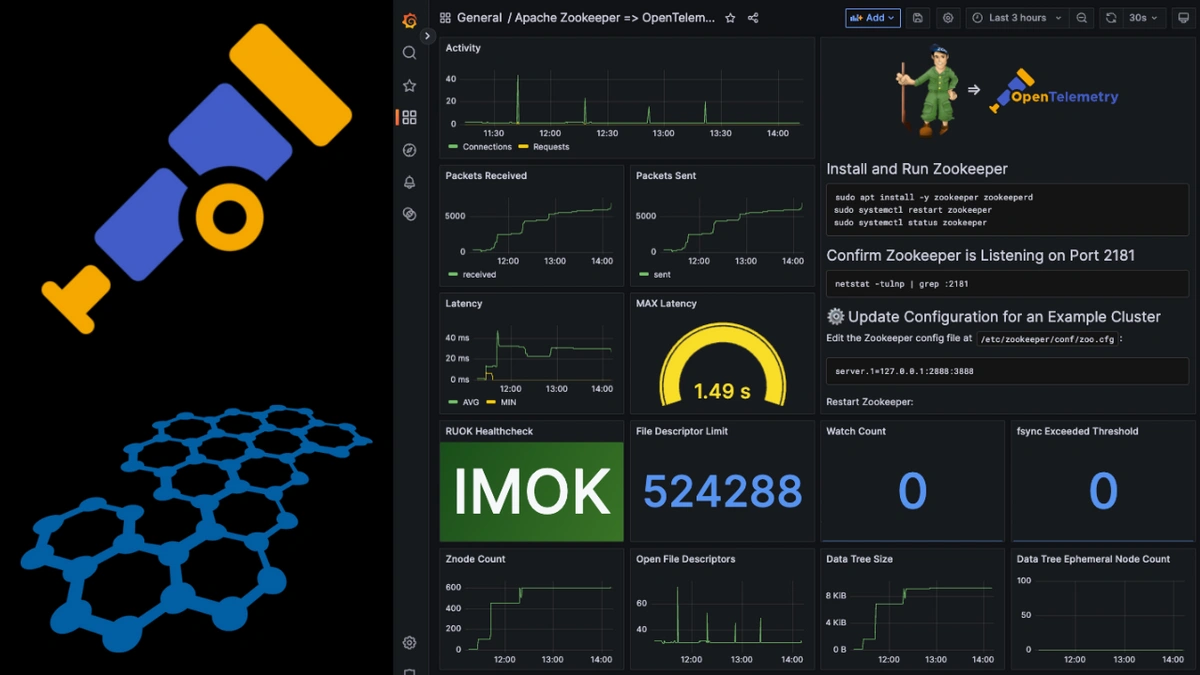
Since so many critical services can depend on Zookeeper, monitoring it is a must.... Continue Reading
Monitoring is integral to understanding what is happening in your infrastructure, applications, or other... Continue Reading
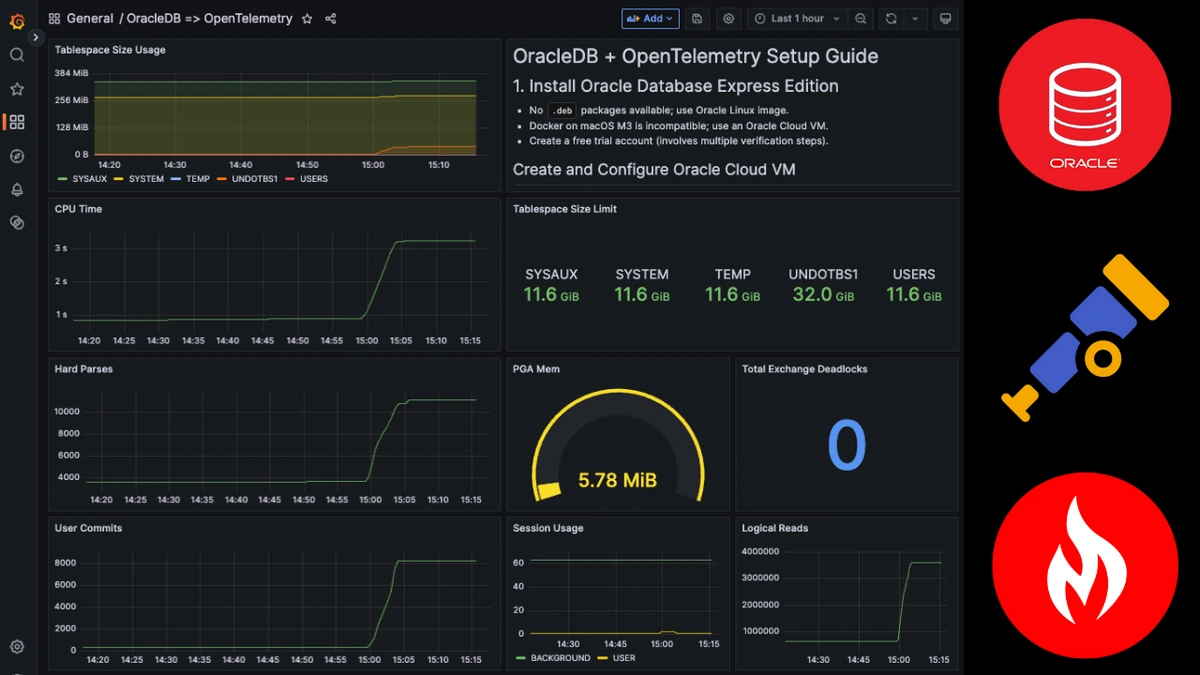
Tech businesses choose OracleDB for its powerful querying, reliability, and ability to handle massive... Continue Reading
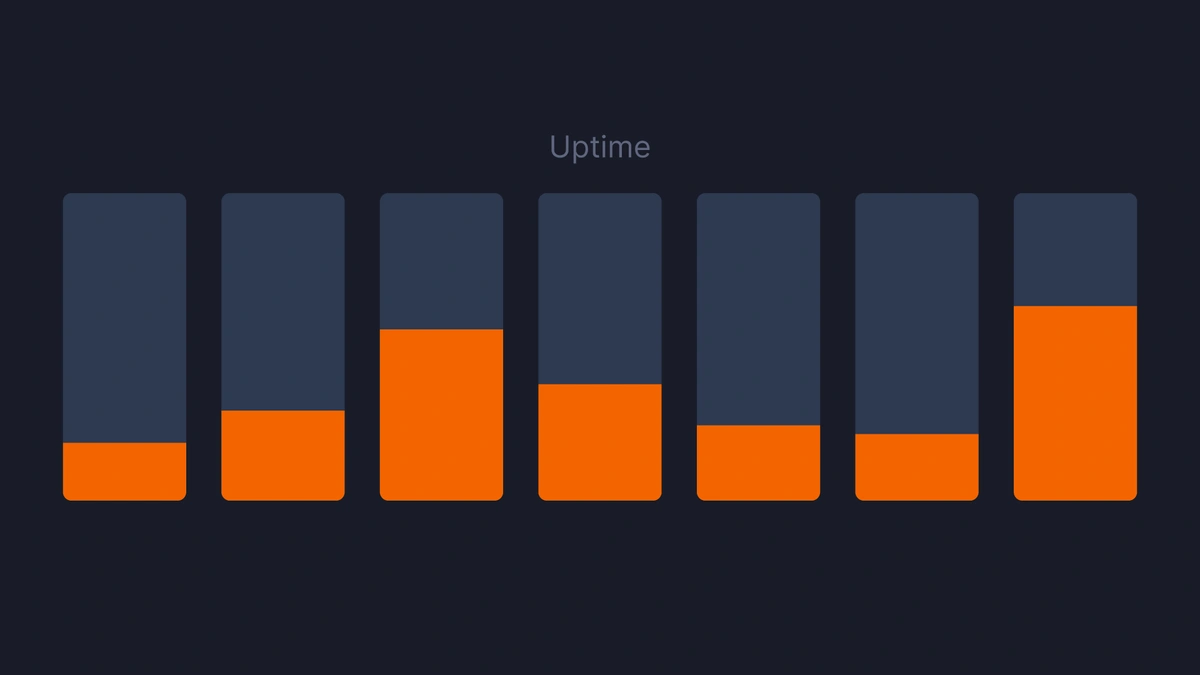
Server uptime is critical for maintaining business operations and user satisfaction. This article provides... Continue Reading
We are happy to announce our latest project at MetricFire: a brand-new CLI tool!... Continue Reading
Aerospike is a blazing-fast database built for high-throughput, low-latency workloads. But even the fastest... Continue Reading
Recently, we sat down with our developer, JJ, to discuss his thoughts on metrics,... Continue Reading

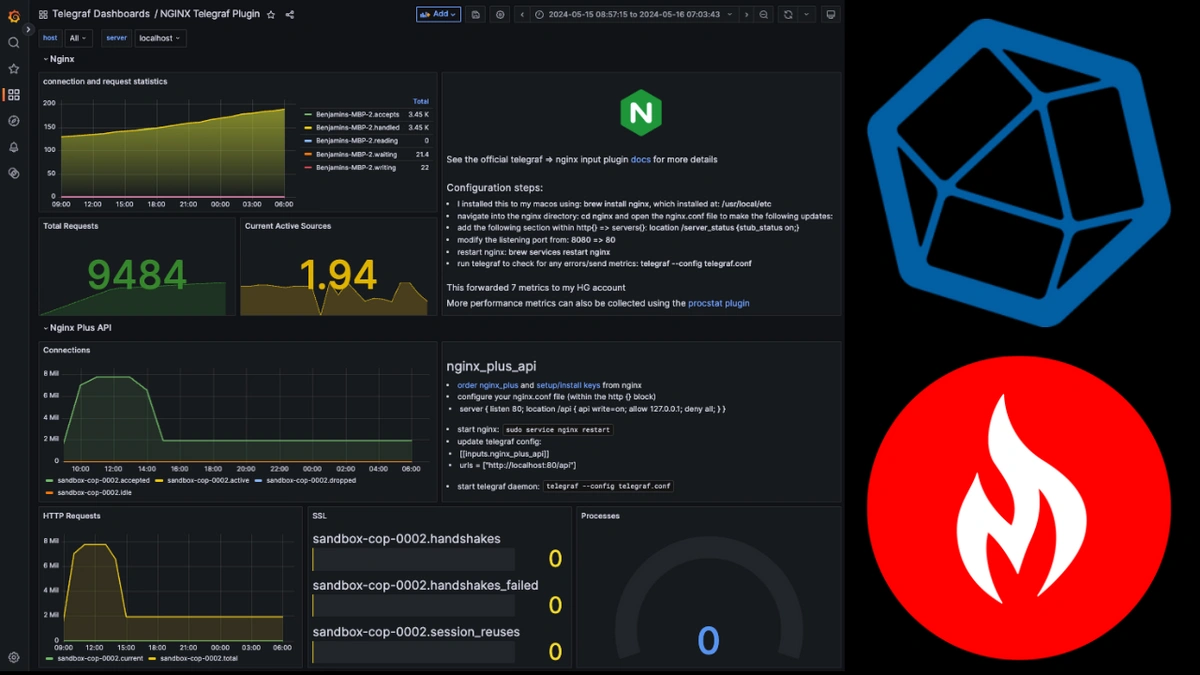
NGINX is a fast, lightweight web server and reverse proxy that handles high traffic... Continue Reading
Keeping an eye on NGINX helps you catch issues early, optimize performance, and keep... Continue Reading
Using OpenTelemetry Contrib as an agent makes it easy to collect and forward system... Continue Reading
Graphite provides an efficient system for server monitoring. Server monitoring helps safeguard against server... Continue Reading
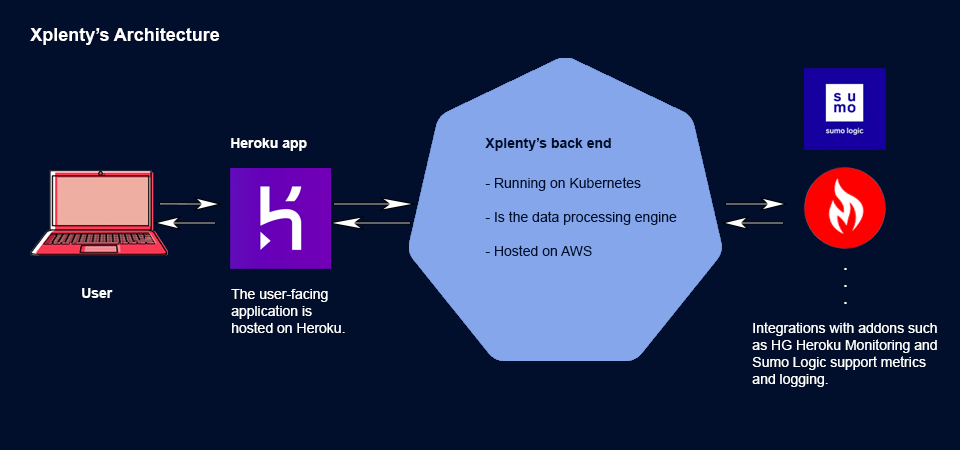
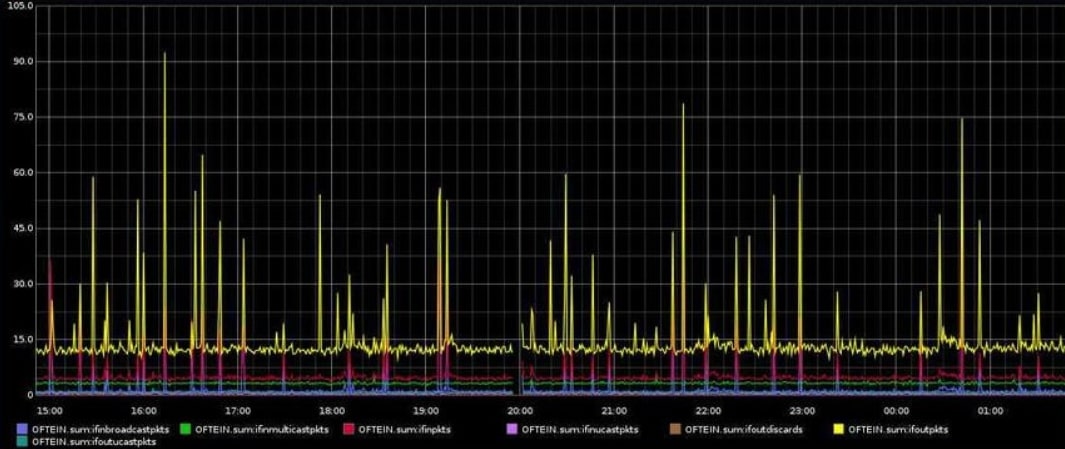
Adding Hosted Graphite gives you a real-time, interactive view of your Firehose performance metrics... Continue Reading
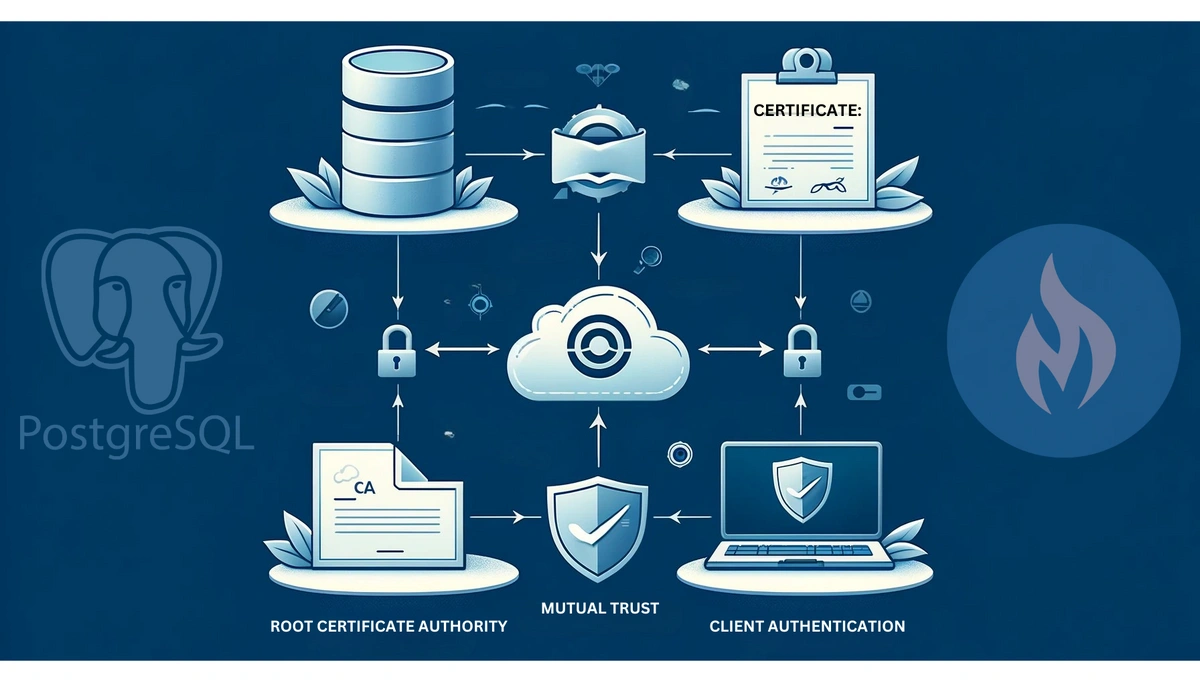
This guide walks you through setting up SSL encryption for PostgreSQL, generating self-signed certificates,... Continue Reading

Charlie von Metzradt, co founder of Hosted Graphite wrote this blog about how the... Continue Reading
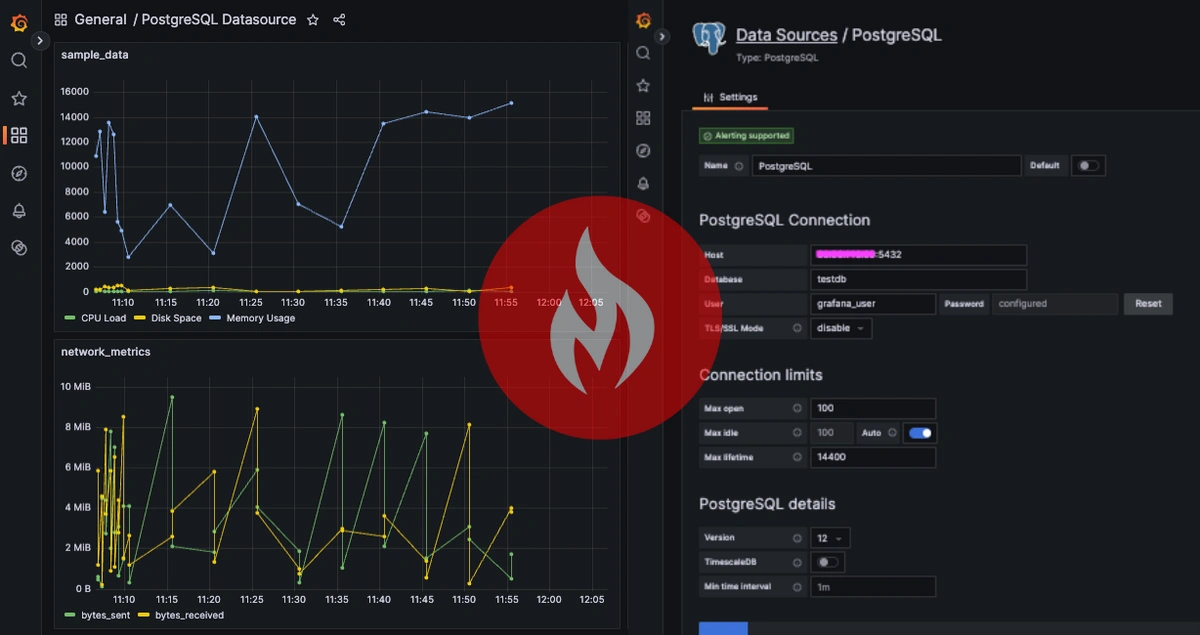
This guide covers installing PostgreSQL, allowing remote connections, and configuring Grafana to visualize live... Continue Reading

In this series, we will guide you through the most crucial container networking concepts.... Continue Reading

Welcome to the latest changelog blog post, highlighting recent updates and improvements to our... Continue Reading
Compare Graphite Web UI to Grafana, and take a look at other Dashboarding options... Continue Reading

Learn to use Terraform and create an infrastructure template for GKE clusters, then we'll... Continue Reading

Get to know the different types and levels of Docker Networking and how to... Continue Reading

See how MetricFire can display annotations from Sentry directly in the Grafana graphs. Continue Reading

Learn the most crucial container networking concepts. Get a good understanding of how to... Continue Reading

データ駆動型の意思決定とシステム監視の世界では、Grafana と New Relic の2つが優れたソリューションとして際立っています。オープンソースの視覚化ツールである Grafana は、統合されたダッシュボードを通じてデータの統合と解釈をシンプルにし、対する New Relic One には、ログ、メトリック、トレース、アプリケーション監視を統合した総合的な可観測性プラットフォームがあります。 Continue Reading
EKS is a managed Kubernetes service ideal for large clusters of nodes running heavy... Continue Reading
A whole industry of cloud providers has sprung up to offer management of the... Continue Reading
Overview Squirrels LLC is a privately owned software development company that is making strides... Continue Reading

The team at MetricFire is taking a moment to express gratitude to our readers... Continue Reading
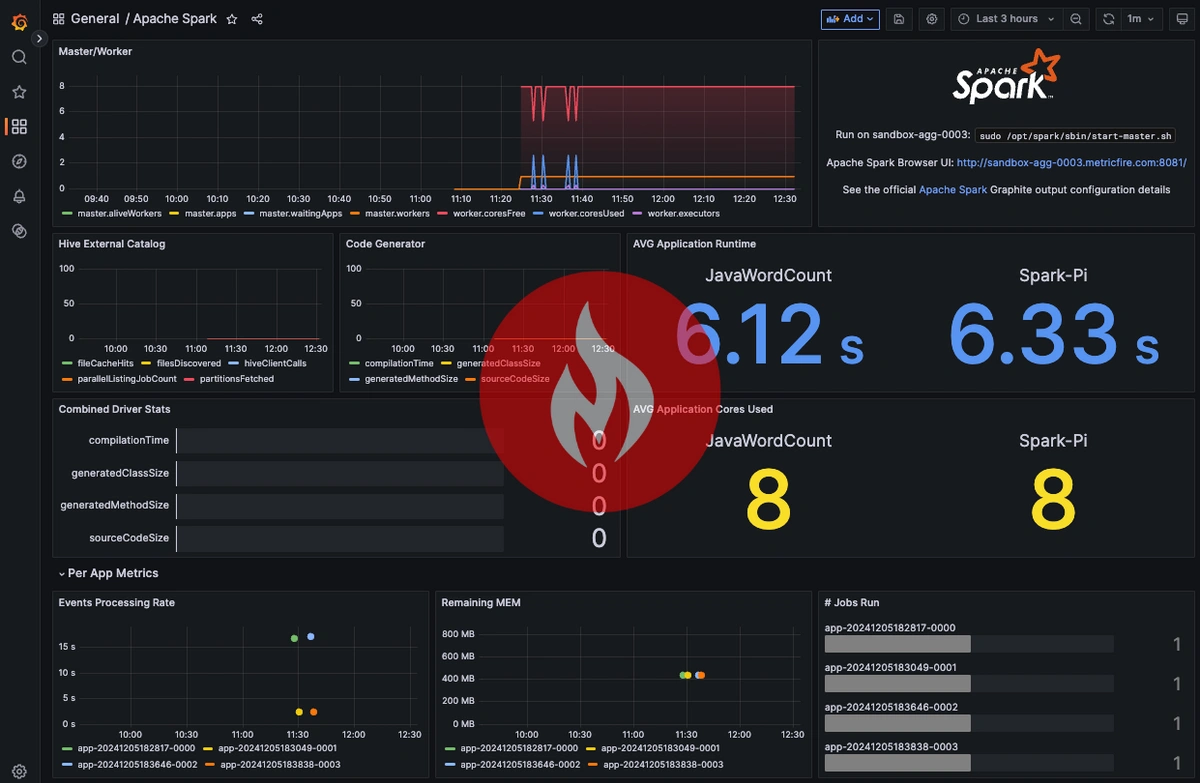
Monitoring Spark metrics is crucial because it provides visibility into how your cluster and... Continue Reading
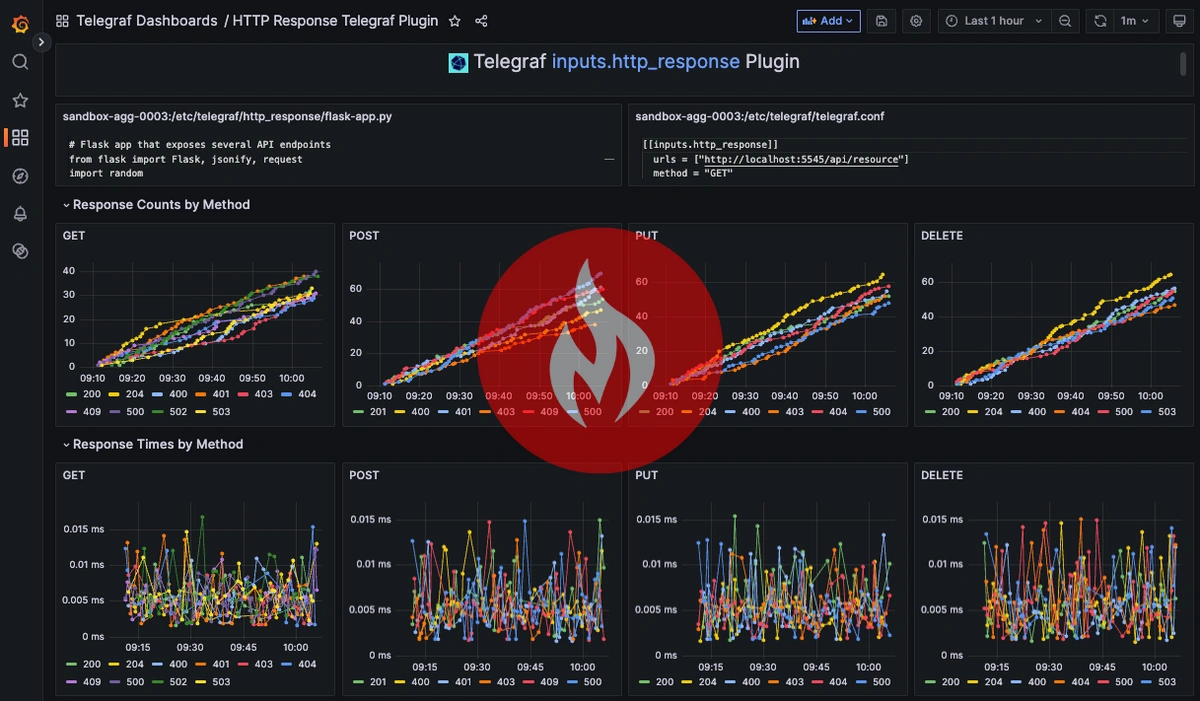
Monitoring the health of your API endpoints is crucial to keeping your applications running... Continue Reading
Explore detailed insights on how to effectively monitor your DigitalOcean environment using Hosted Graphite... Continue Reading
Compare Graphite and Splunk on pricing, market position and core strengths. Continue Reading
Install collectd. Send metrics to MetricFire. Display those metrics to MetricFire's Grafana dashboard. Continue Reading
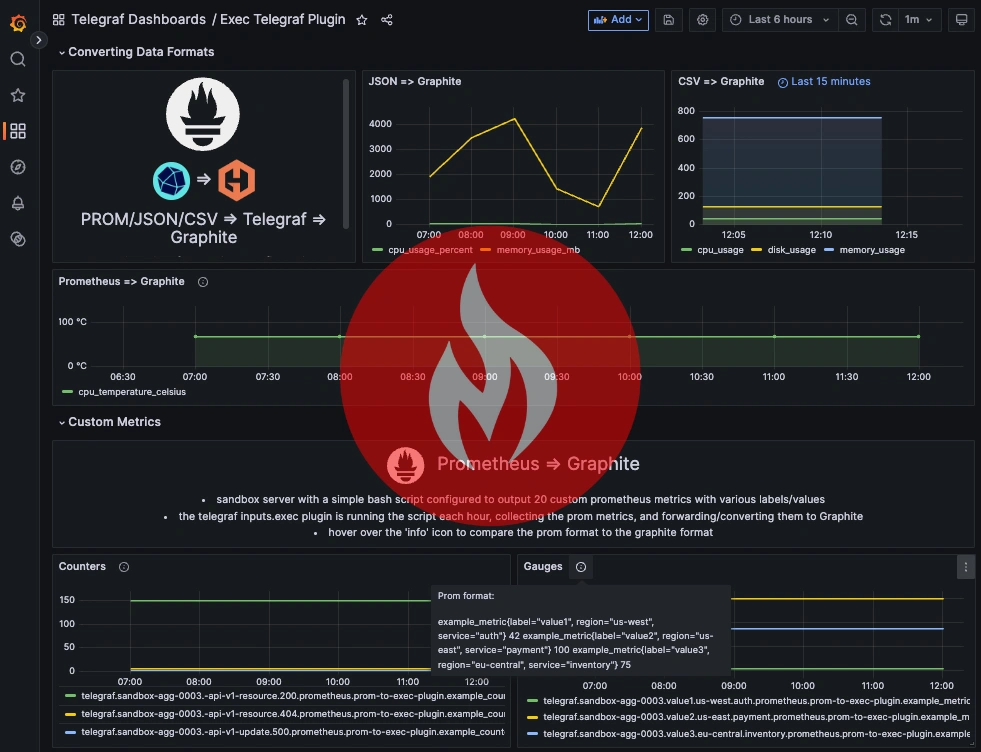
Streamlining your data into a single format for infrastructure monitoring makes it easier to... Continue Reading
Monitoring Prometheus metrics as Graphite metrics simplifies metric organization, offering a straightforward, hierarchical naming... Continue Reading
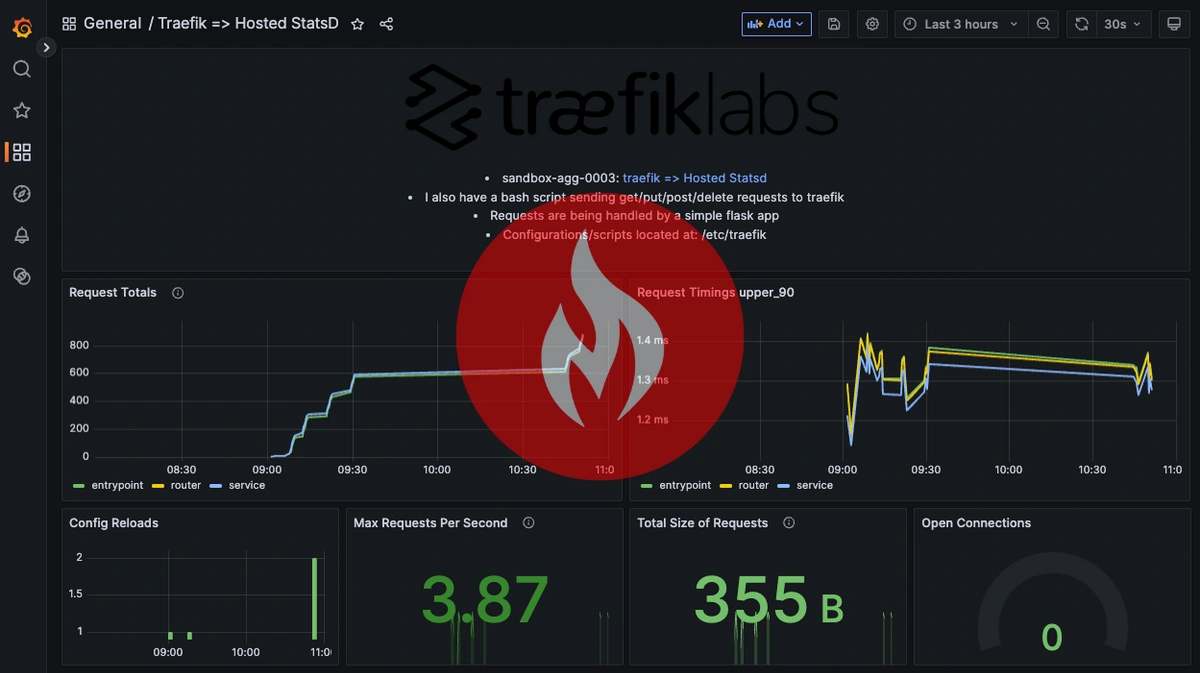
Monitoring and alerting on your Traefik statistics is crucial for keeping your SaaS platform... Continue Reading

Use MetricFire as your network monitoring tool in 2020. Cost effective and built on... Continue Reading
Compare the top Cisco network monitoring tools for 2025. Features, SNMP support, dashboards, and... Continue Reading
You can get 9x the value for 1x the cost by using MetricFire's Data... Continue Reading
This article covers some common monitoring use cases for financial companies and how you... Continue Reading
This blog will explain how gaming companies rely on monitoring and explore many widespread... Continue Reading
This blog covers typical monitoring use cases for ecommerce businesses. We offer real examples... Continue Reading
Welcome to the latest changelog blog post, highlighting recent updates and improvements to our... Continue Reading
Setting up device management monitoring is easy when you use MetricFire. MetricFire integrates with... Continue Reading

This article will explore them and show you how to start monitoring your organization... Continue Reading
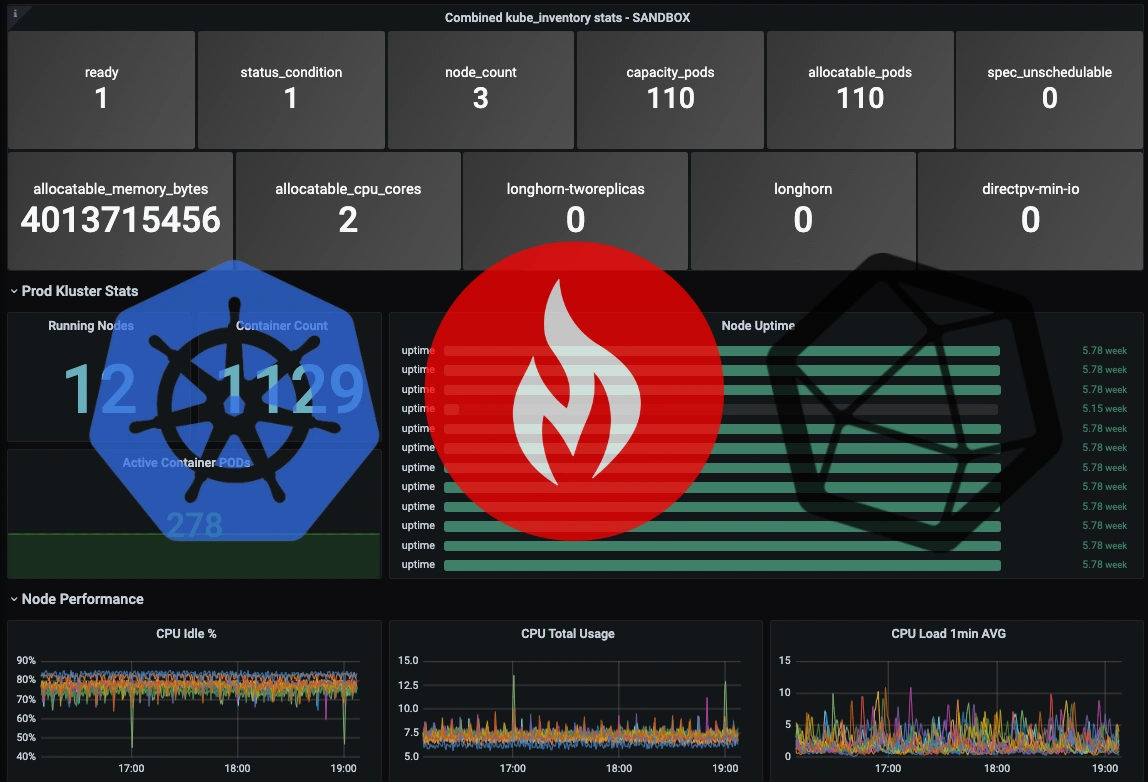
By integrating inventory stats with your other K8 performance metrics, you can better correlate... Continue Reading
This article compares Graphite and Prometheus for K8s monitoring. Graphite has simpler metric naming... Continue Reading
Welcome to the latest changelog blog post of February, where we highlight the recent... Continue Reading
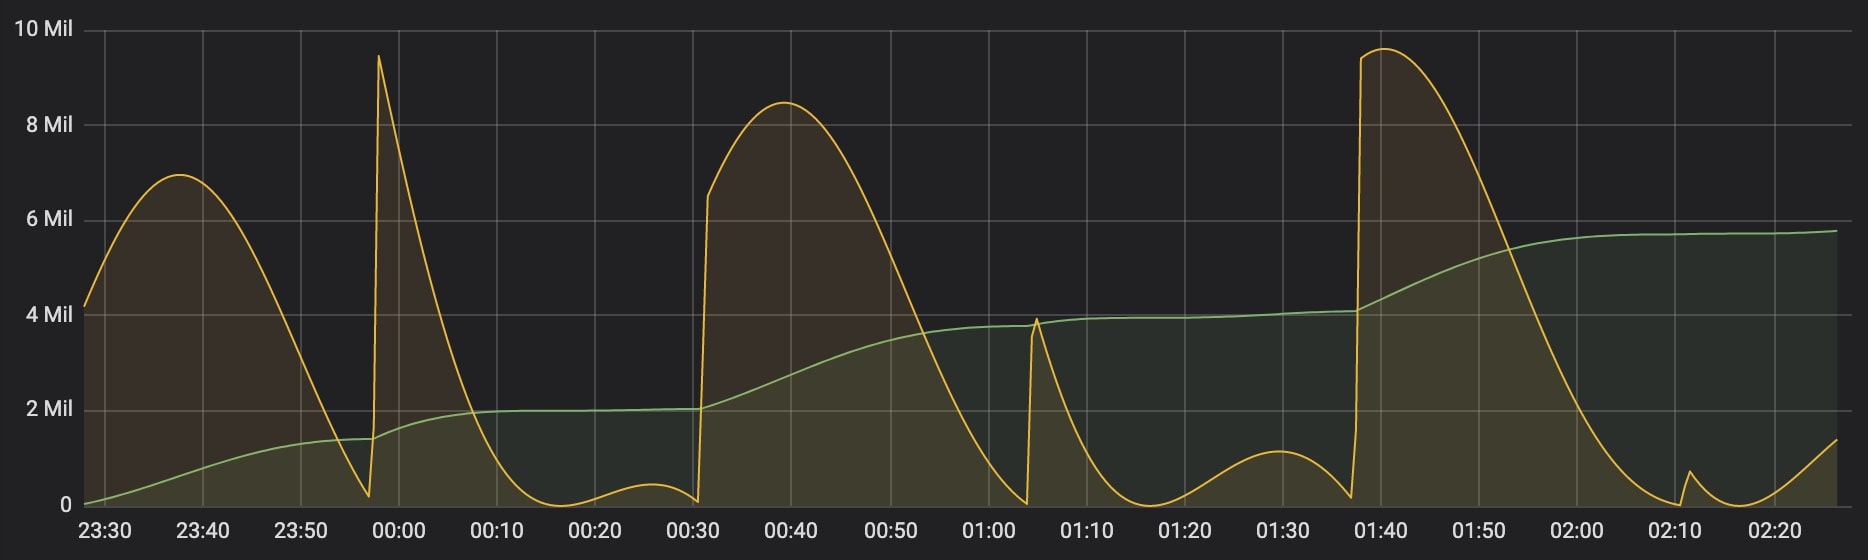
In this article, we will examine Kubernetes metrics every team should monitor and how... Continue Reading

Nagios is an open-source monitoring system used to track the performance and health of... Continue Reading
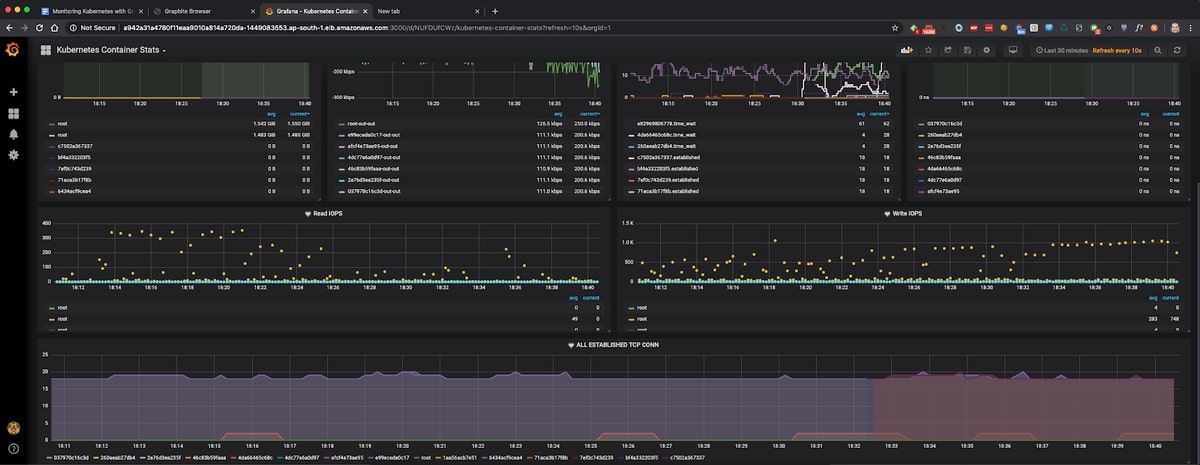
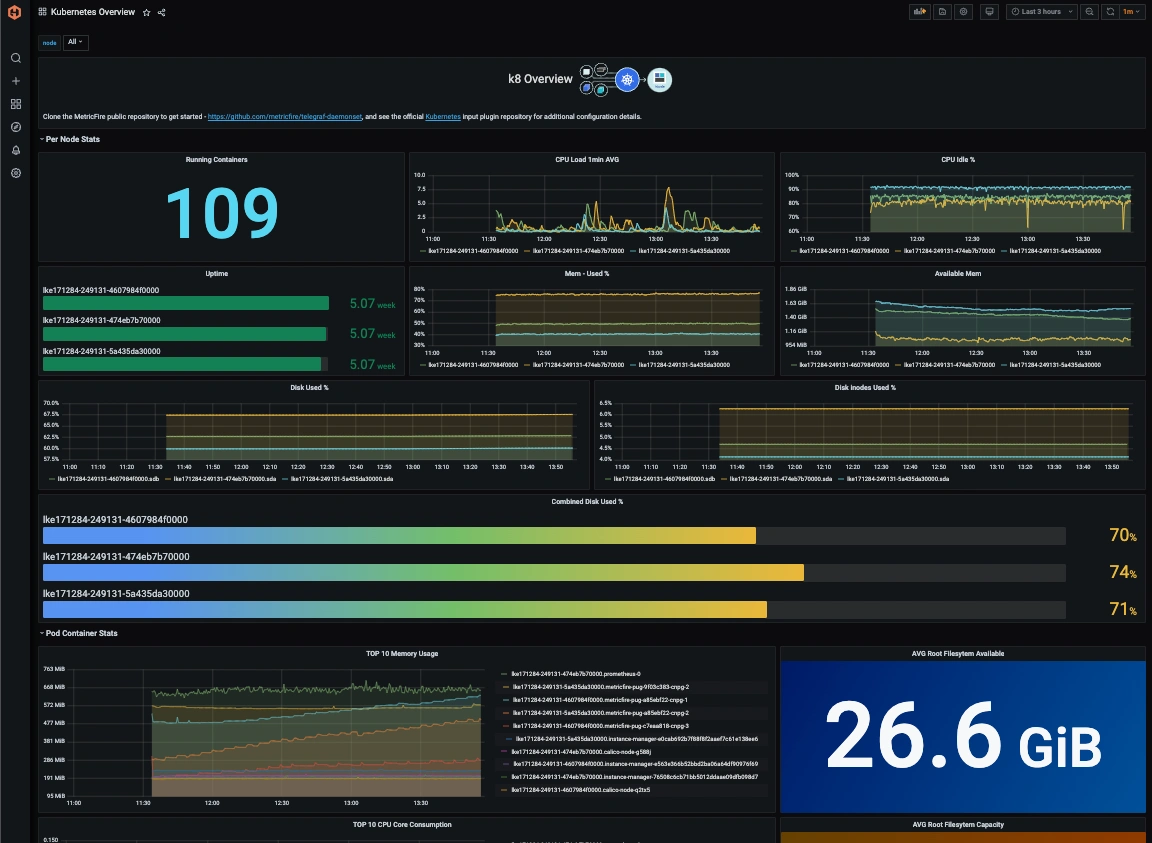
In this article, we'll explore how MetricFire uses its own platform for monitoring k8s!... Continue Reading
Introduction Monitoring is the most important aspect of infrastructure operations. Effective monitoring strategies help... Continue Reading
Learn how you can monitor your Heroku applications at a competitive and affordable price.... Continue Reading
MetricFire is a cloud-based monitoring platform that simplifies the challenging task of monitoring Kubernetes... Continue Reading
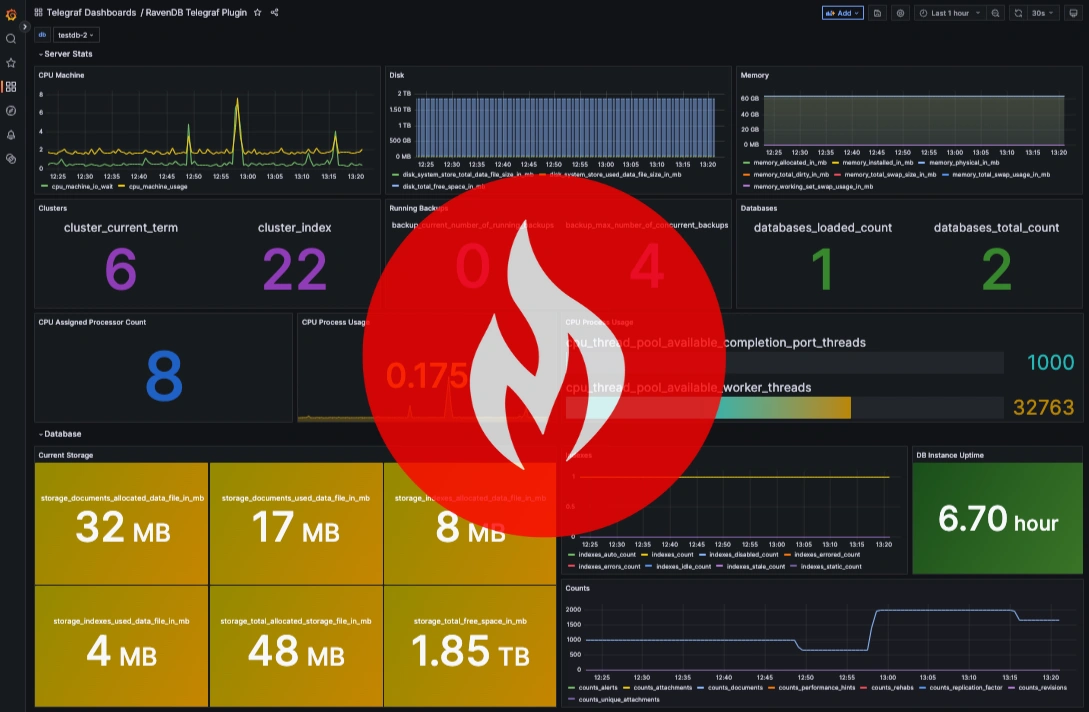
Monitoring the performance of RavenDB is crucial to ensure optimal system operation, quickly identify... Continue Reading
See a tutorial on how to pull Kubernetes metrics directly from your cluster into... Continue Reading
See the best practices for monitoring Kubernetes with Grafana. See how you can make... Continue Reading

Look at the basics of incident response, the mechanisms that can provide security-related metrics... Continue Reading

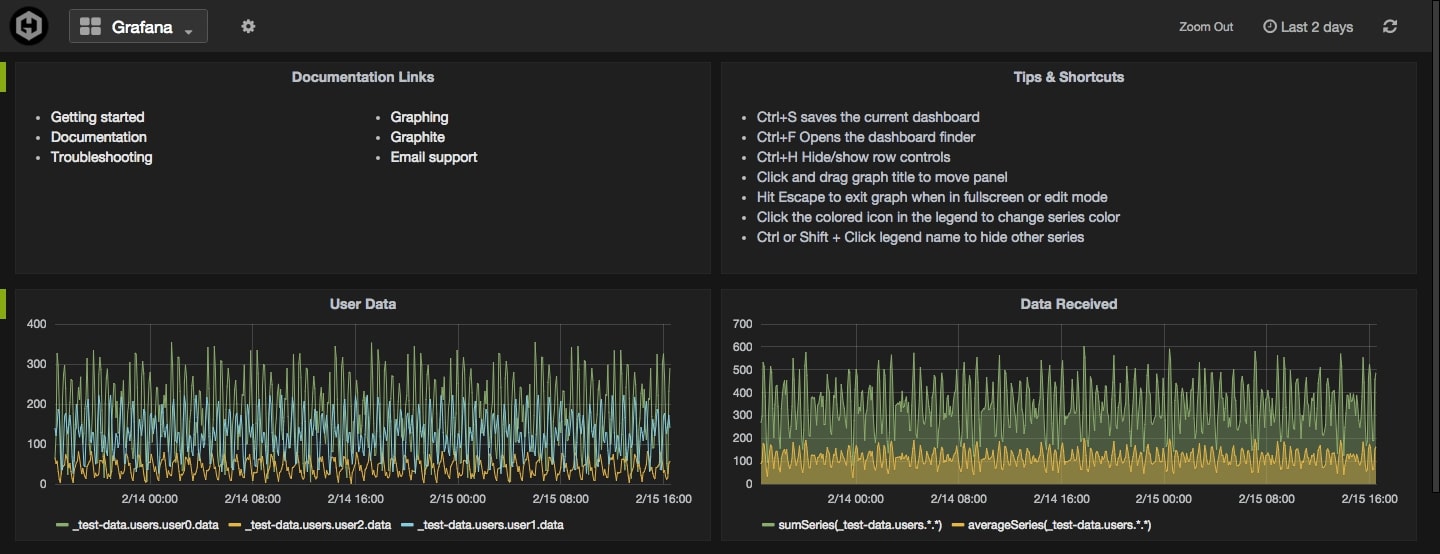
In this article, we will explore the basics of Grafana and learn how to... Continue Reading
Understand the pain points involved in monitoring Kubernetes and the tools available to help... Continue Reading
Let's learn about tools that help to manage access from Kubernetes pods to AWS... Continue Reading
Kubernetes secrets can simplify the deployment process. You can inject them in your app's... Continue Reading
Learn to monitor Kubernetes from deploying Prometheus and Grafana with Helm, and then building... Continue Reading
Learn how to monitor Kubernetes with Graphite and Grafana. Download Grafana dashboards for Kubernetes... Continue Reading
Monitoring is the most important aspect of infrastructure operations. This article will give you... Continue Reading
Take a look at two real examples of migrating to K8S without changing everything... Continue Reading
Are you looking for an affordable monitoring solution? MetricFire offers an easy-to-use, efficient, and... Continue Reading
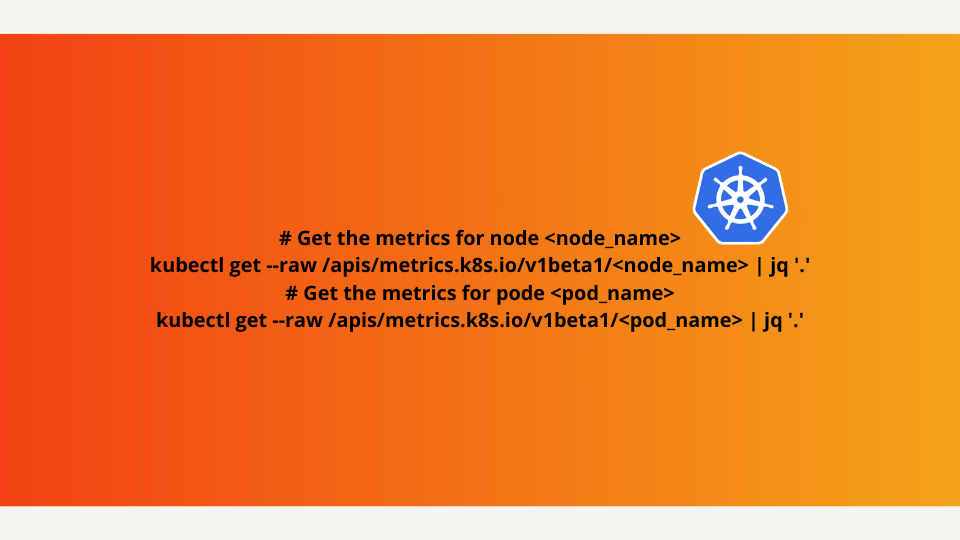
Learn quick ways to verify Metrics Server in Kubernetes—check install, inspect status, query the... Continue Reading
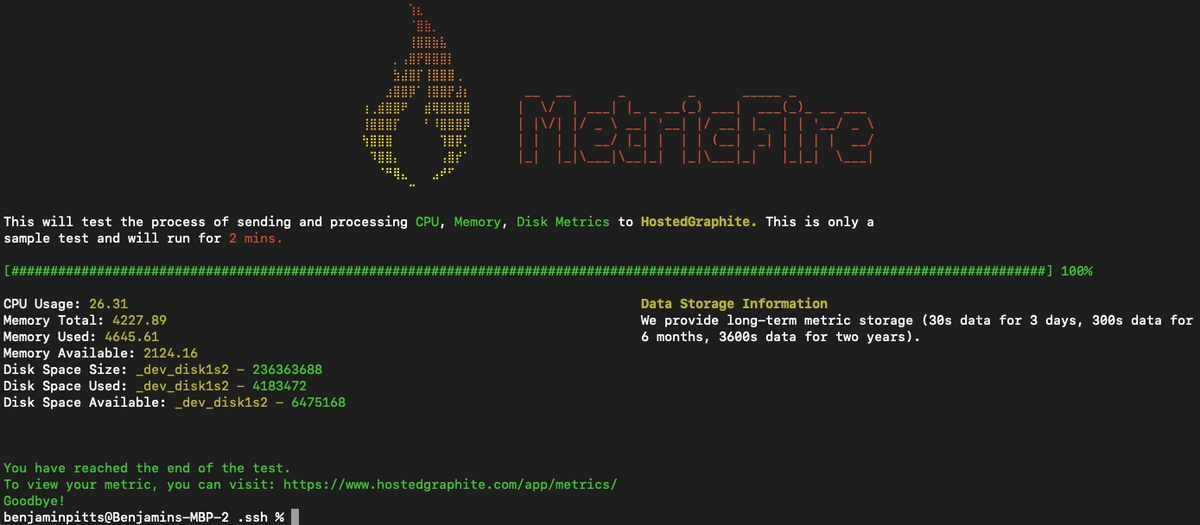
Check out our latest onboarding demo tool- a CLI demo tool to test! Continue Reading
Everything you need to know about migrating your monitoring from an in-house to a... Continue Reading
Monitoring your Kubernetes clusters is crucial for optimizing resource usage and ensuring application performance... Continue Reading
In this article, we'll look at sending data to MetricFire, such as using custom... Continue Reading
Monitoring ZFS across your business's server infrastructure is crucial for ensuring data integrity, optimizing... Continue Reading
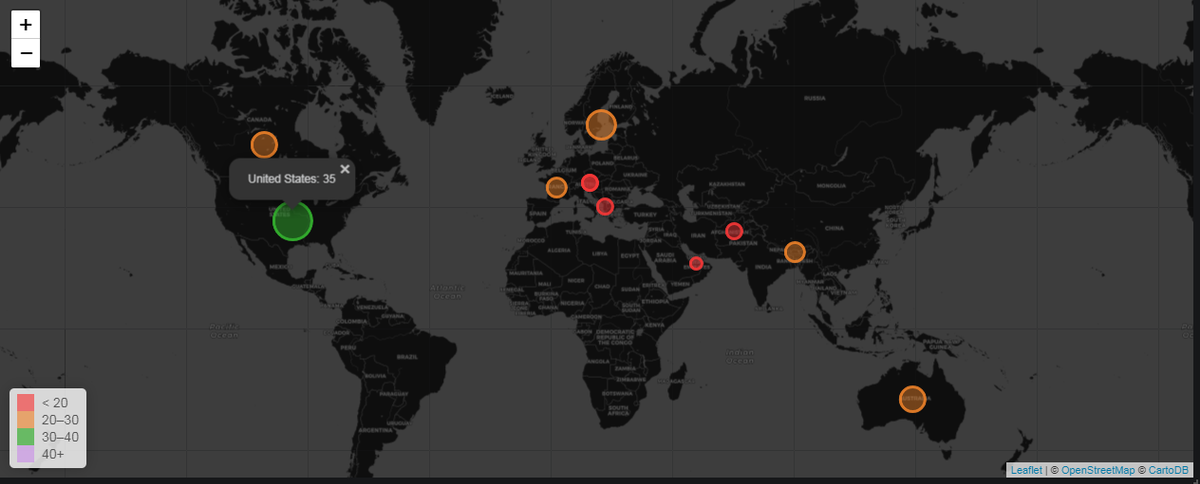
Learn Grafana Geomap fast: install, map layers, Graphite/InfluxDB queries, and when to use Worldmap... Continue Reading

You can ensure your HealthTech app meets the highest performance and reliability standards. We'll... Continue Reading

Monitoring the state of your services and running processes is crucial for ensuring system... Continue Reading
The article explains MetricFire's role in supply chain monitoring and highlights its cost-effectiveness and... Continue Reading
MetricFire's platform, Hosted Graphite, is recommended for webhook monitoring, offering tools for metric collection,... Continue Reading
Monitoring socket connections in your servers is critical because it ensures network communication is... Continue Reading
Monitoring your webhook endpoints is essential to maintain operational efficiency and customer satisfaction, as... Continue Reading
Discover why MetricFire outshines Netdata in cost-effective monitoring solutions. Explore features, pricing, user experience,... Continue Reading
Explore the step-by-step transition from Netdata to MetricFire for cost-effective monitoring. Discover why MetricFire... Continue Reading
Master AWS with key services like EC2, RDS, and IAM. Use MetricFire to monitor... Continue Reading
Explore the essentials of load balancing in web applications, its algorithms, and types, plus... Continue Reading

Virtual machines provide various benefits such as improved resource allocation, isolation, flexibility, and scalability.... Continue Reading
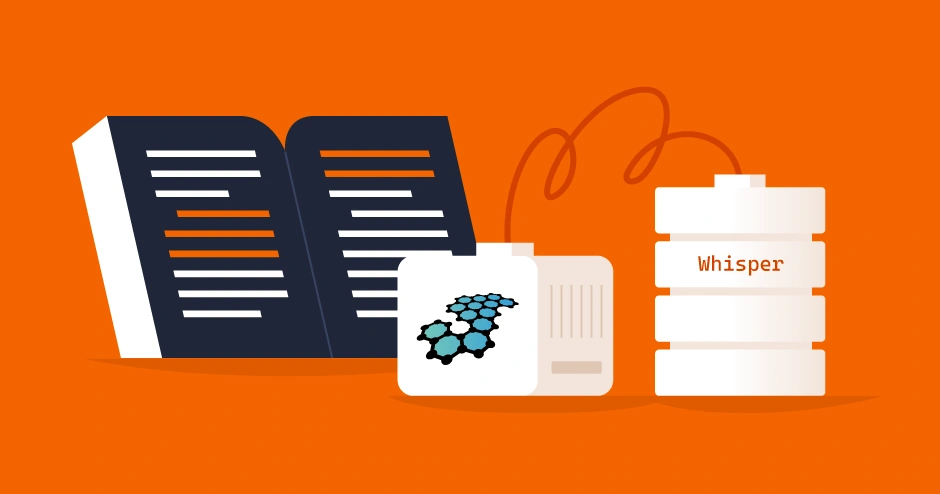
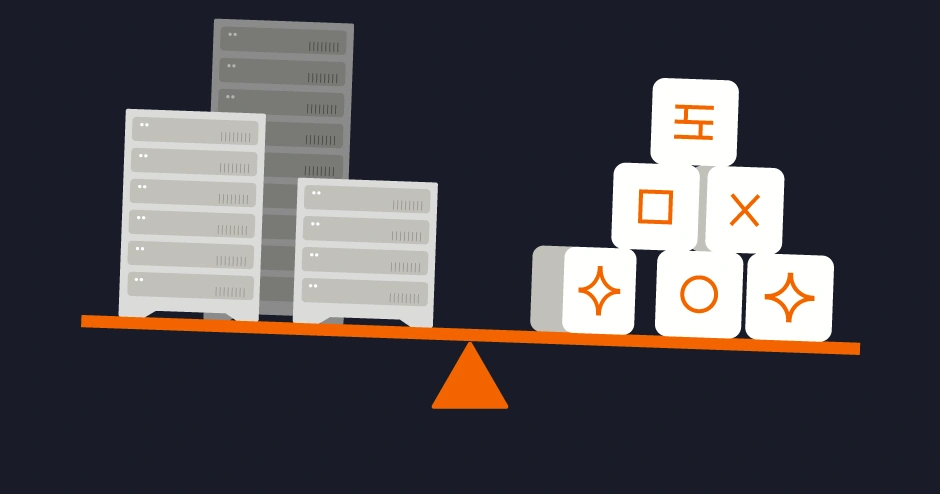
Protect your Graphite cluster's data! Learn how to backup with Whisper & ensure data... Continue Reading
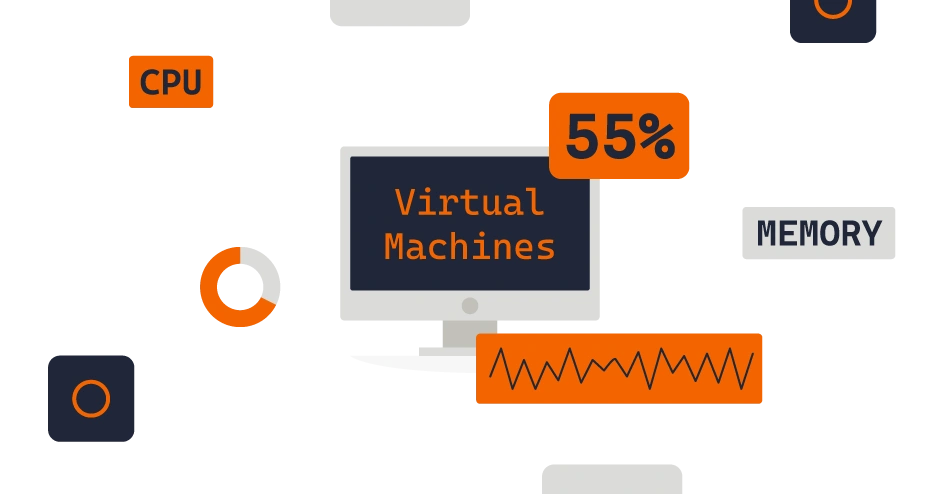
Ensure peak performance for your VMs! Learn how to monitor resource utilization & troubleshoot... Continue Reading
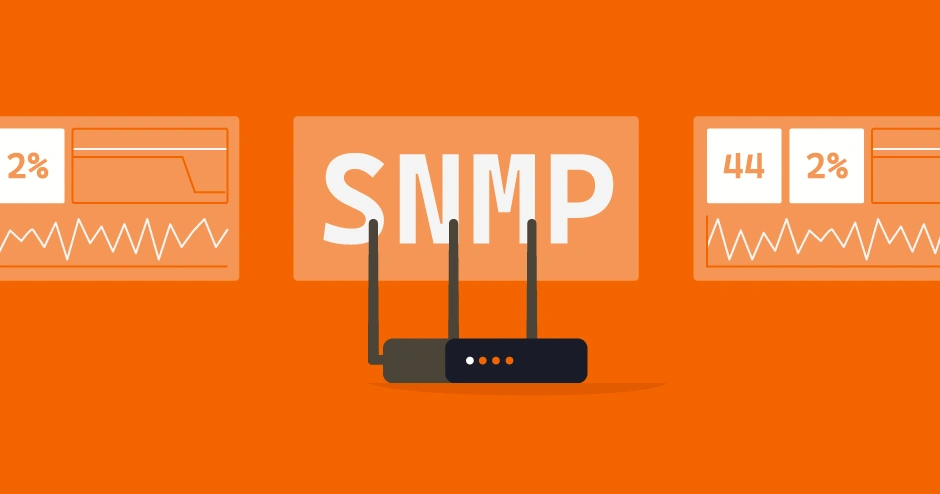
Optimize network performance with SNMP router monitoring. Discover the benefits of MetricFire for efficient... Continue Reading
Tame website monitoring woes! StatsD & Pingdom simplify data & offer key insights. MetricFire... Continue Reading
Monitoring your Zipkin tracing environment is crucial for maintaining the reliability and performance of... Continue Reading

Monitoring your Apache Tomcat servers is crucial for your business because it ensures the... Continue Reading
Monitoring the performance of your Apache servers is vital for maintaining optimal operation and... Continue Reading
Simplify IoT device management with AWS & MetricFire. AWS IoT offers scalability, security &... Continue Reading
Considering a switch from Zabbix to MetricFire for IT monitoring? This guide explores the... Continue Reading
Master Docker basics with tips for beginners and pros alike. Optimize your Docker experience... Continue Reading
Discover why infrastructure alerts are crucial for businesses during peak periods. Set up alerts... Continue Reading
Monitoring SNMP devices is crucial for maintaining network health and security, enabling early detection... Continue Reading
It's important to monitor uWSGI instances to ensure their stability, performance, and availability, helping... Continue Reading
Monitoring your ClickHouse database is a proactive measure that helps maintain its health and... Continue Reading
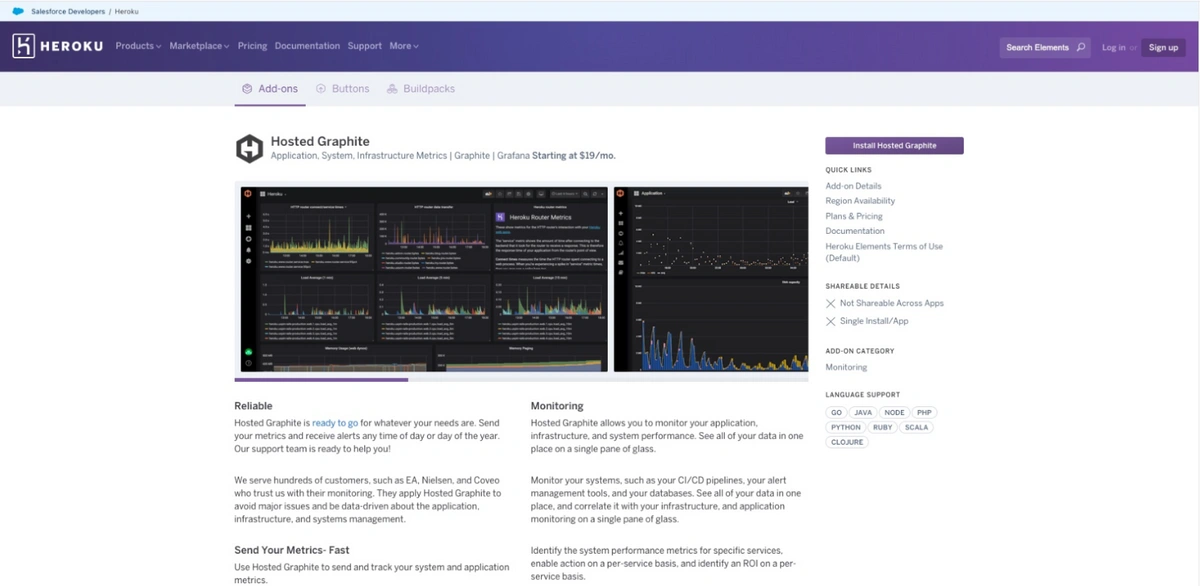
Hosted Graphite brings simple, reliable monitoring to the Heroku Marketplace, giving teams full visibility... Continue Reading
Monitoring your Jenkins instances is essential for ensuring the CI/CD pipeline operates smoothly, efficiently... Continue Reading
Monitoring the performance of your ELK stack is vital for ensuring that critical logging,... Continue Reading
Monitoring Kibana allows for proactive maintenance, enabling organizations to deliver a seamless and responsive... Continue Reading
Monitoring your Logstash service is vital for ensuring optimal performance and reliability in data... Continue Reading
Monitoring Elasticsearch is essential for DevOps teams to proactively detect and resolve issues, ensuring... Continue Reading
Effective monitoring of Riak involves collecting, analyzing, and acting on a variety of metrics... Continue Reading
Monitoring your Puppet runs is essential for maintaining performance, reliability, security, and compliance. It... Continue Reading

Welcome to the latest changelog blog post of February, where we highlight the recent... Continue Reading
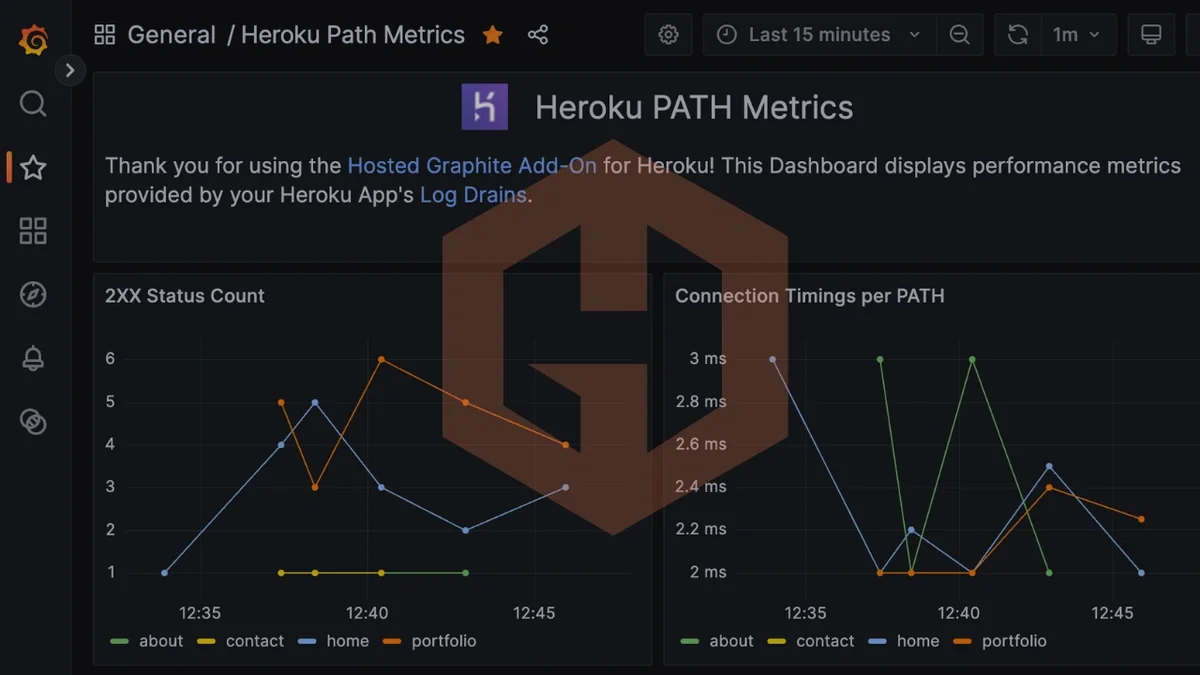
Monitoring your Heroku application at the path level provides a much clearer understanding of... Continue Reading

Monitoring Redis instances is essential for maintaining performance, reliability, and security. It allows you... Continue Reading
Monitoring your email campaigns helps you track key performance indicators (KPIs) such as open... Continue Reading
Monitoring RabbitMQ is essential for maintaining the health, performance, and reliability of your messaging... Continue Reading
Monitoring your PostgreSQL instance is essential for maintaining performance, reliability, security, and compliance. It... Continue Reading
Monitoring your domain URL and server IPs is important for many reasons and plays... Continue Reading
Monitoring your IoT devices provides insights into their usage patterns, environmental conditions, and user... Continue Reading
Monitoring your machine's internal temperatures is important for maintaining system health, optimizing performance, and... Continue Reading
Monitoring your instance of NGINX gives you insight into it's requests, connections, and more.... Continue Reading
In this article we'll detail how to use the Telegraf agent to collect performance... Continue Reading
Monitoring your GitHub account is important for maintaining code quality, facilitating collaboration, enabling smooth... Continue Reading
Database monitoring helps in spotting anomalies before they escalate into critical issues that could... Continue Reading
Monitoring the performance of your MySQL database will help identify performance bottlenecks, inefficient queries,... Continue Reading
How to use the Telegraf agent to collect network performance data, create custom dashboards,... Continue Reading
Adapting cloud infrastructure can transform the way your organization operates, enabling scalability, cost-efficiency, and... Continue Reading

Can Grafana or Power BI give you a solution that gives you meaningful insight... Continue Reading

This Grafana tutorial is about annotations. Grafana annotations are for users who want to... Continue Reading
Learn how to monitor Cisco Catalyst with Grafana. enable SNMP, scrape via Prometheus, and... Continue Reading

Observability defines system efficiency. Delve into observability's world, its associated expenses, and harness MetricFire... Continue Reading
Given the complexity of networks and the ongoing danger of cyberattacks that we face,... Continue Reading
Docker is a platform used for deploying applications in Docker containers. See how MetricFire... Continue Reading
Introduction Datadog is one of the most known tools for monitoring. It’s widely popular... Continue Reading
Elevate your containerized applications' performance, efficiency, and reliability with MetricFire as your trusted monitoring... Continue Reading

この記事では、Graphiteを使用してElasticsearchインスタンスを監視し、Grafanaを介してデータを視覚化する方法について説明します。 また、カスタムアプリケーションのメトリックを監視し、それらをGrafanaの単一のダッシュボードにまとめて表示するためのGraphiteにも焦点を当てます。 Continue Reading
Nagios is a monitoring platform with pros, cons, and common problems. Learn to troubleshoot... Continue Reading
In this article, we delve into the Grafana and Graphite best practices as offered... Continue Reading
Learn how to monitor CPU temperature using Hosted Graphite, and discover the benefits it... Continue Reading
Monitoring Kafka performance metrics is important to ensure its stable operation. Use Hosted Graphite... Continue Reading
MetricFire has a suite of open source network monitoring tools. Supercharge your existing network... Continue Reading
Use fluentd and ElasticSearch (ES) to log for Kubernetes (k8s). This article contains useful... Continue Reading

A lot of organizations are using Grafana to visualize information and get notified about... Continue Reading

What are the differences and similarities between Prometheus vs. ELK? Which one should you... Continue Reading
Read about the ten best open source switch network monitoring tools and optimize your... Continue Reading

You can learn how to monitor Kafka using Prometheus. We'll show you how you... Continue Reading
Learn how to create a Grafana dashboard for VM metrics, create advanced dashboards with... Continue Reading
Docker is one of the most popular tools for containerization, and many tools have... Continue Reading
Get to know Prometheus Pushgateways and how they can help you send metrics data... Continue Reading
In this article, we will describe and compare Prometheus and InfluxDB, so that readers... Continue Reading
Compare Prometheus and Zabbix on market position, pricing, and core strengths. Learn how pairing... Continue Reading

cAdvisor is an open-source container monitoring platform developed and maintained by Google. Learn more... Continue Reading
Take a look at the top 5 most common Prometheus Alertmanager issues, learn the... Continue Reading
In this post we will learn briefly about various networking modes available for Docker... Continue Reading

This article discusses eight web application performance metrics and three methods that can boost... Continue Reading
Start doing MySQL performance monitoring the right way with this in-depth guide. Use MetricFire... Continue Reading

Learn to monitor a Flask app with a simple configuration of Prometheus. Continue Reading

Monitor your RabbitMQ with Prometheus/Grafana, and visualize your node, queue, and cluster-wide metrics. Continue Reading

Read about Nginx monitoring and its crucial role in application stacks. Learn how Metricfire... Continue Reading
Improve your business with SQL Server Monitoring. MetricFire’s Hosted Graphite and Hosted Grafana provides... Continue Reading

This article covers the basics of Amazon CloudWatch Log Insights. Connect it to MetricFire... Continue Reading
Check out this tutorial for monitoring Traefik with Prometheus. Keep your websites stable and... Continue Reading

In this article, we present an overview of cluster monitoring using Rancher and Prometheus... Continue Reading

StatsD is a light-weight text-based protocol in which data is aggregated and stored outside... Continue Reading
Learn how to visualize business metrics using Grafana and Power BI - from storing... Continue Reading

Compare Grafana and Splunk on market position, pricing, and core strengths. Continue Reading

Compare Grafana and Tableau on market position, pricing, and core strengths. Continue Reading

Compare Grafana and Zabbix on market position, pricing, and core strengths. Continue Reading
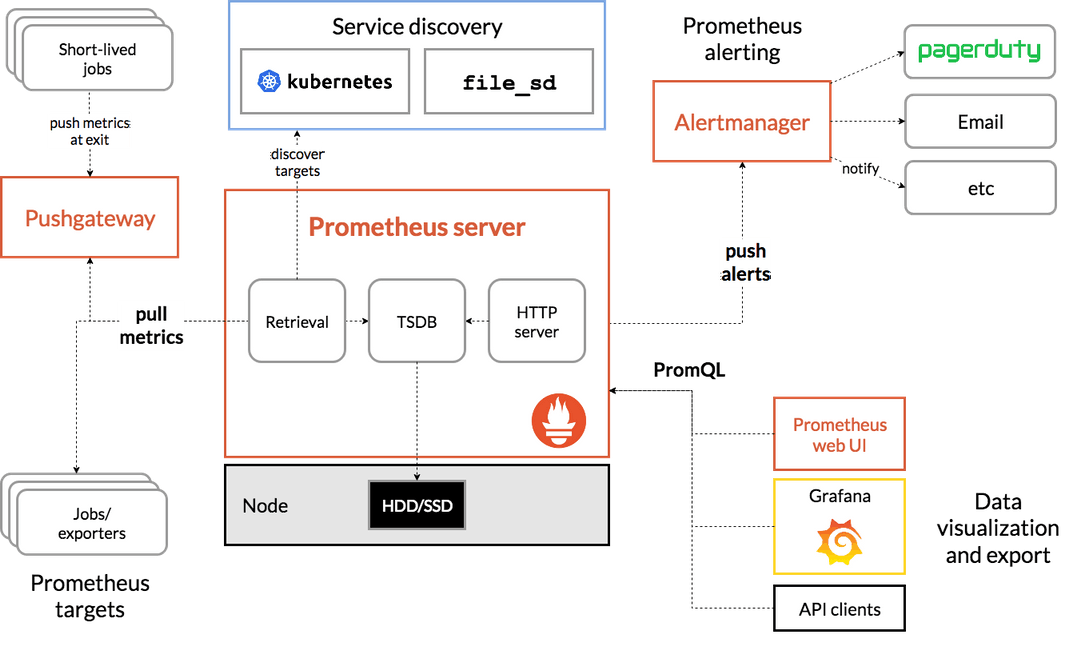
Get to know how to deploy Prometheus on Kubernetes, including the configuration for remote... Continue Reading
Take a look at the differences between open-source Redis and Redis Enterprise. Get oriented... Continue Reading

This article will explore the advantages and considerations of using add-ons on Heroku such... Continue Reading

The Prometheus rate function can help you predict trends in data. Continue Reading

Curious about Grafana vs. Chronograf and InfluxDB? Learn more from the experts at MetricFire... Continue Reading

In this article, we will explore how to harness the potential of Grafana and... Continue Reading
Whether you are a developer, system administrator, or just a tinkerer - there is... Continue Reading
Monitor your AWS Lambda with MetricFire, that not only helps in collecting data but... Continue Reading
Integrating Graphite with a Grafana host for monitoring Graphite metrics can be easily achieved... Continue Reading
Learn to monitor MySQL server performance with Prometheus and sql_exporter. Visualize your metrics in... Continue Reading

How to monitor your HashiCorp Nomad with Prometheus and Grafana. Build dashboards with the... Continue Reading

Apache ActiveMQ is a popular open source software. Get started with MetricFire's and monitor... Continue Reading

When should you use Graphite over InfluxDB? Compare Graphite vs InfluxDB, and try it... Continue Reading
Use MetricFire to monitor your Redis Performance. See this how-to guide on Redis monitoring... Continue Reading
Apache Spark is a powerful tool for data analysis and machine learning. Ensure its... Continue Reading

An overview of how Grafana and Prometheus work together. Use MetricFire's Hosted platforms and... Continue Reading

What is the Thanos open-source project for Prometheus, and how does Thanos work? We... Continue Reading
Compare Datadog alternatives on market position, pricing, and core strengths. We'll look at Datadog... Continue Reading
Collectd and StatsD are both collectors that pull stats and metrics into a data... Continue Reading
Let's see EC2 metrics and make a dashboard using CloudWatch. Also we'll check MetricFire's... Continue Reading
Everything you need to know about Grafana data sources. Learn about the most popular... Continue Reading

Analyzing metrics has become essential for business success. Can Grafana or Nagios meet your... Continue Reading

Compare Grafana and New Relic on market position, pricing, and core strengths. Continue Reading

Learn the features available in Grafana for the Graphite datasource, and learn to set... Continue Reading

Learn how to install Graphite on Ubuntu from installing Graphite using Docker to accessing... Continue Reading
Check out the top 3 ways to visualize data from Prometheus. Learn about Prometheus... Continue Reading
Compare Prometheus and Splunk on market position, pricing and core strengths. Continue Reading

Curious about 'What is Prometheus Pushgateway'? This article explores its purpose and functionality in... Continue Reading

There are a large number of IoT devices, and IoT technologies that are very... Continue Reading
It is important to monitor the GitHub repository metrics to effectively manage the software... Continue Reading
Find out in detail what are the best cloud infrastructure automation tools. Tap into... Continue Reading
Check out the best monitoring tools for Hadoop and see how to set up... Continue Reading

In this article we will answer all your questions surrounding monitoring Juniper Networks. In... Continue Reading

See a full tutorial on remote Prometheus monitoring with Thanos. Use Hosted Graphite by... Continue Reading
Learn about performance monitoring metrics, such as what metrics you should be looking at,... Continue Reading

HAProxy monitoring can be done with collectd, Graphite, and Grafana. Check out this tutorial... Continue Reading

This articles describes in detail the best Grafana dashboard for IoT Device monitored via... Continue Reading

See this Grafana tutorial on how to automate all of your common actions. Use... Continue Reading
See this how-to-guide on setting up your integration between Grafana and CloudSQL. See your... Continue Reading
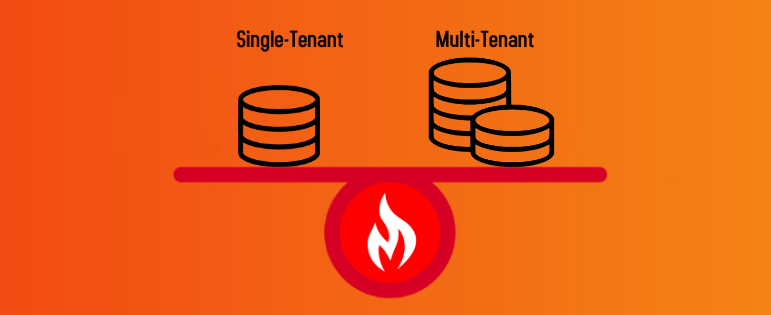
Read about single-tenant cloud vs. multi-tenant cloud. Use MetricFire to monitor your set of... Continue Reading
A quick guide on how to track Apache server performance. Use MetricFire and Graphite... Continue Reading

The best tool for scaling time series metrics for application performance monitoring is MetricFire.... Continue Reading

Improve your app's infrastructure monitoring by using MetricFire’s Prometheus alternative to monitor important metrics.... Continue Reading
Compare AWS to other monitoring alternatives. Take a look at the pros and cons... Continue Reading

Let's learn the basics of Prometheus and check out implementations of exporters based on... Continue Reading

Start your first Grafana dashboard, set up alerts, and find out where to go... Continue Reading

Compare Grafana and AppDynamics on market positioning, pricing, and core strengths. Continue Reading

In this article, we will discuss Graphite and StatsD, and how they can help... Continue Reading
Choose the right kind of Grafana Dashboards for the most common KPIs seen in... Continue Reading

Learn to use Prometheus Adapter to leverage the metrics collected by Prometheus and use... Continue Reading
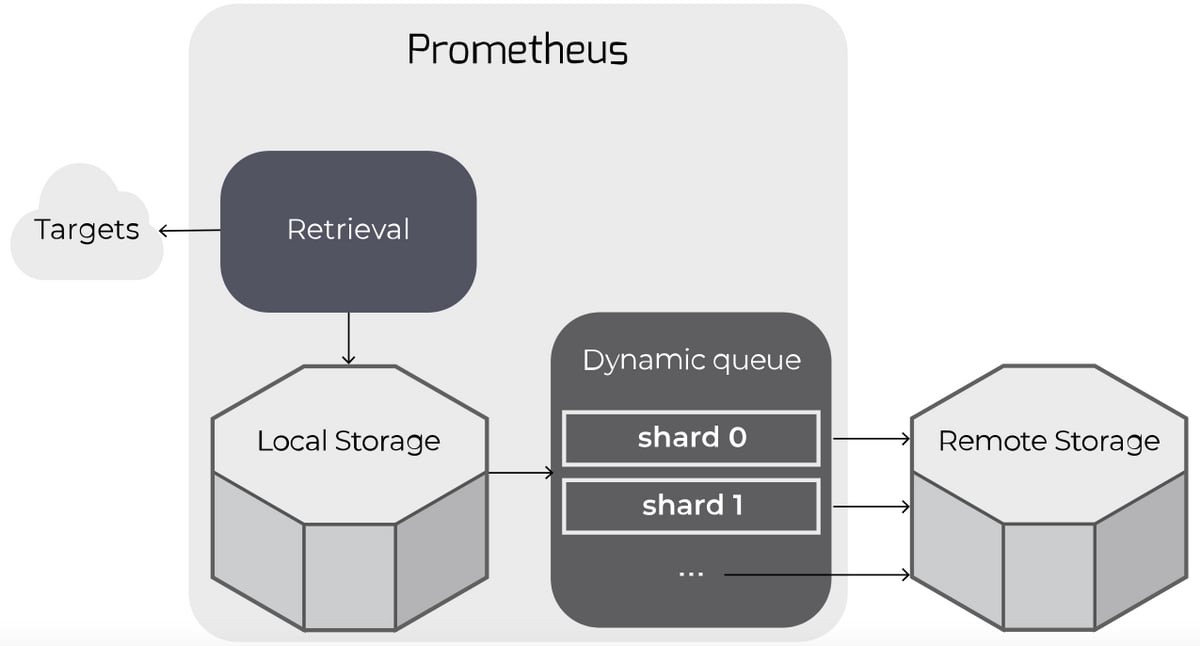
Prometheus can be configured to read from and write to remote storage, in addition... Continue Reading

Compare Prometheus and CloudWatch on pricing, market positioning, and core strengths. Continue Reading
Learn how to send StatsD metrics, such as gauges, counters and timers, to MetricFire.... Continue Reading
Welcome to the latest changelog blog post of October, where we highlight the recent... Continue Reading

Explore the options of observability—open source software, paid tools, and managed OSS with Hosted... Continue Reading

We will learn how to deploy a Python StatsD client, how to employ it... Continue Reading

In this article, we’ll discuss what can go wrong with our machine-learning model after... Continue Reading

Read what Graphite monitoring is all about. Use MetricFire's Hosted Graphite and do not... Continue Reading
Take a look at the similarities and differences of Graphite and Prometheus, and decide... Continue Reading
Prometheus and Grafana can serve both on-premises or cloud-based companies, but Hosted Graphite and... Continue Reading

This article explains how Heroku’s built in monitoring provides basic visibility, and how Hosted... Continue Reading
Learn to monitor your virtual machines with Prometheus or Graphite. With MetricFire, Hosted Graphite... Continue Reading
Grafana is open source and free, where Datadog is proprietary. Grafana is an extremely... Continue Reading

Prometheus can be used to monitor Python apps. Check out how to use Prometheus... Continue Reading
Get the best of your Graphite monitoring tool with this comprehensive installation guide. Use... Continue Reading
A synthetic tool identifies performance problems and helps in eliminating bottlenecks. Hosted Graphite is... Continue Reading

AWS KMS is a comprehensive solution to manage cryptographic keys used across not only... Continue Reading
Learn how to configure Filebeat to run as a DaemonSet in our Kubernetes cluster... Continue Reading
Set-up production grade Kubernetes logging for applications deployed in the cluster. We'll use Elasticsearch... Continue Reading
In this article, we'll learn about network switches and the conveniences of using MetricFire... Continue Reading
Learn the concept of Nginx and how to monitor Nginx using Telegraf and MetricFire's... Continue Reading
Welcome to the latest changelog blog post of August, where we highlight the recent... Continue Reading

See a full tutorial on how to monitor CI/CD pipelines using Grafana and Prometheus.... Continue Reading
This article will focus on the popular monitoring tool Prometheus, and how to use... Continue Reading
These are the best cloud and windows server monitoring tools. Monitor your servers and... Continue Reading
Learn how to easily integrate CloudWatch and Sentry with MetricFire to enhance your monitoring... Continue Reading

When you use an open-source software, you can often face steep learning curves and... Continue Reading
Discover the power of integrating MetricFire with Heroku for efficient web hosting, scalability, and... Continue Reading
Discover why MetricFire outperforms Nagios as a monitoring tool. Learn about the key advantages... Continue Reading
Learn about Heroku monitoring and the app’s metrics you should monitor. Make sure that... Continue Reading
Learn how to monitor your AWS EC2 instances using Hosted Graphite, a powerful graphing... Continue Reading

Compare Prometheus and Datadog on market position, pricing and core strengths. Continue Reading
Learn how to monitor multi-layer Huawei switches using MetricFire, a powerful monitoring tool designed... Continue Reading
Discover the power of Azure, Microsoft's cloud computing platform. Learn about its benefits, key... Continue Reading
Nagios has long been a popular choice due to its robust feature set and... Continue Reading

Discover how hosted graphite can significantly improve the efficiency and performance of printers with... Continue Reading
Learn how to effectively monitor Heroku Postgres using Hosted Graphite for improved performance and... Continue Reading

Let's get a deeper understanding of Grafana and Chronograf's dashboards, as well as, its... Continue Reading
Discover how hosted graphite and machine learning can revolutionize your monitoring and optimization efforts.... Continue Reading
Numerous network performance monitoring tools are available. MetricFire brings the best of both worlds... Continue Reading

Discover the challenges of sending UDP metrics from containers to DogStatsd and learn why... Continue Reading

Compare Grafana and Kibana on strengths, setup, data sources, user authentication, alerts, querying, visualization,... Continue Reading
A briefing on Grafana v7 and V8 features such as panel editor, tracing UI,... Continue Reading

Success hinges on a good Syslog application and metrics software for clear metrics visibility.... Continue Reading

Exporting metrics to Prometheus from a standard Python web app stack is a bit... Continue Reading

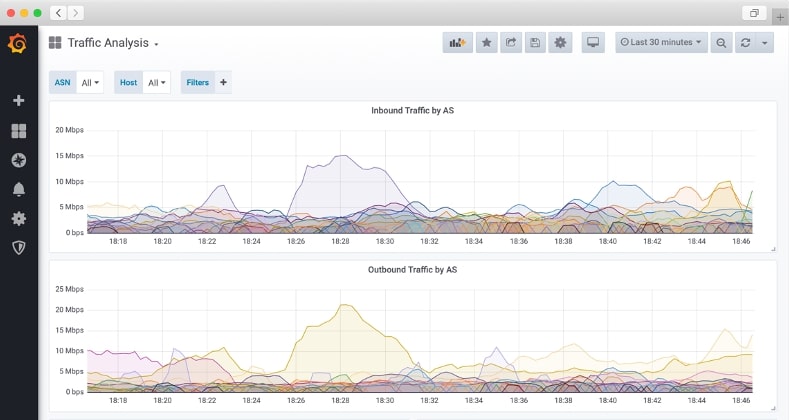
Learn the best practices for monitoring network traffic. Get started with MetricFire today to... Continue Reading

What's the correct choice when it comes to Grafana vs. SolarWinds? Let the experts... Continue Reading
Use Prometheus to monitor Kubernetes by applying the four golden rules of observability. Continue Reading
Compare Prometheus and AppDynamics on market position, pricing, and core strengths. Continue Reading
Start monitoring your API Gateway with MetricFire today to enhance security, optimize performance, and... Continue Reading

Let’s take a look at the core concepts behind monitoring IoT, and learn to... Continue Reading
Learn how to set up Prometheus to monitor Redis clusters. To learn more about... Continue Reading

Graphite is simple to use, yet it's a powerful time-series monitoring system. Learn how... Continue Reading
MetricFire is our first option for monitoring IoT devices. It establishes performance criteria that... Continue Reading
Introduction Cloud monitoring is like a health check-up for our online spaces. It tells... Continue Reading
Welcome to the latest changelog blog post, where we highlight the recent updates and... Continue Reading

This article will introduce you to AWS Cloudwatch alarms, events, metrics, and logs. You... Continue Reading

Learn the easy and efficient way to monitor server load. MetricFire's Grafana and Graphite... Continue Reading
Learn how to monitor AWS SQS using MetricFire for enhanced visibility, performance optimization, reliability,... Continue Reading
Learn how to monitor your Aruba network using Hosted Graphite, a powerful cloud-based solution.... Continue Reading
To maximize the benefits of Sitespeed, MetricFire provides a seamless integration and comprehensive monitoring... Continue Reading

Compare AWS CloudWatch and Prometheus custom metrics, and look at which tool will be... Continue Reading

In this article we will visualize information from cAdvisor and Redis by processing the... Continue Reading

Prometheus is a favorite tool among dev teams and software engineers. It is an... Continue Reading

In this article, we will learn about Junos OS and Prometheus and Graphite. We... Continue Reading

Find out what is Graphite and how you can use Graphite to monitor your... Continue Reading
Discover the complexities of self-hosting monitoring and how MetricFire can simplify the process with... Continue Reading
The growing popularity of IoT devices has revolutionized the way we interact with technology.... Continue Reading
Intro Collectd is a data collection software that allows you to fetch metrics from... Continue Reading

Look at the difference between Graphite and Grafana and understand how to use them... Continue Reading
In this article, we'll cover our latest integration and show you how to set... Continue Reading
Infrastructure monitoring is essential for any business, large or small. At Metricfire, we want... Continue Reading
To ensure the success and longevity of your Minecraft server network, take advantage of... Continue Reading
Explore how to effectively monitor Aruba switches leveraging the power of Hosted Graphite and... Continue Reading

Graphite API provides a flexible way to integrate the monitoring metrics by Graphite into... Continue Reading
Monitoring Microsoft Azure Event Hubs has never been this easy! Use MetricFire's Hosted Grafana... Continue Reading
Ensure that your database is robust, reliable and up to date by using the... Continue Reading

A Pushgateway is the elegant Prometheus solution for delivering metrics from batch jobs and... Continue Reading

Opt for open source monitoring to get more freedom. Open source monitoring tools allow... Continue Reading

MetricFire offers a flexible platform for monitoring your Lotus Domino server. Proper setup and... Continue Reading
Monitor applications hosted in GCP with Graphite and Grafana, and take advantage of MetricFire's... Continue Reading
In this article, we'll compare Google's Lighthouse and the tools Sitespeed and Graphite. Both... Continue Reading

Chronograf has two main functions: data visualization and system administration. Use MetricFire's hosted platforms... Continue Reading
Learn how to display a metric on a Graphite dashboard. Use MetricFire's Hosted Graphite... Continue Reading
Discover the ten best router monitoring software and tools and find out how MetricFire... Continue Reading

Microservices and microapps are both core components of today's application development. Learn what makes... Continue Reading
Backing up your Whisper messages to the cloud is a vital step to ensure... Continue Reading
The Graphite graphing and monitoring tool is an open source software for monitoring time-series... Continue Reading
MetricFire Chnagelog: June 2023. We highlight the recent updates and improvements to Metricfire products... Continue Reading

Graphios is easy to set up and sends all your Nagios data to Graphite... Continue Reading
In this article, we will explore how MetricFire can be utilized for Android data... Continue Reading

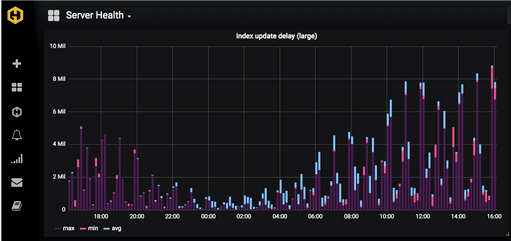
Why Graphite metrics delays occur and what to do about it. Four easy fixes... Continue Reading
Not sure how to understand insights from your Heroku application? Look no further! Download... Continue Reading
MetricFire’s hosted solution gives users flexibility and scalability to handle high cardinality data with... Continue Reading
Graphite is a leading open source time-series metric monitoring system. MetricFire runs a Hosted... Continue Reading
See how Graphite can be used to detect anomalies in your metrics. Learn how... Continue Reading
This article will impart valuable insights about a resource that could significantly change your... Continue Reading

Learn about Carbon and the four key services that make up Carbon. Carbon is... Continue Reading
Learn the importance of monitoring IoT device metrics and explore the benefits of using... Continue Reading
Get to know how to integrate Azure data source with Graphite and Grafana, and... Continue Reading

In this article, we'll take a look at the plugins that Grafana has to... Continue Reading
Learn how to deploy a clustered Prometheus setup that integrates Thanos. Also, we'll visualize... Continue Reading

In this article, we will explore time-series metrics, understand time-series data, and discuss how... Continue Reading
Node.js is a popular framework for creating microservices. Let's look at how to monitor... Continue Reading
Explore the benefits of using the new Cisco NX OS for data centers, and... Continue Reading
Take control of your MySQL database monitoring with MetricFire – an intelligent, customizable, and... Continue Reading
Learn how to monitor your Heroku app using Graphite, Grafana, and StatsD, all hosted... Continue Reading
The top 3 issues when setting up Graphite, and an analysis of whether it's... Continue Reading

Compare open source vs proprietary monitoring. Learn how to keep costs down while getting... Continue Reading
MetricFire Chnagelog: May 2023. We highlight the recent updates and improvements to Metricfire products... Continue Reading
MetricFire integrates seamlessly with AWS to provide you with the best visibility for your... Continue Reading
Your network needs to be managed and monitored just like the rest of your... Continue Reading
Learn about Kubernetes security, including pro tips to help you handle architecture concerns, dependencies,... Continue Reading
In this article, we will learn about network switches and top network switches in... Continue Reading
Ensure your Linux VM operates at peak efficiency and delivers optimal performance for apps... Continue Reading

Application performance monitoring for mobile games is more focused on latency and user experience... Continue Reading
See examples of displaying Graphite metrics in Grafana dashboards. Use Hosted Graphite and Hosted... Continue Reading

Improve continuous delivery by leveraging Jenkins and Spinnaker to roll out new versions of... Continue Reading
cAdvisor can help you monitor your container deployments. But what is cAdvisor exactly, and... Continue Reading

MetricFire recently updated its infrastructure, improving security, performance, and reliability with the latest versions... Continue Reading
By mastering these practices, you can stay ahead of the curve, ensuring your organization's... Continue Reading
MemoryDB is an Amazon service that enables high-speed data processing for real-time applications. Learn... Continue Reading
Unleash the full potential of your monitoring infrastructure with MetricFire - a comprehensive, cloud-based... Continue Reading
We recently updated our AWS integration and can now integrate with all AWS services... Continue Reading
Tired of network issues slowing down your business? Prevent problems before they escalate. Say... Continue Reading
Discover the power of seamless Snowflake monitoring with MetricFire, the ultimate solution for optimizing... Continue Reading
Graphite is an open-source monitoring tool that provides real-time visualization and data analysis from... Continue Reading
This article discusses how one can use Osquery to detect anomalies in infrastructure. Continue Reading
Observability is key for issue resolution in distributed systems. This post examines the costs... Continue Reading

In this article, we will define what infrastructure monitoring is, the benefits of Graphite... Continue Reading
Monitor your AI systems with MetricFire - the ultimate tool for accuracy, performance, and... Continue Reading
MetricFire is a powerful tool for server performance monitoring that can help businesses ensure... Continue Reading
Learn how you can use MetricFire's Custom Dashboards to visualize your data in a... Continue Reading
Network monitoring is a critical aspect of managing and maintaining the performance and security... Continue Reading
Hosted StatsD by MetricFire keeps all the benefits of the software and also provides... Continue Reading
MetricFire is looking forward to making monitoring more accessible for our customers this year!... Continue Reading

MetricFire lets you get real-time insights into your network and router performance. It's easy... Continue Reading
MetricFire is now offering a free 50” Vizio 4K TV with built-in Chrome Cast... Continue Reading
By far the most straightforward way to securely send your metrics is by installing... Continue Reading
Diamond is a Python daemon for collecting system metrics and presenting them to Graphite.... Continue Reading
Monitoring systems and alerts is crucial to tackling issues as early as possible. Various... Continue Reading
This article was originally published on May 25, 2016 , by Charlie von Metzradt,... Continue Reading
In this article, we will discover how we can utilize Clickhouse and integrate it... Continue Reading
Learn about how percentile data can be the perfect visualizations. Use Metricfire and Grafana... Continue Reading

One of MetricFire's priorities is to make sure we have control over where we... Continue Reading
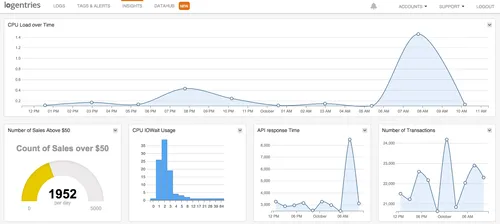
Read Logentries co-founder Trevor Parsons, post on how easy it is to extract and... Continue Reading
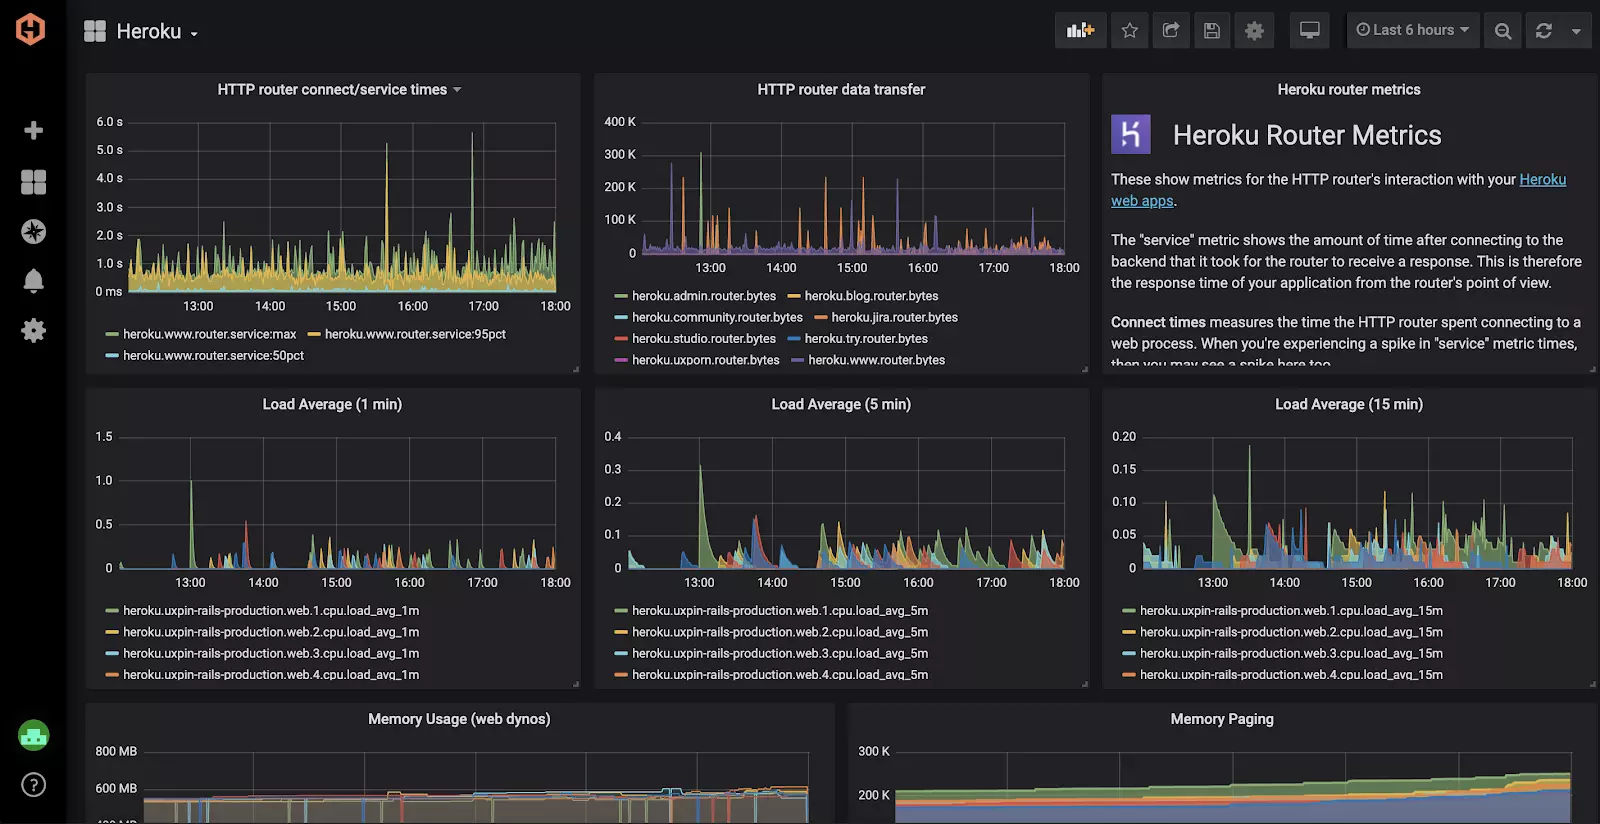
Start viewing your Heroku Dynos instantly with Hosted Graphite's automated dashboard. Get a brief... Continue Reading
Start using Hosted Graphite without having to install anything. Hosted Graphite also replaces Graphite's... Continue Reading
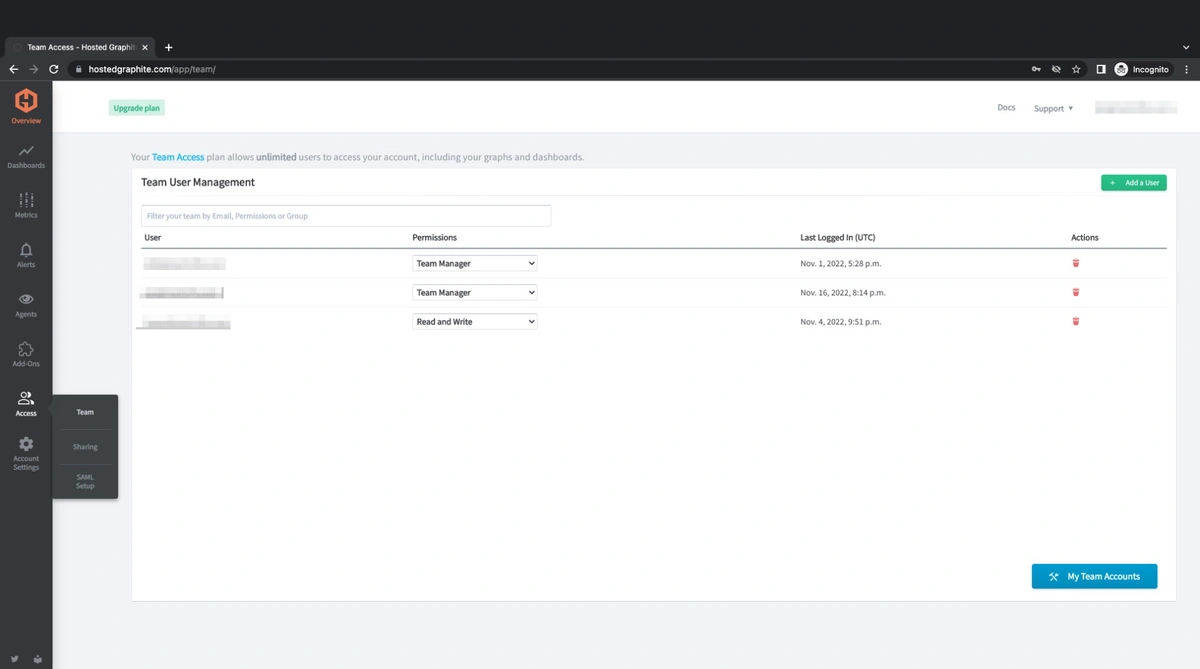
Learn to add users to your Hosted Graphite account. Continue Reading
Install the Hosted Graphite Heroku add-on to view your data in beautiful Grafana dashboards... Continue Reading
In this article, we'll compare SolarWinds and MetricFire on price, product, and customer support.... Continue Reading

A 2022 review of Tableau, including a comparison of Tableau vs. MetricFire on pricing,... Continue Reading

A 2022 review of ELK, and how it stands up against MetricFire on features,... Continue Reading
A 2020 review of Zabbix, and how it compares to open-source Prometheus and Graphite,... Continue Reading
This article shares how to integrate Heroku metrics with Amazon CloudWatch metrics using Hosted... Continue Reading
Install the Hosted Graphite Heroku Monitoring & Dashboards add-on in your Heroku App and visualize your... Continue Reading
To use Graphite, consider using Hosted Graphite by MetricFire to save your efforts for... Continue Reading
Monitoring Puppet server metrics allows you to find out about problems in its work... Continue Reading

Ensuring the security of our service is consistent and reliable for our customers counts... Continue Reading
Integrate your services with MetricFire, boost the efficiency of your incident monitoring and define... Continue Reading
Are you looking for an Instrumental alternative for your monitoring? Use MetricFire’s Hosted Graphite... Continue Reading
Are you looking for the best monitoring tool? Use Graphite and Grafana to securely... Continue Reading
The article explains how to monitor your Windows performance metrics with hosted Graphite. Continue Reading
This article introduces PagerDuty and shares methods on how to receive alerts from PagerDuty.... Continue Reading
To ensure the health of your system, save, visualize and analyze its metrics using... Continue Reading
Integrate Microsoft Azure with MetricFire and see all your Azure metrics with hosted solutions... Continue Reading
Using aggregation rules significantly speeds up the query execution process and metrics visualization. MetricFire’s... Continue Reading
Monitoring system performance metrics is a very important process to keep the system up... Continue Reading
Monitor cloud to ensure it is utilized properly and produces the desired outcomes. At... Continue Reading
It's important to know about your choices of best APM solutions in the market.... Continue Reading
Aruba Clearpass is a tool that helps keep your network secure. Use it with... Continue Reading
This article explains why hosted Graphite can be a great monitoring tool for your... Continue Reading
One can easily monitor Amazon CloudFront and display the metrics on fascinating dashboards by... Continue Reading
Cisco Webex is a powerful tool for remote collaboration. Use MetricFire’s Hosted Grafana to... Continue Reading

If you use Prometheus for time-series monitoring, you’ll need to learn PromQL. Here’s what... Continue Reading

API monitoring gives you control over API behavior. Get more from your API monitoring... Continue Reading

Network monitoring is key to a company’s ongoing productivity and growth. MetricFire can help... Continue Reading

Network monitoring is essential to improve your system’s efficiency. Use MetricFire's Graphite to get... Continue Reading

Take a look at Microservice architectures, their benefits, and how MetricFire's Prometheus can help... Continue Reading
This article discusses six best practices for Cisco network monitoring. Also use MetricFire to... Continue Reading

MetricFire specializes in monitoring systems like hybrid cloud with it’s Hosted Prometheus and Grafana,... Continue Reading

Graphite is one of the most useful tools to monitor cloud server performance. MetricFire's... Continue Reading

An overview of what is Grafana, its features and data sources. By using MetricFire's... Continue Reading
An article on how time-consuming running your own Graphite can be. Hence, use MetricFire's... Continue Reading
Reduce your EC2 costs by implementing the MetricFire CloudWatch monitoring integration. Use MetricFire and... Continue Reading
Use Heroku metrics as an add-on rather than for your monitoring. MetricFire's Hosted Graphite... Continue Reading

Solve your Graphite dropping metrics with these quick solutions. Use MetricFire's Hosted Graphite to... Continue Reading
Monitor your AWS with Hosted Graphite and Grafana by MetricFire. See all of your... Continue Reading
Use MetricFire for network monitoring. MetricFire is a SolarWinds alternative built in open source... Continue Reading
Get a practical guide on Kubernetes namespaces and how to work with them. Monitor... Continue Reading
Take a look at MetricFire vs. Datadog in terms of pricing, agents, dashboards, integrations,... Continue Reading
Learn the best ways to send metrics to MetricFire, and get your metrics into... Continue Reading
See Grafana vs. Chronograf on pricing, features, and overall function of the products. Continue Reading
MetricFire is moving our backend to TimescaleDB, hosted on AWS. This will improve latency,... Continue Reading

Dive deep into AWS costs and see how MetricFire can reduce your CloudWatch spend... Continue Reading
See a real example of monitoring MongoDB performance. Get the essentials on monitoring MongoDB,... Continue Reading

Prometheus is a time-series metrics monitoring tool that comes with everything you need for... Continue Reading
If you are a part of an engineering organization it is highly likely that... Continue Reading

Take a look at a list of top 5 API monitoring tools, and look... Continue Reading

Your monitoring system provides a comprehensive overview of any infrastructure. This centralization of data... Continue Reading
Docker is an open-source platform used for running containers. Read here to understand the... Continue Reading
Observability combines the use of metrics, logs, and tracing to give a broader understanding... Continue Reading
Hosting your own Graphite and Grafana monitoring system is tough. This article looks at... Continue Reading
Should you run and maintain open source monitoring software on your own, or should... Continue Reading
Monitoring your dockers is essential to keep the applications they host, healthy and efficient.... Continue Reading

Learn how to monitor Elasticsearch instances using Graphite and Grafana. Let's also see how... Continue Reading

Monitoring is an essential tool, but your time and budget are limited. How can... Continue Reading
There are two popular tools for application monitoring, Graphite and SolarWinds. Let's look into... Continue Reading
Data is not useful unless we can take action. Learn how you can visualize... Continue Reading
Compare Hosted Graphite and AppDynamics on market position, price, and core strengths Continue Reading
Compare Graphite and Datadog on market position, price, and key strengths. Continue Reading
Compare Graphite and ELK on pricing, market position, and key strengths. Continue Reading
Compare Hosted Graphite and Nagios on pricing, market position, and key strengths. Continue Reading
Compare Graphite and New Relic on market positioning, pricing, and core strengths. Continue Reading
Compare Graphite and Zabbix on market position, pricing, and key strengths. Continue Reading

Take a look at the difference between webhooks and API. Continue Reading
MetricFire can help you design a cloud data warehouse for your big data to... Continue Reading

Monitoring servers, applications, networks, or any other part of the IT infrastructure is important... Continue Reading

Let's compare the most popular server-monitoring solutions available today. We'll look at how you... Continue Reading
Look at Continuous Delivery systems for Kubernetes applications. Learn how to monitor your CD... Continue Reading

Here we will dive deep into various continuous integration stages and discuss a production... Continue Reading
MetricFire's Hosted Prometheus is built on Prometheus. Users can have both open-source and enterprise-level... Continue Reading

Get started on understanding CI/CD pipelines for Kubernetes applications. Take a look at the... Continue Reading
Find out how to send data from AWS CloudWatch to MetricFire to reduce costs... Continue Reading

Learn how to optimize Docker images to make your images light, portable, and to... Continue Reading
Hear what MetricFire customers have to say about MetricFire. Continue Reading

MetricFire offers a complete ecosystem of end-to-end infrastructure monitoring made of 3 services: Prometheus,... Continue Reading

Hosted Graphite announced its expansion with a new service: MetricFire, it adds Hosted Prometheus... Continue Reading

Step by step tutorial on how to set up Prometheus and Grafana in MetricFire.... Continue Reading
Follow this step by step tutorial to set up the Hosted Graphite agent and... Continue Reading

Hosted Graphite uses API to connect your key services with your monitoring platform. Learn... Continue Reading
Monitor IoT with Prometheus, Grafana and Graphite. This article is a tutorial on how... Continue Reading
See the top 5 monitorama talks from 2019. Continue Reading
Understand the benefits of using Kubernetes or AWS ECS. Understand how they're different, and... Continue Reading

We're here to make sure you can get the sustainable monitoring that is a... Continue Reading
See how to set up CircleCI with Hosted Graphite so you can see the... Continue Reading

Learn how to get your Alerts sent to you via PagerDuty. Continue Reading

Check out how Github sends events to Hosted Graphite via webhooks, and how the... Continue Reading

There are four kinds of Grafana plugins. Datasource, backend, panel, and app plugins. Learn... Continue Reading

Compare Grafana and Chronograf on market position, pricing, and core strengths. Continue Reading
Get Hosted Graphite running on an Arch Linux machine using collectd. See what it... Continue Reading
Here, we break down the most important distinctions and look at how the experience... Continue Reading
Get to know the best server monitoring tools. Choose from open source, hosted, and... Continue Reading
Use webhooks to set up an alert notification channel on Slack. Continue Reading
Compare Prometheus and Nagios on market position, pricing, and core strengths. | The MetricFire... Continue Reading

Orchestrating containers on Docker requires a strong foundation in Kubernetes Networking. Learn the different... Continue Reading

We often see customers coming to MetricFire from SolarWinds to get more control over... Continue Reading