
Table of Contents
Great systems are not just built. They are monitored.
MetricFire runs Graphite and Grafana as a fully managed service for growing engineering teams, taking care of storage, scaling, and version updates so your team doesn't have to. Plans start at $19/month, billed per metric namespace rather than per host, and include engineer-staffed support. Integrations work natively with Heroku, AWS, Azure, and GCP, and data is stored with 3× redundancy in SOC2- and ISO:27001-certified data centres.
Introduction
Apache Zookeeper is a distributed coordination tool that helps keep large-scale systems in sync. It’s the backbone for managing leader elections, service discovery, and metadata storage in projects like Kafka, Hadoop, and Elasticsearch. Think of it as a highly available traffic controller for distributed apps, ensuring everything runs smoothly.
Since so many critical services can depend on Zookeeper, monitoring it is a must. If request latency spikes, connections pile up, or the data tree grows out of control, it can ripple through your entire infrastructure. Keeping an eye on key metrics like latency, active connections, and leader status helps spot issues early, optimize performance, and prevent downtime. In short, if Zookeeper is happy, your distributed apps are happy - and that’s why monitoring matters!
In this guide, we'll detail how to install Zookeeper and OpenTelemetry Contrib to collect and forward performance metrics to a datasource.
Install and Configure Zookeeper
If you're already running an instance of Zookeeper in your production or test environment, you can jump straight to the OTel configuration section. Otherwise, the following section provides a quick setup guide to install and run Zookeeper in a Linux environment.
Install and Run the Zookeeper System Package (Linux)
sudo apt install -y zookeeper zookeeperd

sudo systemctl restart zookeeper
sudo systemctl status zookeeper
Confirm that it's listening on default port :2181 and check status:
netstat -tulnp | grep :2181

echo "stat" | nc localhost 2181
NOTE: The default configuration is for a standalone node - but if you want to configure a cluster you can update your config file, typically located at: /etc/zookeeper/conf/zoo.cfg
Now just add it to your system PATH and grant permissions for it to write log files:
export PATH=$PATH:/usr/share/zookeeper/bin
sudo chmod -R 777 /var/log/zookeeper
Access the Interactive Zookeeper CLI
The Zookeeper interactive CLI (zkCli.sh) is a handy tool for exploring and managing Zookeeper in real time. You can use it to create and modify znodes, check server status, and troubleshoot issues without needing extra scripts or clients.
zkCli.sh -server 127.0.0.1:2181
Expected Output:
Connecting to 127.0.0.1:2181
Welcome to ZooKeeper!
JLine support is enabled
[zk: 127.0.0.1:2181(CONNECTED) 0]
Create a test node named mytest:
create /mytest "HelloZookeeper"
Verify the /mytest node and retrieve it's value:
ls /

get /mytest
Install and Configure OpenTelemetry
OpenTelemetry as a Collector has built-in Receiver plugins for HAProxy, NGINX, PostgreSQL, Redis, MongoDB, Kafka, Elasticsearch, RabbitMQ and many more! These Receivers pull key performance metrics directly from your services with no manual parsing or custom scripts needed. This article assumes you're already using OpenTelemetry in your technology stack, but below are examples of how to install and configure otelcol-contrib to collect system-level metrics and export them to a storage endpoint.
Install OpenTelemetry Collector Contrib (Linux)
/etc/otelcol-contrib/Ubuntu/Debian (AMD)
wget https://github.com/open-telemetry/opentelemetry-collector-releases/releases/download/v0.119.0/otelcol-contrib_0.119.0_linux_amd64.deb

sudo dpkg -i otelcol-contrib_0.119.0_linux_amd64.deb
RedHat/CentOS (AMD)
wget https://github.com/open-telemetry/opentelemetry-collector-releases/releases/download/v0.119.0/otelcol-contrib_0.119.0_linux_amd64.rpm

sudo rpm -ivh otelcol-contrib_0.119.0_linux_amd64.rpm
Confirm Installation
otelcol-contrib --version
Configure the Zookeeper Receiver and Carbon Exporter
The Zookeeper Receiver in OpenTelemetry collects connection performance metrics, processes them, and forwards them to your exporter of choice.
The Carbon Exporter takes those metrics and ships them straight to Graphite-compatible backends, making it easy to integrate OTel into existing monitoring stacks with minimal setup.
If you're not currently hosting your own Graphite data source, start a 14-day free trial with Hosted Graphite by MetricFire to continue following along with this example!
A MetricFire account will provide the Graphite data source and include Hosted Grafana as a visualization tool - along with robust Alerting, Integrations, and Team features.
- First, find the configuration file generally located at: /etc/otelcol-contrib/config.yaml and open it in your preferred text editor.
- Then you can either replace the file, or add the following sections to your current config.
- Be sure to include your HG-API-KEY, and server HOSTNAME.
zookeeper:
  endpoint: "localhost:2181"
  collection_interval: 20s
  initial_delay: 1s

processors:
  batch: {}

  metricstransform:
    transforms:
      - include: ".*"
        match_type: regexp
        action: update
        new_name: "<HG-API-KEY>.opentel.$$0"
        operations:
          - action: add_label
            new_label: host
            new_value: <HOSTNAME>

exporters:
  carbon:
    endpoint: "carbon.hostedgraphite.com:2003"
    timeout: 10s

service:
  pipelines:
    metrics:
      receivers:
        - snowflake
      processors:
        - batch
        - metricstransform
      exporters:
        - carbon
Now, just save the file and restart the otelcol-contrib service:
sudo systemctl restart otelcol-contrib
sudo systemctl status otelcol-contrib
Or you can serve the file manually - to troubleshoot potential configuration errors:
otelcol-contrib --config /etc/otelcol-contrib/config.yaml
Ship Tagged Graphite Metrics
Within two minutes of restarting the otelcol-contrib service, a set of Tagged Graphite metrics will be forwarded to your Hosted Graphite account (with the opentel.zookeeper prefix).
Why does OpenTelemetry export Tagged metrics to Carbon?
- "Because it's core model aligns more with Prometheus-style 'labels' than Graphite's 'dot notation' formatting. Instead of flattening data into long metric names, it preserves the labels by using Graphite tags, which also enables richer filtering in your Graphite backend."
Now you can locate these Tagged Metrics in the Hosted Graphite Tag Search UI - under the host tag:
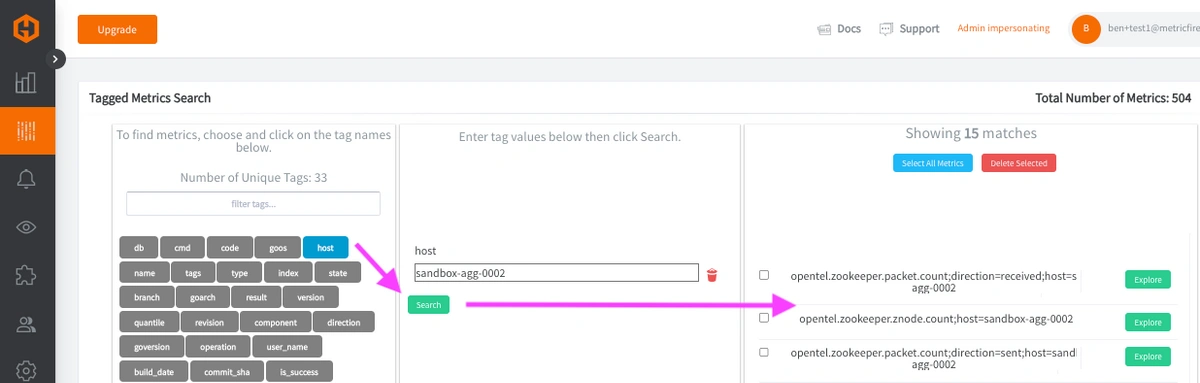
Otherwise, you can configure a different exporter to forward metrics to another data source.
Run Some Tests in Zookeeper
The following tests will simulate some real-world Zookeeper activity, to observe how different operations affect your metric values.
Create and Delete Nodes to Measure Data Growth
This creates 100 znodes, and will impact your zookeeper.znode.count and zookeeper.data_tree.size metrics:
for i in {1..100}; do
  zkCli.sh -server 127.0.0.1:2181 create /test$i "LoadTest"
done
Delete nodes to reset the data tree and free up MEM:
for i in {1..100}; do
  zkCli.sh -server 127.0.0.1:2181 delete /test$i
done
Simulate a High Client Load
Trigger multiple client connections to impact your zookeeper.connection.active metric (measures how many concurrent clients Zookeeper can handle before performance degrades):
for i in {1..20}; do
  zkCli.sh -server 127.0.0.1:2181 ls / &
done
Stress Testing File Descriptors
This will impact your zookeeper.file_descriptor.open metric, which is useful for diagnosing resource exhaustion issues:
for i in {1..50}; do
  zkCli.sh -server 127.0.0.1:2181 ls / &
done
Simulate a Heavy Disk Load
Your zookeeper.fsync.exceeded_threshold.count metric will be affected if disk writes take too long:
dd if=/dev/zero of=/tmp/testfile bs=1M count=10000
Use Hosted Graphite by MetricFire to Create Custom Dashboards and Alerts
Hosted Graphite by MetricFire is a monitoring platform that enables you to gather, visualize and analyze metrics and data from servers, databases, networks, processes, devices, and applications. Using MetricFire, you can effortlessly identify problems and optimize resources within your infrastructure.
Metrics sent to the public carbon endpoint will be timestamped, and aggregated into the Hosted Graphite backend.
-
OpenTelemetry metrics will be sent and stored in the Graphite Tag format of: my.series;tag1=value1;tag2=value2 metric_value (timestamp)
-
The tags provide a filtering option, making the metrics efficient to query
-
Metrics are stored in your Hosted Graphite account for two years, and you can use them to create custom Dashboards and Alerts.
Build Custom Dashboards in MetricFire's Hosted Grafana
In the Hosted Graphite UI, navigate to Dashboards and select + New Dashboard to create a new visualization.
Then go into Edit mode and use the Query UI to select a graphite metric path (the default data source will be HostedGraphite if you are accessing Grafana via your HG account).
NOTE: To query Tagged Graphite metrics, you must apply the seriesByTag Graphite function.
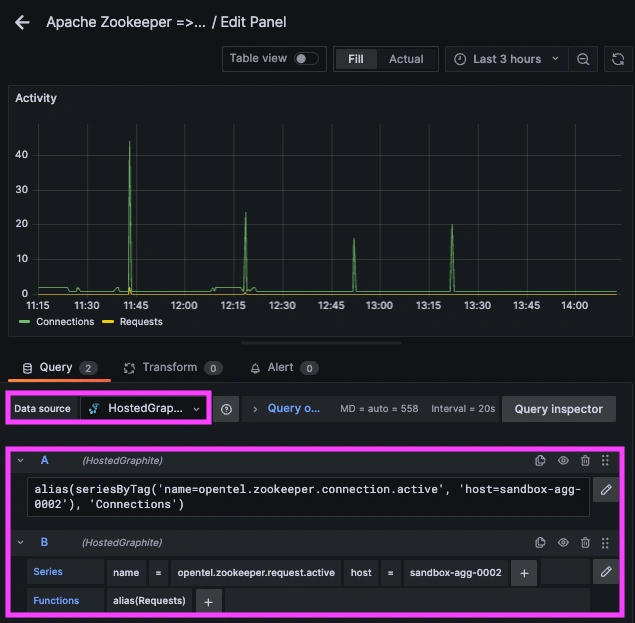
Grafana has many additional options to apply different visualizations, modify the display, set units of measurement, and some more advanced features like configuring dashboard variables and event annotations. Here is an example of a production-level dashboard that uses metrics collected by the OTel Zookeeper Receiver:
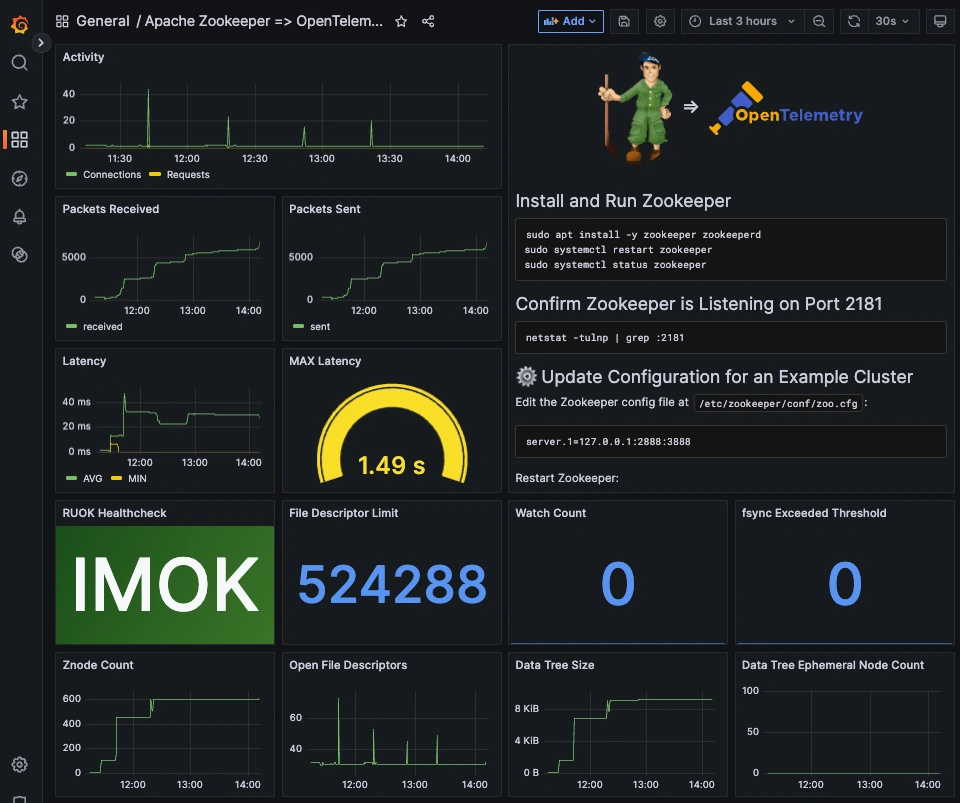
See the Hosted Graphite Dashboard docs for more details around building custom Grafana visualizations.
Creating Graphite Alerts
In the Hosted Graphite UI, navigate to Alerts => Graphite Alerts to create a new alert. Name the alert and add a Tagged Zookeeper Metric to the alerting metric field:
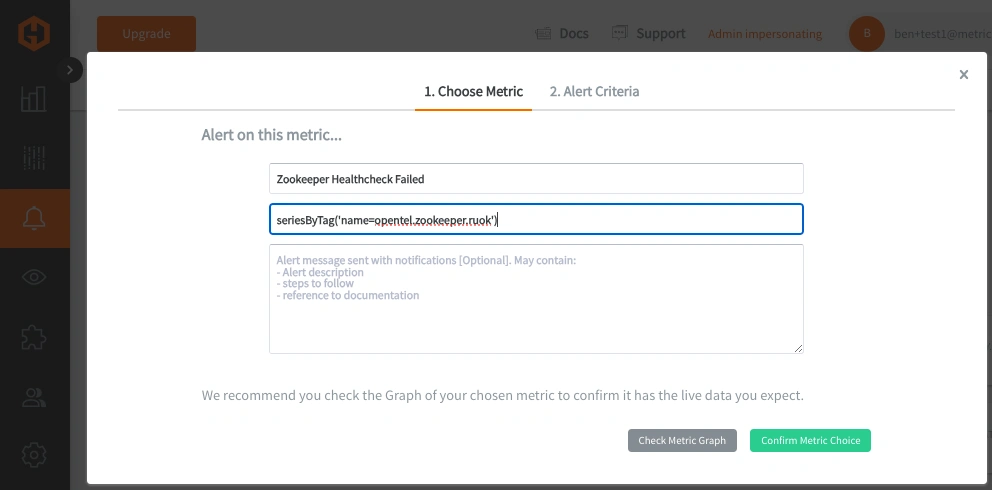
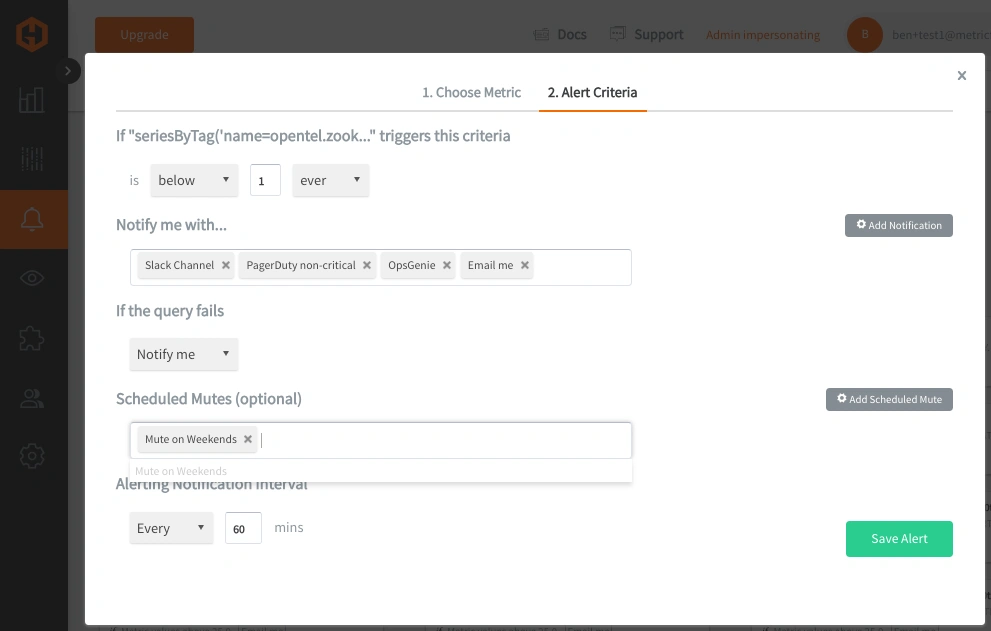
Then, select the Alert Criteria tab to set a threshold and select a notification channel. The default notification channel will be the email you used to sign up for the Hosted Graphite account. Still, you can easily configure channels for Slack, PagerDuty, Microsoft Teams, OpsGenie, custom webhooks and more. See the Hosted Graphite Notification Channels docs for more details:
Conclusion
Monitoring your Zookeeper environment is crucial because it sits at the core of many distributed systems, managing metadata, leader elections, and service coordination. If Zookeeper slows down, runs out of resources, or fails entirely, it can cause cascading failures across your entire infrastructure. By keeping an eye on key metrics - like latency, connection counts, znodes, and file descriptors to can catch performance issues early, optimize resource usage, and ensure high availability. A well-monitored Zookeeper setup means fewer surprises, better stability, and a smoother-running distributed system.
Sign up for the free trial and begin monitoring your infrastructure today. You can also book a demo and talk to the MetricFire team directly about your monitoring needs.

