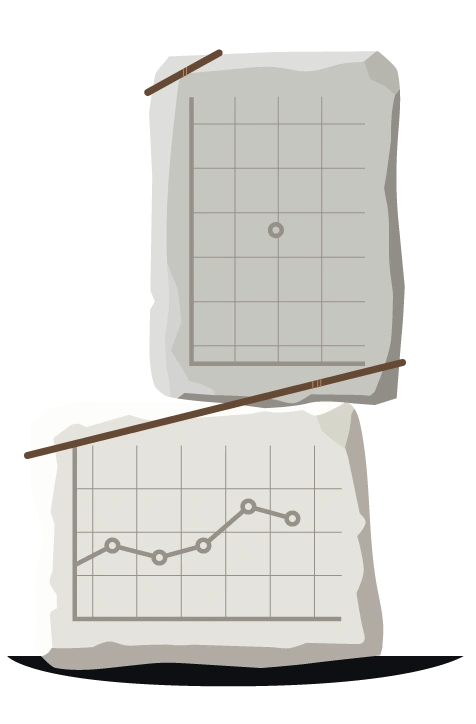
Time series data is a unique collection of name-value data collected over time intervals recording change over time. Any kind of data plotted over time is time series data.
The data can then be aggregated, graphed to analyze, and acted on. When plotted on a graph, the X-axis will show the time stamps of when the data was collected and the Y-axis will show data values at that point in time.
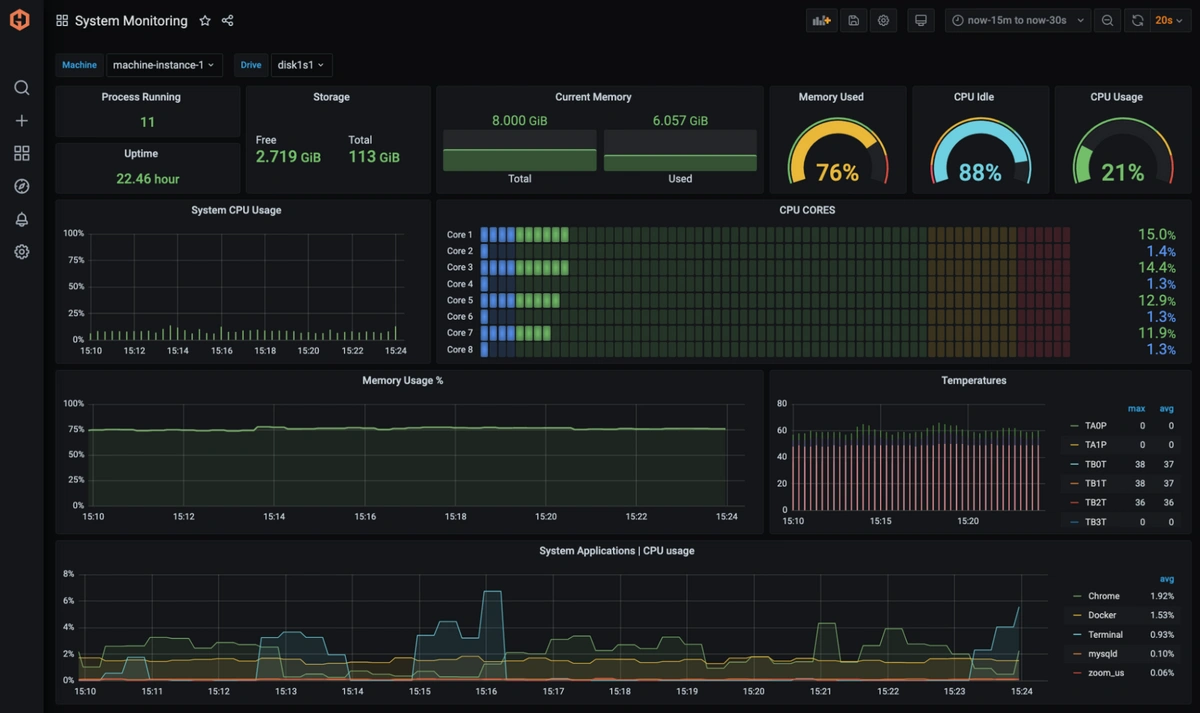
The best way of observing trends, highlighting issues within your data and informing meaningful decisionsis, is to use graphs to monitor your time series metrics.
There are a number of other examples of time series metrics useful for any engineer looking to understand their infrastructure including:

CPU, memory, storage

AWS, Heroku, Azure, Google Cloud

Queries, performance, availability, workload

SNMP metrics, switches, bandwidth, and errors
It is important to differentiate between ‘data points’ and ‘metrics’ when discussing time series data.
A datapoint is a single measurement of data that is collected during monitoring.
A metric is a unique time-series collection of name-value data. In other words, a metric is a unique namespace that you can send data to or query data from.
Important: In terms of billing, MetricFire's plans are based on the number of unique time series metrics that you send. You are not charged based on data points per second (DDPS). However, each plan has a DDPS limit which is half your total metrics. If you need more DDPS, then you'll need to upgrade your plan.
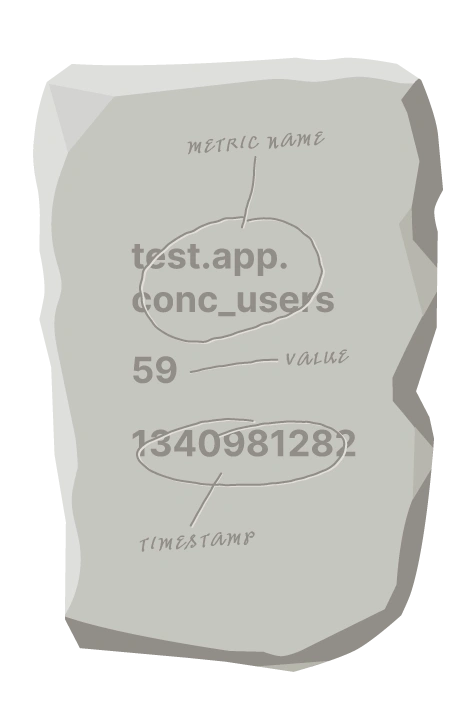
Graphite time series data needs to be ingested in the format of the Metric Name, The Value and the Time Stamp. This dot notation format allows for the querying of metrics.
A period-delimited path, such as ‘servers.memory.free’. The periods will turn each path component into a sub-tree.
An integer or floating point number. Hosted Graphite can only ingest numeric data.
A UNIX timestamp is optional and if no timestamp is provided, the current time will be assumed as the time of ingestion. Specifying a UNIX timestamp is good for sending historical data, or when you need the timestamps to match exactly with the timestamps on your system logs
Understanding the metric data format is important because this is how MetricFire’s Hosted Graphite carbon endpoint is able to accept data.
There are several ways that you can get started with sending Graphite Format Metrics to Hosted Graphite by MetricFire for visualisation in dashboards. Check out our video tutorial or see our documentation for step-by-step guides on sending metrics to a Hosted Graphite account.

Because our system is your system
