Graphite and Prometheus are time series monitoring systems for monitoring networks, servers, other infrastructure, and applications. Prometheus might be the current trend, but Graphite is still an industry-standard solution.
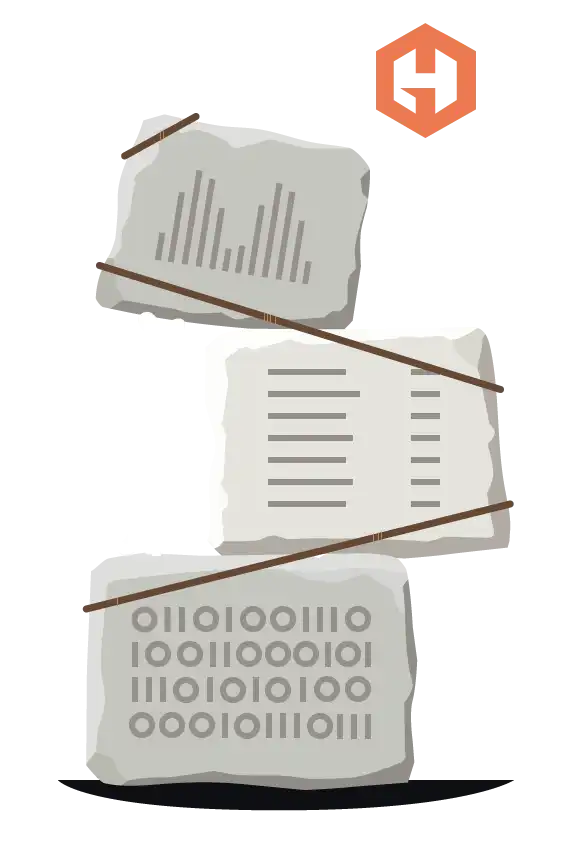
Graphite is an enterprise-ready monitoring tool that runs on hardware or Cloud infrastructure. Teams use Graphite to
track the performance of their websites, applications, systems, business services, and networked servers. Graphite
stores numeric time-series data and uses this data to render graphs on demand. It is a push-based monitoring software,
meaning that it gathers metrics through data that is already expressed.
The architecture of Graphite has three core components:
The primary backend daemon of Graphite. Its primary work is to listen for time series data sent over the common set of allowed protocols. Any data that is sent to Graphite is sent to its carbon and carbon-Relay daemons, which are entitled to receive and manage the data.
A fixed-size database purpose to RRD (round-robin-database). It provides fast, reliable storage of numeric data over time. Whisper allows for higher resolution (seconds per point) of recent data to degrade into lower resolutions for long-term retention of historical data.
A Django web application that uses Cairo to render graphs on-demand. The webapp offers ways to create and display graphs and render metric queries. With Hosted Graphite, we provide simple, insightful dashboards to display your metrics.
Metrics are amassed and stored in the whisper, Graphite’s database. With Graphite, businesses can seamlessly keep,
monitor, and visualize data, plus it can also send alerts on specific events.
With Graphite, you can monitor:
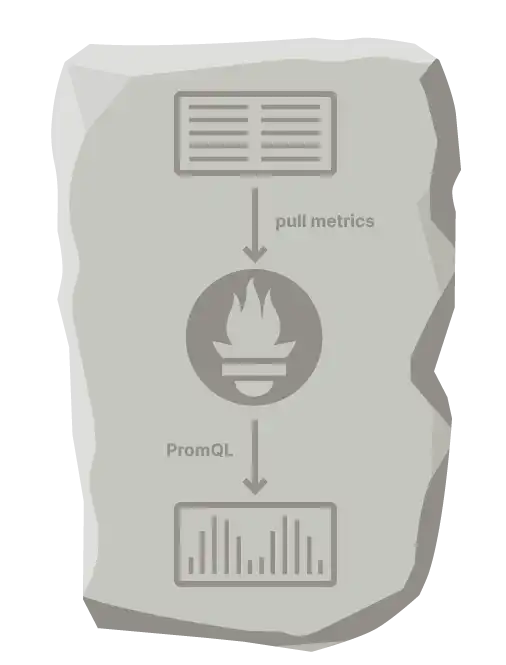
Prometheus is also an open-source monitoring solution for collecting and aggregating metrics as time series data. It
uses a pull-based monitoring software meaning that it connects to target endpoints to request metrics via HTTP; the
service being monitored is responsible for serving the metrics on request. It was made by SREs for SREs which presumes a
higher degree of specialized knowledge.
Components of Prometheus include:
Create an instance, run it and maintain it to configure service discovery which will tell Prometheus where to look for the metrics.
Local on-disk time series database to store ingested metrics grouped into blocks of two hours for 15 days by default.
Users explore metrics using the Prometheus query language (PromQL) and draw simple graphs.
Graphite’s functions are straightforward. We will even teach it to you.

Because our system is your system.
