

Table of Contents
Great systems are not just built. They are monitored.
MetricFire runs Graphite and Grafana as a fully managed service for growing engineering teams, taking care of storage, scaling, and version updates so your team doesn't have to. Plans start at $19/month, billed per metric namespace rather than per host, and include engineer-staffed support. Integrations work natively with Heroku, AWS, Azure, and GCP, and data is stored with 3× redundancy in SOC2- and ISO:27001-certified data centres.
Introduction
Podman is a modern, open-source container engine developed by Red Hat that serves as a powerful alternative to Docker. It's designed with security, composability, and simplicity in mind. Here’s why it stands out:
-
Daemonless architecture: Unlike Docker, Podman does not require a long-running background service. Each container command is executed as a separate process, which makes it lightweight and more secure.
-
Rootless containers: Podman can run containers without root privileges. This enhances security, especially on shared or production systems.
-
Pod support: Podman introduces a native concept of pods (groups of containers that share resources), aligning more closely with how Kubernetes operates.
- Docker CLI compatible: You can alias docker to podman and run many Docker-compatible commands without changes.
-
Secure and production-ready: Because of its rootless capabilities and fine-grained control, Podman is often preferred in enterprise or CI/CD environments.
In this guide, we'll detail how to use the OpenTelemetry Agent to collect Podman performance metrics and export them to a datasource.
1. Install and Configure Podman (macos)
On macOS, Podman runs inside a lightweight Linux VM using Apple’s built-in hypervisor. This is a great alternative to Docker Desktop, especially for Apple Silicon (M1/M2/M3) users who want to avoid additional licensing or overhead. Macos is also a common operating system for dev testing in virtual environments but the following steps can also be accomplished easily for Linux as well.
Use Homebrew (macOS package manager) to install the Podman CLI and underlying virtualization tools:
brew install podman
Podman on macOS runs containers inside a managed Linux VM. The following commands create and start that VM:
podman machine init
podman machine start
Once the Podman VM is running, SSH into it to manage containers and configure OpenTelemetry:
podman machine ssh
You are now inside a Linux shell environment (core@localhost) and can list all running containers to verify that Podman is exposing live container stats correctly:
podman ps
Note the container ID of any actively running container and curl the stats endpoint to confirm a successful metric output:
curl --unix-socket /run/podman/podman.sock \
  http://localhost/v3.3.1/libpod/containers/<container_id>/stats?stream=false
Replace <container_id> with the actual ID from podman ps. You should receive a JSON payload with fields like cpu_stats, memory_stats, network_stats, etc.
2. Create an OpenTelemetry Config File with the Podman Receiver
Create a file in your Podman shell named otel-config.yaml, copy the following contents into the file (make sure to add your HG API Key and a hostname), include the Podman Receiver & default endpoint, and save:
receivers:
  podman_stats:
    endpoint: "unix:///run/podman/podman.sock"
    collection_interval: 10s

processors:
  batch: {}
  metricstransform:
    transforms:
      - include: ".*"
        match_type: regexp
        action: update
        new_name: "<HG-API-KEY>.opentel.$$0"
        operations:
          - action: add_label
            new_label: host
            new_value: <HOSTNAME>

exporters:
  carbon:
    endpoint: "carbon.hostedgraphite.com:2003"
    timeout: 10s

service:
  pipelines:
    metrics:
      receivers:
        - podman_stats
      processors:
        - batch
        - metricstransform
      exporters:
        - carbon
Copy the config to your /tmp directory, to get around potential permission errors:
cp ~/otel-config.yaml /tmp/otel-config.yaml
chmod 644 /tmp/otel-config.yaml
NOTE: you need a Hosted Graphite API key to follow along with the above configuration. If you don't already have an account, you can sign up for free HERE to get an API Key. Otherwise, you can configure OpenTelemetry to export to another backend.
3. Run the OpenTelemetry Collector Manually (Using Podman)
Rather than installing the OpenTelemetry Collector directly inside the Podman VM, we run it as a container using podman run. This is because the VM runs Fedora CoreOS, a minimal and immutable operating system that doesn’t support traditional package installation (it lacks tools like apt or yum). Running the Collector as a container keeps the system clean, avoids conflicts, and aligns with Podman’s container-first philosophy. It also allows us to easily mount the required configuration file and the Podman API socket directly into the container, giving the Collector access to metrics about other running containers. This approach is flexible and ideal for monitoring container environments. To launch it, we use the following command:
sudo podman run --rm --privileged \
  -v /tmp/otel-config.yaml:/etc/otelcol-contrib/config.yaml:ro,Z \
  -v /run/podman/podman.sock:/run/podman/podman.sock:ro,Z \
  otel/opentelemetry-collector-contrib:0.118.0 \
  --config /etc/otelcol-contrib/config.yaml
The OTel container should now be running with no errors, and Podman stats will instantly be collected and exported to the configured data source.
Ship Tagged Graphite Metrics
Within two minutes of restarting the otelcol-contrib service, a set of Tagged Graphite metrics will be forwarded to your Hosted Graphite account (with the opentel prefix).
Why does OpenTelemetry export Tagged metrics to Carbon?
- "Because it's core model aligns more with Prometheus-style 'labels' than Graphite's 'dot notation' formatting. Instead of flattening data into long metric names, it preserves the labels by using Graphite tags, which also enables richer filtering in your Graphite backend."
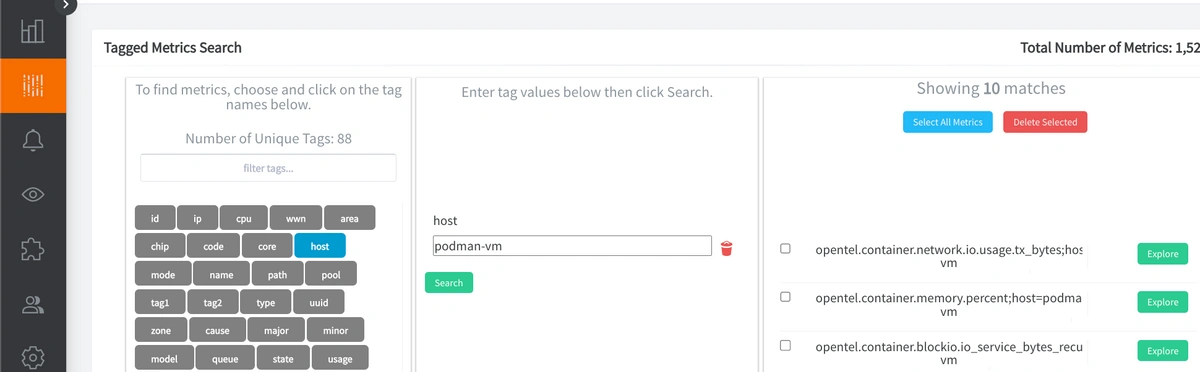
Now you can locate these Tagged Metrics in the Hosted Graphite Tag Search UI (in this example they'll appear under the host, source, or region tags):
4. Use Hosted Graphite by MetricFire to Create Custom Dashboards and Alerts
Hosted Graphite by MetricFire is a monitoring platform that enables you to gather, visualize, and analyze metrics and data from servers, databases, networks, processes, devices, and applications. Using MetricFire, you can effortlessly identify problems and optimize resources within your infrastructure. Metrics sent to the public carbon endpoint will be timestamped and aggregated into the Hosted Graphite backend.
-
OpenTelemetry metrics will be sent and stored in the Graphite Tag format of: my.series;tag1=value1;tag2=value2 metric_value (timestamp)
-
The tags provide a filtering option, making the metrics efficient to query
-
Metrics are stored in your Hosted Graphite account for two years, and you can use them to create custom Dashboards and Alerts.
Build Custom Dashboards in MetricFire's Hosted Grafana
In the Hosted Graphite UI, navigate to Dashboards and select + New Dashboard to create a new visualization.
Then go into Edit mode and use the Query UI to select a graphite metric path (the default data source will be HostedGraphite if you are accessing Grafana via your HG account).
NOTE: To query Tagged Graphite metrics, you must apply the seriesByTag Graphite function. Here's an example of a dashboard built to display Podman stats:
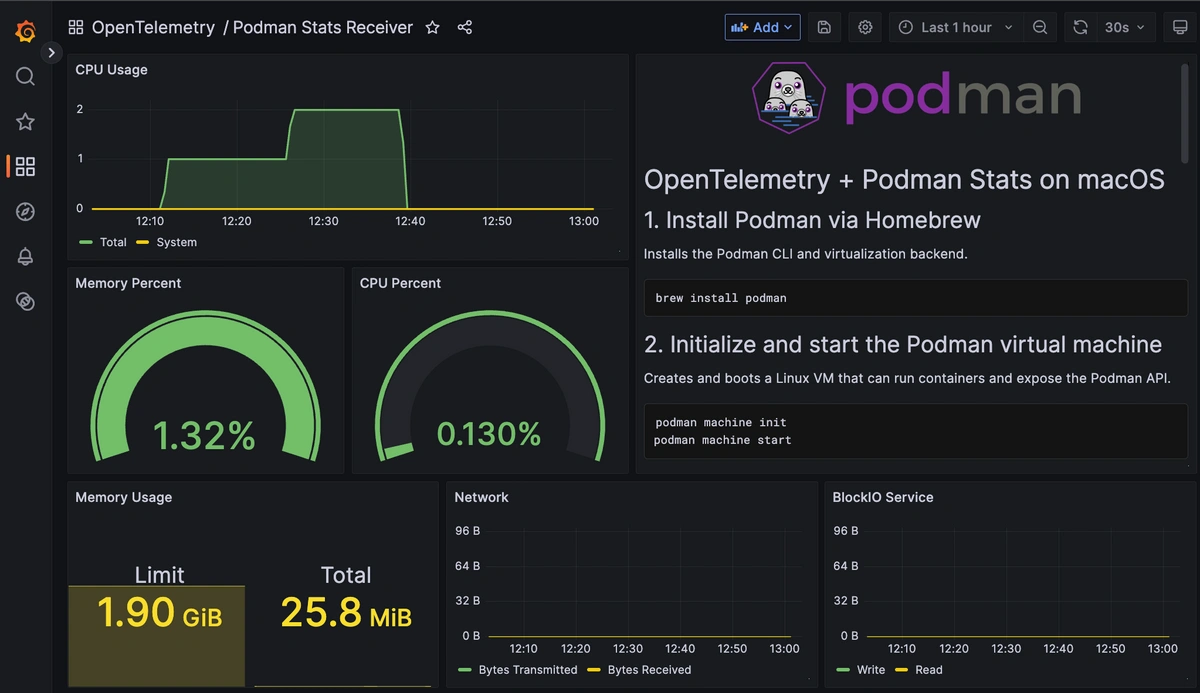
See the Hosted Graphite Dashboard docs for more details around building custom Grafana visualizations.
Conclusion
Podman is a great tool for developers who want a fast, secure way to test and run containers without the overhead of Docker. It’s daemonless, rootless by default, and runs in a lightweight Linux VM on macOS which makes it perfect for experimenting with services, debugging builds, or testing observability tools in an environment that behaves like production. Because it’s compatible with Docker, most workflows function right out of the box, but with added flexibility and better security. And just like any virtual environment, it’s important to monitor Podman’s performance. Whether you’re spinning up one service or simulating a full stack, keeping an eye on CPU, memory, and I/O helps you catch issues early, understand resource usage, and make smarter choices about scaling or optimization. In short: Podman makes local testing easy, and performance monitoring ensures it stays reliable.
Sign up for the free trial and begin monitoring your infrastructure today. You can also book a demo and talk to the MetricFire team directly about your monitoring needs.


