

Table of Contents
Great systems are not just built. They are monitored.
MetricFire runs Graphite and Grafana as a fully managed service for growing engineering teams, taking care of storage, scaling, and version updates so your team doesn't have to. Plans start at $19/month, billed per metric namespace rather than per host, and include engineer-staffed support. Integrations work natively with Heroku, AWS, Azure, and GCP, and data is stored with 3× redundancy in SOC2- and ISO:27001-certified data centres.
Introduction
MinIO is a high-performance, S3-compatible object storage server built for cloud-native applications. It’s open-source, lightweight, and incredibly fast which makes it a solution for developers who need to store and serve unstructured data like images, logs, or backups. Whether you’re building a self-hosted alternative to Amazon S3 or running MinIO as part of a local development pipeline, it fits into modern containerized environments. But like any piece of infrastructure, it’s only as good as its uptime and responsiveness. Monitoring MinIO’s performance like storage utilization, S3 request throughput, and system health is critical for catching bottlenecks and scaling intelligently. Always remember that it's important to ensure your data layer never becomes the weak link in your architecture!
In this article, we'll detail how to use the Telegraf agent to collect, convert, and forward MinIO performance metrics to a FREE data source.
Step 1: Getting Started with the Telegraf Agent
Telegraf is a plugin-driven server agent built on InfluxDB that collects and sends metrics/events from databases, systems, processes, devices, and applications. It is written in Go, compiles into a single binary with no external dependencies, and requires a minimal memory footprint. Telegraf is compatible with many operating systems and has many helpful output plugins and input plugins for collecting and forwarding a wide variety of system performance metrics.
Installing and configuring Telegraf is easy, but we simplified this process further with our HG-CLI tool. Install the tool on any OS, run it in TUI mode, and enter your Hosted Graphite API key to get Telegraf up and running quickly!
- Install the HG-CLI tool:
curl -s "https://www.hostedgraphite.com/scripts/hg-cli/installer/" | sudo sh
- Run it in TUI mode:
hg-cli tui
Otherwise, you can configure a different telegraf output to forward metrics to another data source.
Step 2: Install and Configure MinIO
wget https://dl.min.io/server/minio/release/linux-amd64/minio
chmod +x minio
sudo mv minio /usr/local/bin/
Create a Data Directory and Fix Permissions
sudo mkdir -p /mnt/data
sudo chown -R $USER:$USER /mnt/data
Set Testing Environment Variables for MinIO
sudo tee /etc/default/minio > /dev/null <<EOF
MINIO_ROOT_USER=minioadmin
MINIO_ROOT_PASSWORD=minioadmin123
EOF
Run MinIO with Auth Disabled for Metrics
export $(grep -v '^#' /etc/default/minio | xargs)
export MINIO_PROMETHEUS_AUTH_TYPE=public

minio server /mnt/data --console-address ":9001"
Test the MinIO Metric Endpoint
While the service is running, test the endpoint from within another terminal window:
curl http://localhost:9000/minio/v2/metrics/cluster
You should see a successful output of metrics, e.g:
minio_cluster_capacity_raw_free_bytes{server="127.0.0.1:9000"} 1.779440746496e+12
Step 3: Configure the Telegraf Prometheus Input Plugin
Telegraf has many input plugins that can collect a wide range of data from many popular technologies and 3rd party sources. For this example, MinIO is publishing metrics to http://localhost:3100/metrics. These hold a Prometheus format and must be converted to a Graphite format as they are forwarded to the Hosted Graphite datasource (which was configured in the earlier steps).
First, open your Telegraf configuration file (generally located at /etc/telegraf/telegraf.conf), and add the following section:
[[inputs.prometheus]]
  urls = ["http://127.0.0.1:9000/minio/v2/metrics/cluster"]
  metric_version = 2
Additional Authentication
MinIO secures its Prometheus metrics endpoint by default so in most production-level use cases, you will need to configure a bearer token with the inputs.prometheus plugin. This is generally located in your /etc/minio/minio-prometheus.conf file. However, Telegraf won't parse the token from your conf file so you can store the raw token in a .txt file and point Telegraf to that file instead:
grep bearer_token /etc/minio/minio-prometheus.conf | cut -d' ' -f2 > /etc/telegraf/minio-token.txt
chmod 644 /etc/telegraf/minio-token.txt
[[inputs.prometheus]]
  urls = ["http://127.0.0.1:9000/minio/v2/metrics/cluster"]
  bearer_token = "/etc/telegraf/minio-token.txt"
  metric_version = 2
Manually Run Telegraf
Then save your changes and run the telegraf daemon using the below command. This will help you see if there are any configuration errors in the output:
telegraf --config /etc/telegraf/telegraf.conf
Now, Telegraf will be scraping the local /metrics endpoint and forwarding these metrics to your Hosted Graphite account. You can locate these metrics in the app Metrics UI (with the *prometheus.minio* prefix):
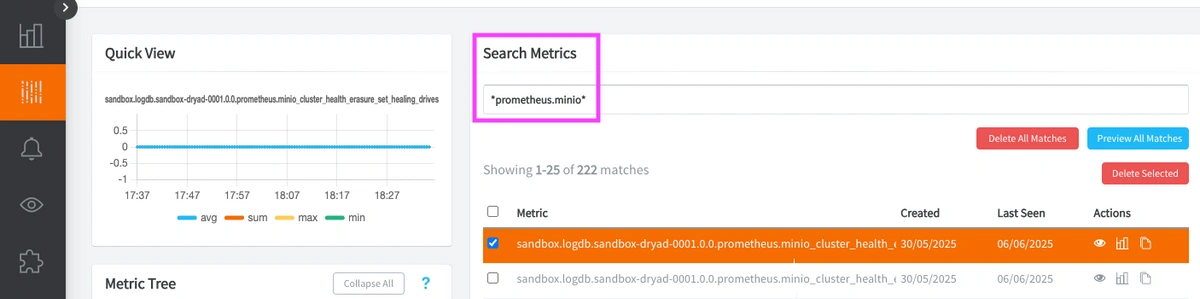
See the official GitHub repository for additional details and configuration options for the Prometheus input plugin.
Step 4: Use MetricFire to Create Custom Dashboards and Alerts
MetricFire is a monitoring platform that enables you to gather, visualize & analyze metrics and data from servers, databases, networks, processes, devices, and applications. Using MetricFire, you can effortlessly identify problems and optimize resources within your infrastructure. Hosted Graphite by MetricFire removes the burden of self-hosting your monitoring solution, allowing you more time and freedom to work on your most important tasks.
Once you have signed up for a Hosted Graphite account and used the above steps to configure your server(s) with the Telegraf Agent, metrics will be forwarded, timestamped, and aggregated into the Hosted Graphite backend. If you're dealing with complex data integration pipelines that feed metrics into your monitoring stack, Integrate.io provides low-code ETL and ELT capabilities to transform and move data across your infrastructure.
-
Metrics will be sent and stored in the Graphite format of: metric.name.path <numeric-value> <unix-timestamp>
-
The dot notation format provides a tree-like data structure, making it efficient to query
-
Metrics are stored in your Hosted Graphite account for two years, and you can use them to create custom Alerts and Grafana dashboards.
Build Custom Dashboards in Hosted Grafana
In the Hosted Graphite UI, navigate to Dashboards and select + New Dashboard to create a new visualization.
Then go into Edit mode and use the Query UI to select a graphite metric path (the default data source will be the HostedGraphite backend if you are accessing Grafana via your HG account).
The HG datasource also supports wildcard (*) searching to grab all metrics that match a specified path.
Now you can apply Graphite functions to these metrics like aliasByNode() to clean up the metric names, and scale() to make the time values more readable:
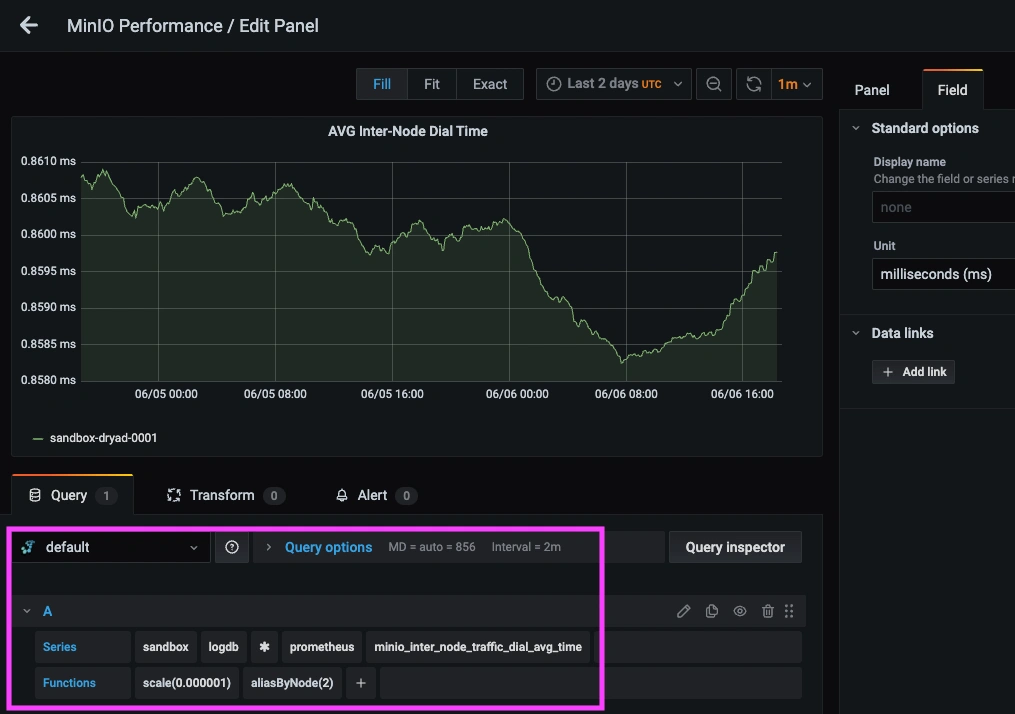
Grafana has many additional options to apply different visualizations, modify the display, set units of measurement, and some more advanced features like configuring dashboard variables and event annotations.
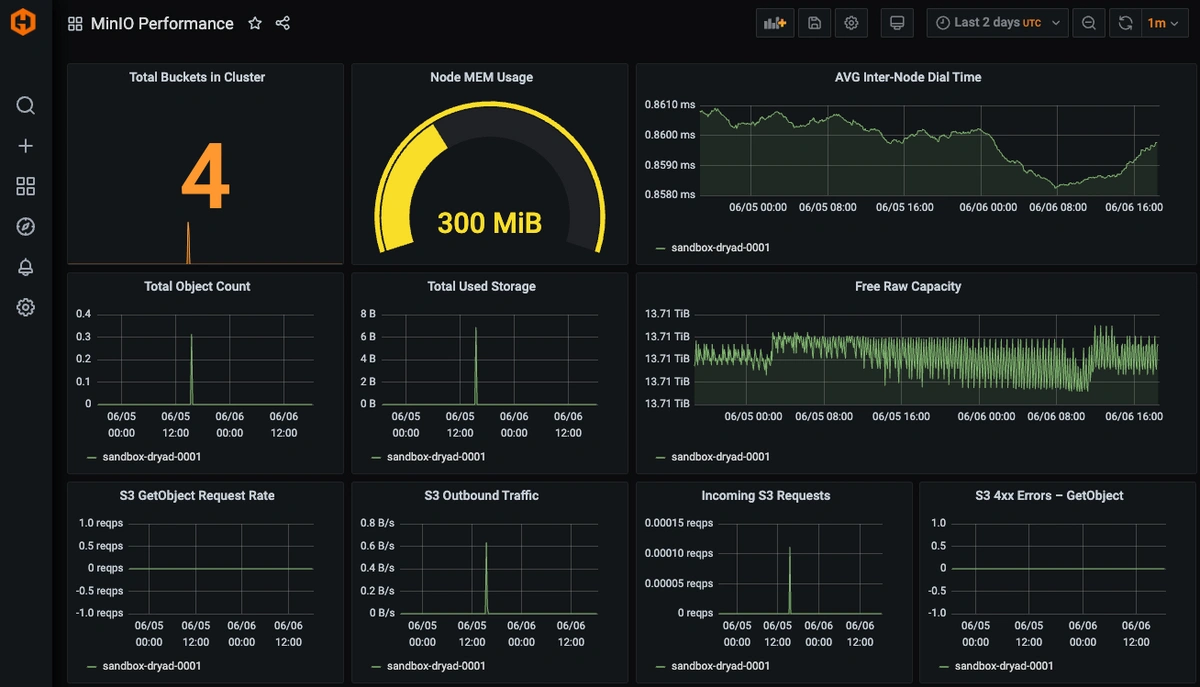
This is what a production-level MinIO Performance dashboard might look like:
Create Graphite Alerts
In the Hosted Graphite UI, navigate to Alerts => Graphite Alerts to create a new alert. Name the alert, add a query to the alerting metric field, and add a description of what this alert is (optional).
Then, select the Alert Criteria tab to set a value threshold and select a notification channel. The default notification channel will be the email you used to sign up for the Hosted Graphite account. However, you can easily configure channels for Slack, PagerDuty, Microsoft Teams, OpsGenie, custom webhooks, and more. This way you can receive a notification any time your metric values are outside of their expected bounds.
Please see the Hosted Graphite docs for more details on Alerts and Notification Channels.
Conclusion
Monitoring your MinIO instance is a safeguard against unexpected slowdowns, storage issues, or data access failures. By keeping a close eye on performance metrics, you give your team the visibility needed to proactively scale, troubleshoot, and maintain reliability. It’s a simple investment that pays off in uptime, developer confidence, and peace of mind.
Sign up for the free trial and begin monitoring your infrastructure today. You can also book a demo and talk to the MetricFire team directly about your monitoring needs.


