
Table of Contents
- Introduction
- Why You Should Monitor Add-ons, Not Just Your App
- Why Hosted Graphite Works Well with Heroku
- Step-by-Step: How to Monitor Add-ons with Hosted Graphite
- Best Practices for Monitoring Add-ons on Heroku
- Real-World Use Case: SaaS Teams with Redis and Postgres
- Conclusion: Observability for Add-ons Is Not Optional
Great systems are not just built. They are monitored.
MetricFire runs Graphite and Grafana as a fully managed service for small engineering teams, taking care of storage, scaling, and version updates so your team doesn't have to. Plans start at $19/month, billed per metric namespace rather than per host, and include engineer-staffed support. Integrations work natively with Heroku, AWS, Azure, and GCP, and data is stored with 3× redundancy in SOC2- and ISO:27001-certified data centres.
Introduction
Heroku's add-on ecosystem is one of its biggest strengths — allowing teams to bolt on databases, caching, logging, monitoring, and more in seconds. But for production systems, simply adding an add-on isn't enough.
If you're managing critical infrastructure like Postgres, Redis, or third-party services through Heroku add-ons, monitoring their performance and reliability is essential.
This guide explains how to set up custom, real-time monitoring for Heroku add-ons using Hosted Graphite by MetricFire, including how to send metrics, visualise performance, and configure alerts that help you stay ahead of issues.
In this article, we'll detail how to forward performance metrics from your Heroku dynos and select add-ons, to a Hosted Graphite backend.
Why You Should Monitor Add-ons, Not Just Your App
Heroku handles a lot of the infrastructure for you — but when something goes wrong with an add-on, it can silently degrade your app's performance or reliability.
Common risks you won't catch with logs alone:
- Your Redis connection count is near its limit
- Your Postgres database size is approaching quota
- A caching layer is serving stale data due to TTL misconfigurations
- An external webhook service is returning 500s and triggering retries
These aren't errors you'll necessarily see in app logs — but they will surface in your metrics, and early detection can mean the difference between a blip and a full-blown outage.
Why Hosted Graphite Works Well with Heroku
MetricFire's Hosted Graphite is a cloud-native monitoring platform with deep Heroku integration. It's ideal for engineering teams that want to:
- Monitor all their Heroku dynos and add-ons in one place
- Use Grafana dashboards without managing Grafana themselves
- Send custom metrics from apps or scripts
- Avoid the complexity and high costs of platforms like Datadog
With MetricFire, you can track system-level metrics (CPU, memory), custom metrics (queue depth, errors), and third-party add-on usage — all with minimal overhead.
Step-by-Step: How to Monitor Add-ons with Hosted Graphite
Step 1: Add Hosted Graphite as a Heroku Add-on
Hosted Graphite by MetricFire is a robust data storage backend that enables you to create custom dashboards and alerts using your data. Hosted Graphite manages a service that parses through your Heroku log-drain output, converts the data to the Graphite format, and forwards them to your Hosted Graphite account. You can then use these Graphite metrics to build custom dashboards and alerts. Additionally, you can store more than just Heroku metrics, which can give you visibility into multiple layers of your infrastructure under a single pane of glass.
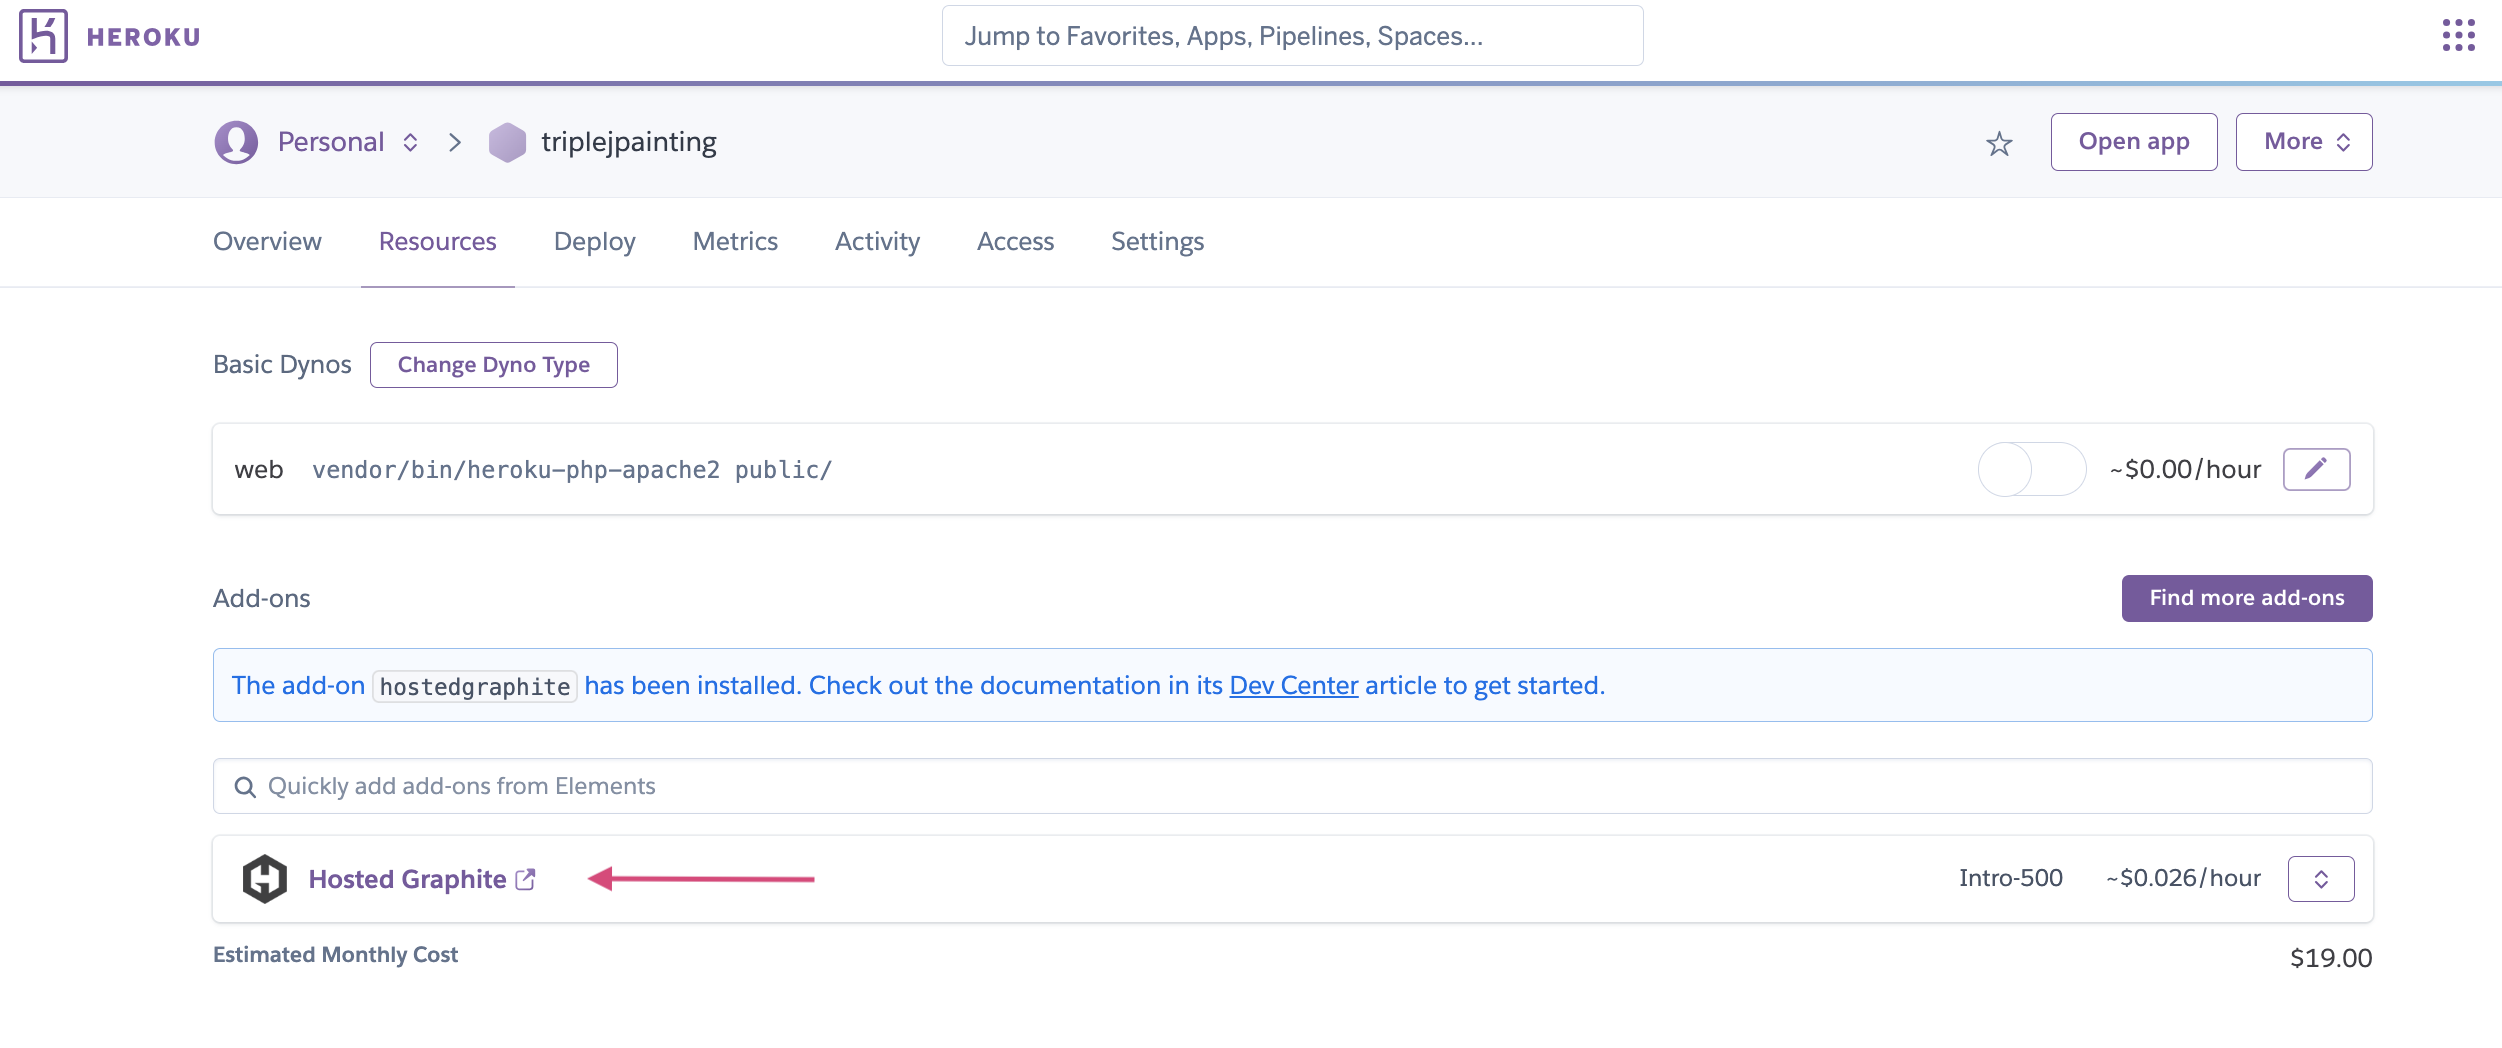
Heroku has an add-on for Hosted Graphite that can easily be enabled through the Heroku UI, or from a similar command from within the Heroku CLI:
In your Heroku project, run:
heroku addons:create hostedgraphiteThis provisions a Hosted Graphite account and starts sending built-in Heroku metrics (e.g., dyno memory, response times) to your Hosted Graphite dashboard.
You can access the dashboard with:
heroku addons:open hostedgraphiteOnce the Hosted Graphite add-on is provisioned (default plan is Intro), you can navigate to your account from within the Heroku UI:
Once Heroku dyno metrics are flowing into your Hosted Graphite account, a default Heroku dashboard will be automatically installed. This dashboard offers a great starting point for your monitoring and can be customized further:
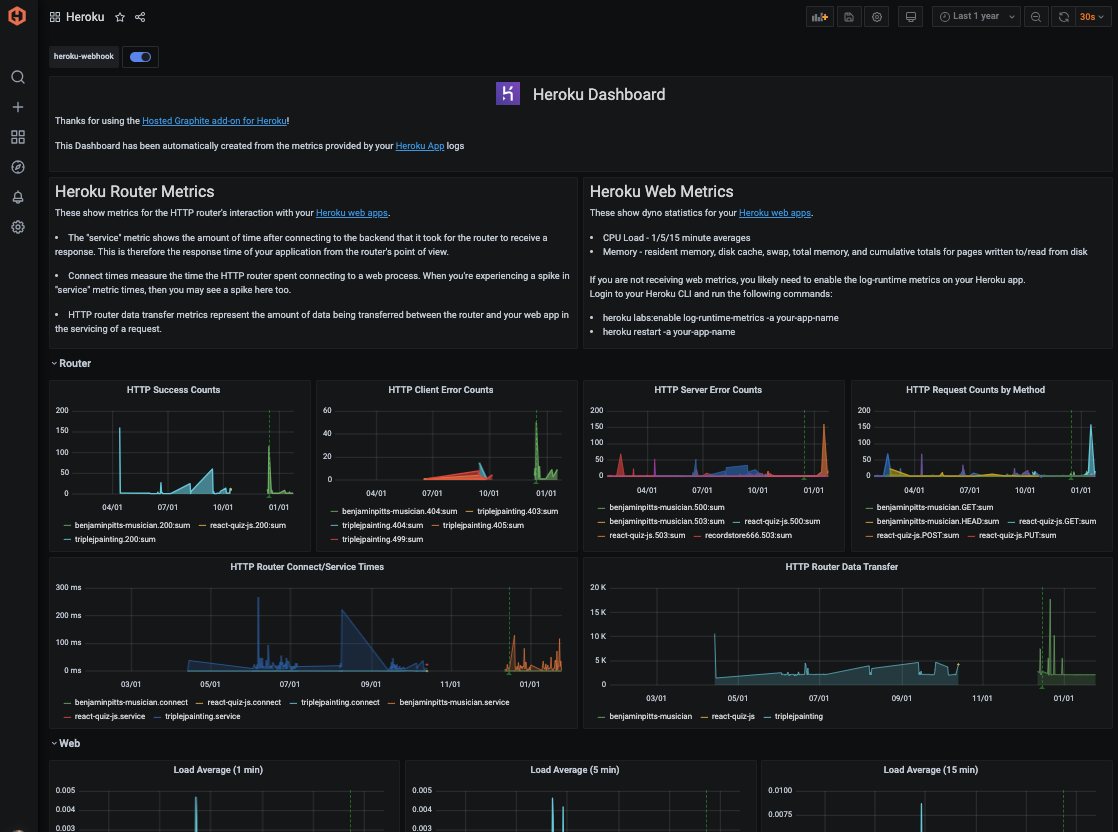
If you are not receiving web metrics, you probably have to enable Log Runtime Metrics from within your Heroku CLI:
heroku labs:enable log-runtime-metrics -a <app-name>
heroku restart -a <app-name>
Step 2: Monitoring the Heroku Postgres Add-On
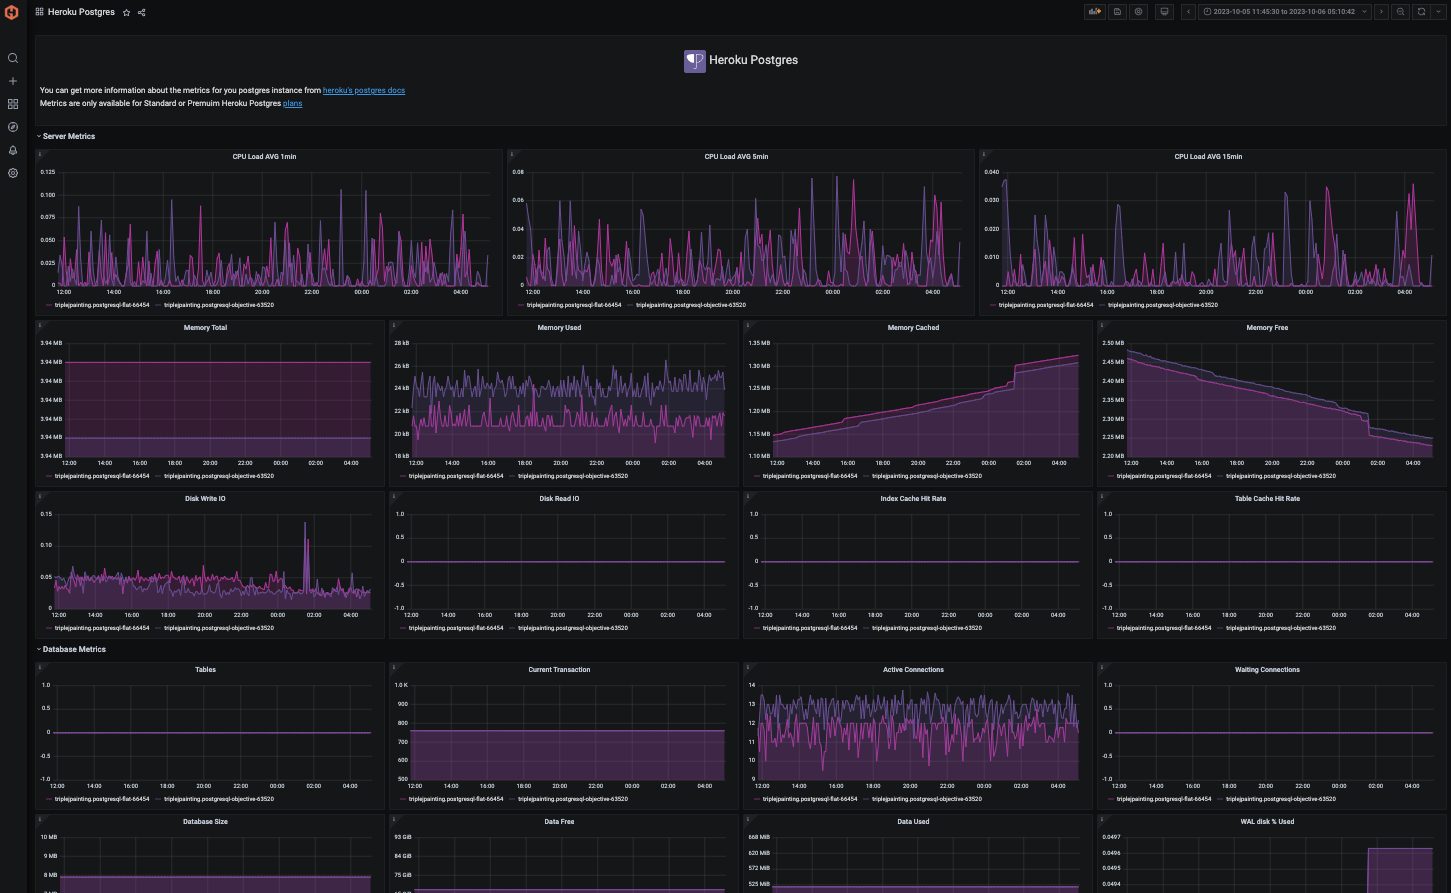
If you use Heroku's Postgres Add-On at the standard or premium tier, 30 performance metrics per DB instance will be forwarded to your Hosted Graphite account. They are prefixed with: heroku.<app-name>.heroku-postgres.<instance-name>.<type> and these are the metrics as they appear in the Graphite (dot-notation) format:
heroku.<app-name>.heroku-postgres.<instance-name>.database.active-connections
heroku.<app-name>.heroku-postgres.<instance-name>.database.current_transaction
heroku.<app-name>.heroku-postgres.<instance-name>.database.db_size
heroku.<app-name>.heroku-postgres.<instance-name>.database.index-cache-hit-rate
heroku.<app-name>.heroku-postgres.<instance-name>.database.table-cache-hit-rate
heroku.<app-name>.heroku-postgres.<instance-name>.database.tables
heroku.<app-name>.heroku-postgres.<instance-name>.database.waiting-connections
heroku.<app-name>.heroku-postgres.<instance-name>.server.load-avg-15m
heroku.<app-name>.heroku-postgres.<instance-name>.server.load-avg-1m
heroku.<app-name>.heroku-postgres.<instance-name>.server.load-avg-5m
heroku.<app-name>.heroku-postgres.<instance-name>.server.memory-cached
heroku.<app-name>.heroku-postgres.<instance-name>.server.memory-free
heroku.<app-name>.heroku-postgres.<instance-name>.server.memory-postgres
heroku.<app-name>.heroku-postgres.<instance-name>.server.memory-total
heroku.<app-name>.heroku-postgres.<instance-name>.server.read-iops
heroku.<app-name>.heroku-postgres.<instance-name>.server.tmp-disk-available
heroku.<app-name>.heroku-postgres.<instance-name>.server.tmp-disk-used
heroku.<app-name>.heroku-postgres.<instance-name>.server.wal-percentage-used
heroku.<app-name>.heroku-postgres.<instance-name>.server.write-iops
Hosted Graphite also provides a pre-configured dashboard for these metrics that can be installed from their Dashboard Library:
Step 3: Monitoring the Heroku Redis Add-On
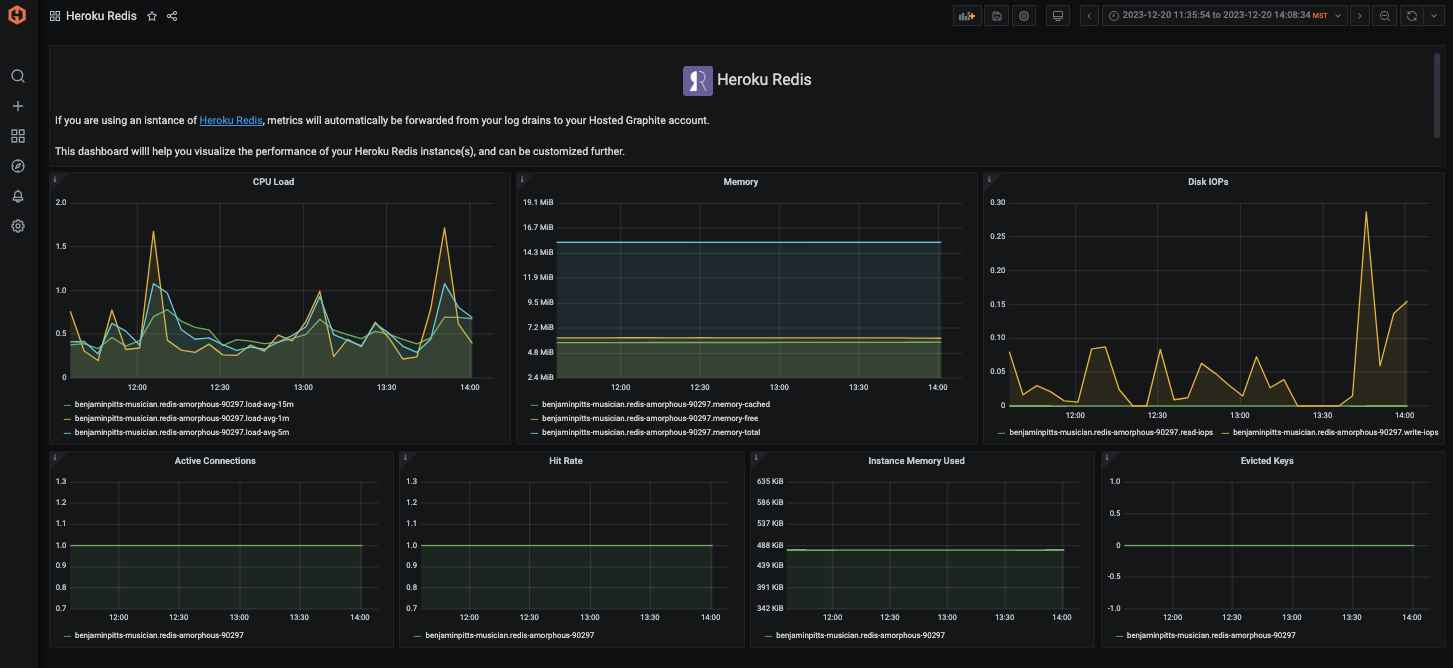
If you use the Heroku Redis add-on at any tier, 12 metrics will be automatically forwarded to your Hosted Graphite account. They are prefixed with: heroku.<app-name>.heroku-redis.<instance-name>.<type> and these are the metrics as they appear in the Graphite format:
heroku.<app-name>.heroku-redis.<instance-name>.database.active-connections
heroku.<app-name>.heroku-redis.<instance-name>.redis.evicted-keys
heroku.<app-name>.heroku-redis.<instance-name>.redis.hit-rate
heroku.<app-name>.heroku-redis.<instance-name>.redis.memory-redis
heroku.<app-name>.heroku-redis.<instance-name>.server.load-avg-15m
heroku.<app-name>.heroku-redis.<instance-name>.server.load-avg-1m
heroku.<app-name>.heroku-redis.<instance-name>.server.load-avg-5m
heroku.<app-name>.heroku-redis.<instance-name>.server.memory-cached
heroku.<app-name>.heroku-redis.<instance-name>.server.memory-free
heroku.<app-name>.heroku-redis.<instance-name>.server.memory-total
heroku.<app-name>.heroku-redis.<instance-name>.server.read-iops
heroku.<app-name>.heroku-redis.<instance-name>.server.write-iops
Hosted Graphite also has a pre-configured Heroku Redis dashboard available in their Dashboard Library:
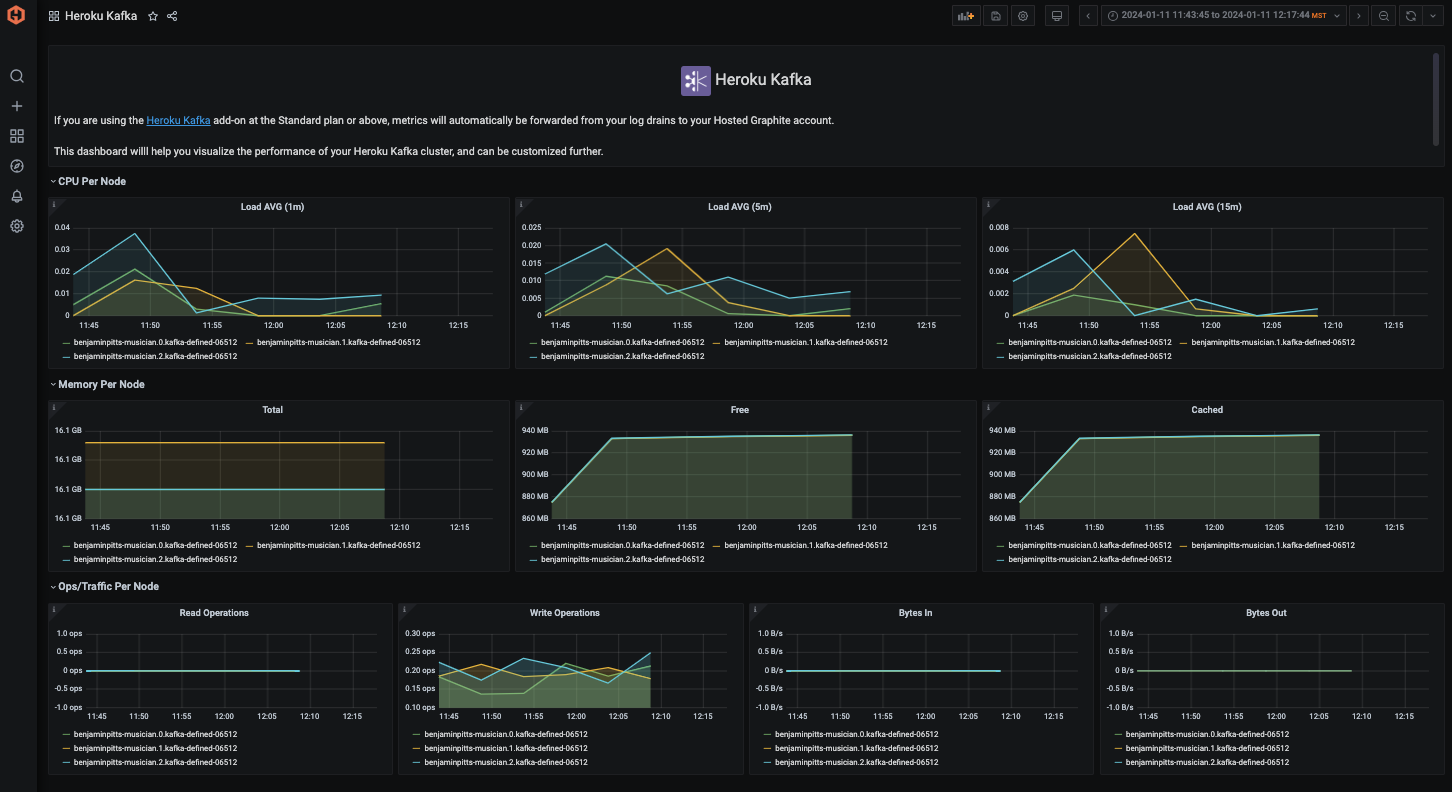
Step 4: Monitoring the Heroku Kafka Add-On
If you use the Heroku Kafka add-on at the Standard tier or above, 10 metrics per cluster node will automatically be forwarded to your Hosted Graphite account. They are prefixed with: heroku.<app-name>.heroku-kafka.<node>.<instance-name>.<type> and this is what they look like in the Graphite format:
heroku.<app-name>.heroku-kafka.<node>.<instance-name>.kafka.bytes-in-per-second
heroku.<app-name>.heroku-kafka.<node>.<instance-name>.kafka.bytes-out-per-second
heroku.<app-name>.heroku-kafka.<node>.<instance-name>.server.load-avg-15m
heroku.<app-name>.heroku-kafka.<node>.<instance-name>.server.load-avg-1m
heroku.<app-name>.heroku-kafka.<node>.<instance-name>.server.load-avg-5m
heroku.<app-name>.heroku-kafka.<node>.<instance-name>.server.memory-cached
heroku.<app-name>.heroku-kafka.<node>.<instance-name>.server.memory-free
heroku.<app-name>.heroku-kafka.<node>.<instance-name>.server.memory-total
heroku.<app-name>.heroku-kafka.<node>.<instance-name>.server.read-iops
heroku.<app-name>.heroku-kafka.<node>.<instance-name>.server.write-iops
Hosted Graphite also has a pre-configured Heroku Kafka dashboard that can be generated from their Dashboard Library:
Step 5: Send Custom Metrics for Add-ons
Heroku doesn't natively send add-on-specific metrics to Graphite. But you can manually send them using API queries or service integrations. Here's how:
Example: Monitor Heroku Postgres Metrics
Heroku provides a CLI plugin for fetching database metrics:
heroku pg:info --app your-app-nameThis returns metrics like:
- Connection count
- Database size
- Transaction throughput
- Table cache hit ratio
You can script this using Bash or Python, then send the metrics to Hosted Graphite using StatsD or direct TCP.
Python example:
import statsd
import subprocess

statsd_client = statsd.StatsClient('carbon.hostedgraphite.com', 2003, prefix='YOUR_API_KEY')

# Example: Send connection count
output = subprocess.check_output(['heroku', 'pg:info', '--app', 'your-app-name']).decode()
if "Connections" in output:
    connections = int(output.split("Connections")[1].split()[0])
    statsd_client.gauge("heroku.postgres.connections", connections)
Schedule this with a cron job or a lightweight Heroku worker dyno.
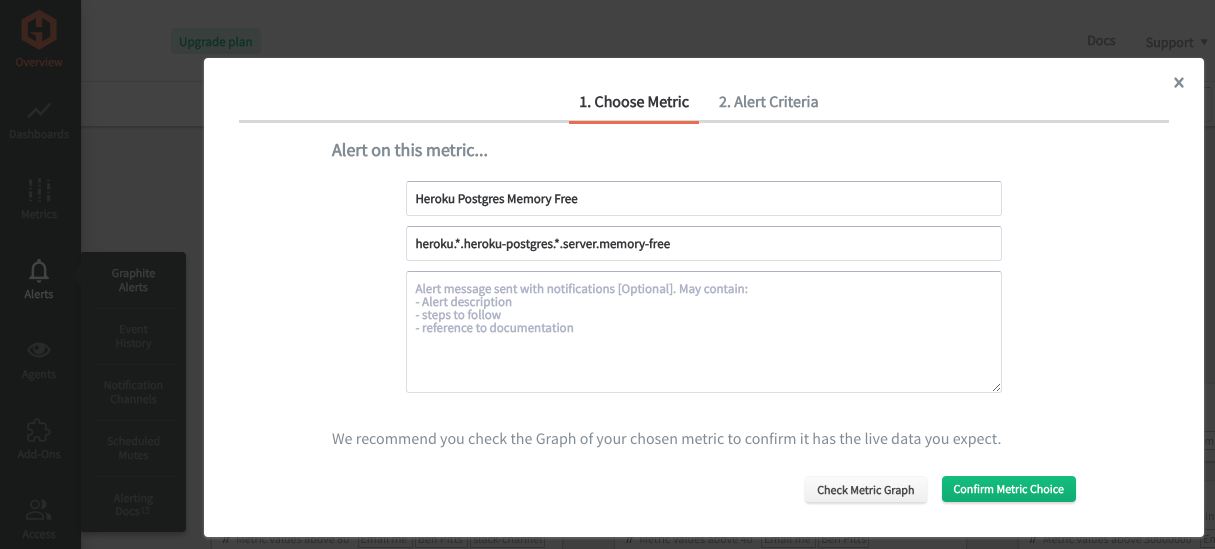
Step 6: Create Custom Alerts using Your Graphite Data
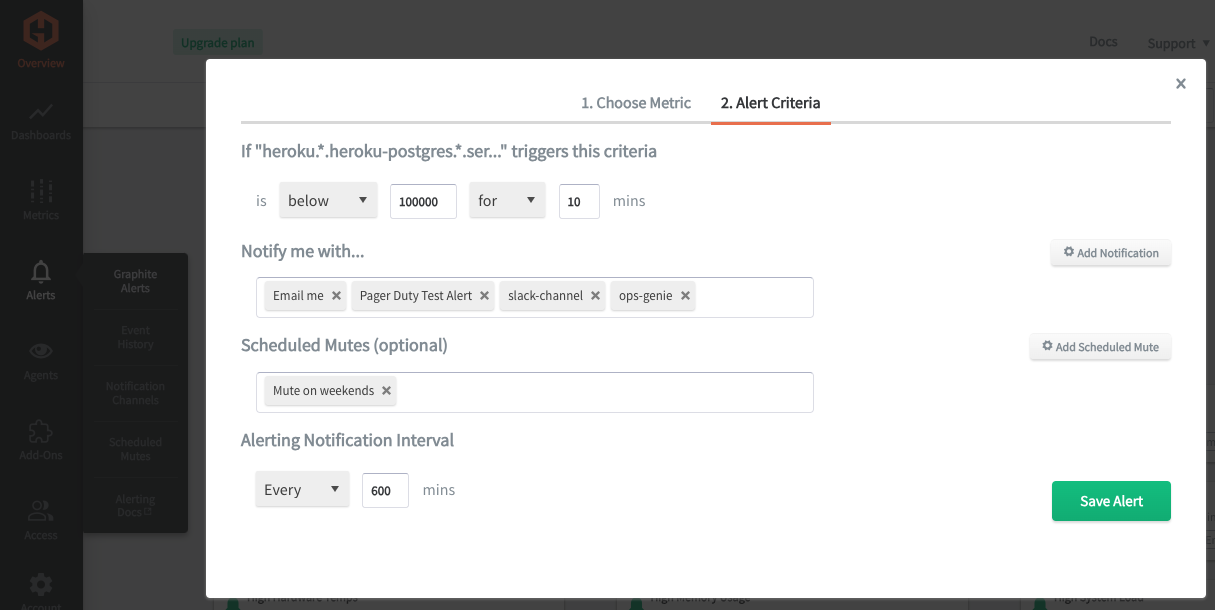
In the Hosted Graphite UI, navigate to Alerts => Graphite Alerts to create a new alert. Name the alert, add a query to the alerting metric field, and add a description of what this alert is (NOTE: you can use wild card (*) searching to grab all metrics from a specified index):
Then select the Alert Criteria tab to set a threshold, and select a notification channel. The default notification channel will be the email you used to sign up for the Hosted Graphite account, but you can easily configure channels for Slack, PagerDuty, Microsoft Teams, OpsGenie, custom webhooks and more. See the Hosted Graphite docs for more details on notification channels:
MetricFire lets you define alert thresholds for any time series metric.
Examples:
- 🚨 Alert if Redis memory usage > 85%
- 📉 Alert if Postgres cache hit ratio < 90%
- 🛑 Alert if webhook 5xx rate > 1% for 5 minutes
Send alerts to:
- Slack
- PagerDuty
- Webhooks
This is especially useful when you're depending on third-party services — giving you a heads-up when their performance changes before it breaks yours.
Best Practices for Monitoring Add-ons on Heroku
- Treat add-ons like production infrastructure — they're often more critical than your own code.
- Track usage vs. quotas — avoid surprise throttling or overage bills.
- Set budgets in monitoring — especially for metered services like Redis or external APIs.
- Use tags to separate environments — tag metrics from staging, production, QA, etc., to avoid confusion.
- Alert on both failures and silences — no metrics can be just as dangerous as error spikes.
Real-World Use Case: SaaS Teams with Redis and Postgres
Many MetricFire customers run Python or Rails-based apps with Heroku Redis for caching and job queues, and Heroku Postgres for primary data.
They use MetricFire to:
- Visualize memory usage in Redis to prevent key eviction
- Alert on Postgres connection saturation
- Monitor Sidekiq or Celery queue latency
- Track webhook retry behavior from Stripe or SendGrid
This has helped teams catch slow degradation before customers notice, cut down on incident time, and right-size their dynos and plans.
Conclusion: Observability for Add-ons Is Not Optional
Heroku add-ons are easy to install, but harder to operate well without visibility. Whether you're using them for databases, caching, logging, or background jobs — their performance affects your application directly.
With Hosted Graphite by MetricFire, you can:
- Monitor dynos and add-ons in one place
- Send custom metrics tailored to your business
- Visualize performance trends and bottlenecks
- Set alerts before things break
Ready to Take Control of Your Add-ons?
- 🚀 Start a free 14-day trial
- 🔌 Add Hosted Graphite to your Heroku app
- 💬 Need help? Reach out to our team — we're happy to walk you through setup and best practices.
Monitoring your Heroku infrastructure and add-ons is crucial for optimizing performance, ensuring resource efficiency, and proactively addressing issues. It allows you to detect and resolve bottlenecks, anomalies, and security incidents in real-time, contributing to a better user experience. Additionally, effective monitoring aids in cost optimization by identifying unused resources and ensuring compliance with industry standards and regulations. Hosted Graphite integrates seamlessly with Heroku, and offers a monitoring environment for much less than other platforms, like Data Dog.
Tools like dashboards and alerts will complement your data by providing real-time visualisation, proactive identification of issues, historical trend analysis, and facilitating informed decision-making —all of which are essential for maintaining a robust and efficient infrastructure.
Sign up for the free trial, and experiment with monitoring your Heroku stack today. You can also book a demo and speak directly with the MetricFire team about your monitoring needs.


