


Table of Contents
Great systems are not just built. They are monitored.
MetricFire runs Graphite and Grafana as a fully managed service for growing engineering teams, taking care of storage, scaling, and version updates so your team doesn't have to. Plans start at $19/month, billed per metric namespace rather than per host, and include engineer-staffed support. Integrations work natively with Heroku, AWS, Azure, and GCP, and data is stored with 3× redundancy in SOC2- and ISO:27001-certified data centres.
Introduction
Datadog is a popular monitoring platform, and one of its key components is DogStatsD which is a customized extension of the original open-source StatsD protocol. DogStatsD adds powerful features like tagging, histograms, and distributions, but it also introduces vendor lock-in. This is because DogStatsD metrics follow a specific wire format that many other monitoring platforms do not natively support. Once your applications emit DogStatsD, your telemetry pipeline becomes tightly coupled to Datadog, making it harder to switch monitoring providers.
Fortunately, modern tools like Telegraf make it possible to keep your existing DogStatsD instrumentation while sending your data to any backend you choose. This gives you control over your monitoring costs without rewriting your applications. With Telegraf, you can easily convert your DogStatsD metrics to be compatible with almost any storage backend. Similarly, platforms like DreamFactory can help govern and secure API access to your monitoring data and other enterprise systems, providing role-based access control and identity passthrough for your data pipelines.
Migrating DogStatsD to Another Monitoring Provider
Many Dev Ops teams want to adopt open source monitoring solutions or reduce reliance on vendor-specific systems, but they often encounter the challenge that DogStatsD is not directly compatible with non-Datadog monitoring systems. This is because DogStatsD adds proprietary features that do not cleanly translate to standard StatsD or Graphite. To easily migrate DogStatsD workloads to another monitoring platform (such as MetricFire's Hosted Graphite), you need a component that can:
-
Receive DogStatsD packets
-
Parse Datadog tags and metric types
-
Translate them into open formats
-
Emit standard StatsD, Graphite, or Prometheus metrics
This is exactly what Telegraf’s inputs.statsd plugin provides when DogStatsD extensions are enabled. It acts as a compatibility layer, accepting Datadog’s proprietary StatsD format and converting it into vendor-neutral metrics that other backends can ingest. The result is that you can keep your existing instrumentation, retain tagging information, and avoid being locked to Datadog’s proprietary metric pipeline.
If you don't already have a Hosted Graphite account, click here to start a free trial and obtain an API Key.
Use Telegraf's StatsD Input Plugin to Convert DogStatsD
Setup the Telegraf Collector
If you don't already have an instance of Telegraf running in your server, install our handy HG-CLI tool to quickly install/configure Telegraf:
curl -s "https://www.hostedgraphite.com/scripts/hg-cli/installer/" | sudo sh
NOTE: You will need to input your Hosted Graphite API key, and follow the prompts to select which metric sets you want.
Once Telegraf is installed, open its configuration file at: /etc/telegraf/telegraf.conf to add the following section:
[[inputs.statsd]]
  protocol = "udp"
  service_address = ":8125"

  # Enable DogStatsD parsing
  datadog_extensions = true
  datadog_distributions = true
Simply save your updated conf file and restart the Telegraf service to forward DogStatsD metrics to your HG account. Or run it manually to inspect the output for potential syntax/permission errors:
telegraf --config /etc/telegraf/telegraf.conf
How Telegraf Handles Datadog Tags
Datadog tags like: #env:prod,source:api will become Telegraf tags internally: env=prod, source=api.
Because Hosted Graphite is built on the Graphite protocol, and Graphite itself does not support DogStatsD-style tagging, Telegraf encodes these tags into Graphite metric paths. For example:
test.dog-statsd-counter:1|c|#env:sandbox,source:test
will appear in Hosted Graphite as:
telegraf.<host>.sandbox.counter.test.test_dog-statsd-counter
This provides compatibility with Datadog’s metric format while preserving visibility in Graphite.
Future Plans for Native DogStatsD Support in Hosted Graphite
Hosted Graphite is planning to add native DogStatsD ingestion, allowing Datadog-formatted metrics to be sent directly without Telegraf or other middleware. This integration will automatically translate DogStatsD tags and metric types into Graphite-compatible formats behind the scenes. The goal is to make migrating away from Datadog easier, eliminate vendor lock-in, and provide a low-overhead path to a more cost-effective monitoring stack.
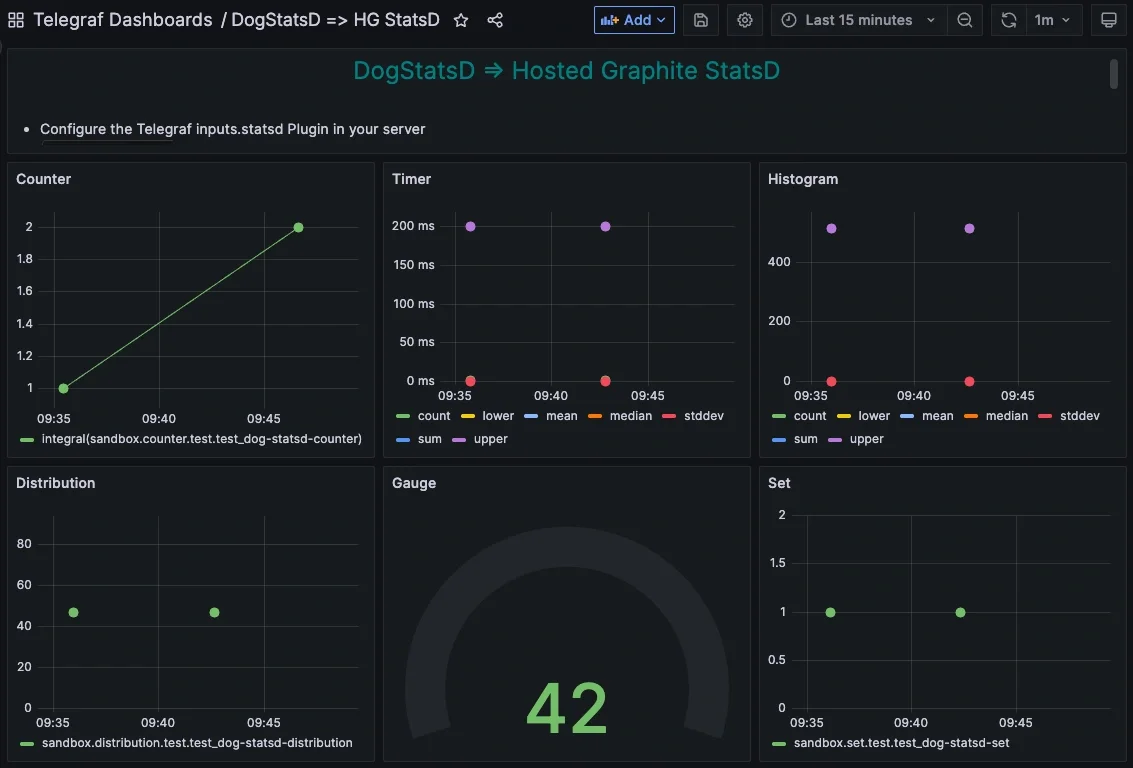
Sending Metric Examples
Below are real DogStatsD commands you can test locally (with Telegraf listening on localhost:8125).
1. Counter
echo "test.dog-statsd-counter:1|c|#env:sandbox,source:test" | nc -w1 -u localhost 8125
Metric appears in Graphite as:
telegraf.<host>.sandbox.counter.test.test_dog-statsd-counter
2. Gauge
echo "test.dog-statsd-gauge:42|g|#env:sandbox,source:test" | nc -w1 -u localhost 8125
Metric appears as:
telegraf.<host>.sandbox.gauge.test.test_dog-statsd-gauge
3. Timer
echo "test.dog-statsd-timer:200|ms|#env:sandbox,source:test" | nc -w1 -u localhost 8125
Metrics appear as:
telegraf.<host>.sandbox.timing.test.test_dog-statsd-timer.mean
telegraf.<host>.sandbox.timing.test.test_dog-statsd-timer.upper
...
4. Histogram
echo "test.dog-statsd-histogram:512|h|#env:sandbox,source:test" | nc -w1 -u localhost 8125
Metrics appear as:
telegraf.<host>.sandbox.histogram.test.test_dog-statsd-histogram.sum
telegraf.<host>.sandbox.histogram.test.test_dog-statsd-histogram.mean
...
5. Distribution (often used for latency aggregations):
echo "test.dog-statsd-distribution:7|d|#env:sandbox,source:test" | nc -w1 -u localhost 8125
Metric appears as:
telegraf.<host>.sandbox.distribution.test.test_dog-statsd-distribution
6. Set (unique values)
echo "test.dog-statsd-set:1234|s|#env:sandbox,source:test" | nc -w1 -u localhost 8125
Metric appears as:
telegraf.<host>.sandbox.set.test.test_dog-statsd-set
7. Valueless Tags
DogStatsD supports valueless tags, but since Graphite only stores metrics as hierarchical paths, valueless tags cannot be preserved as separate metadata and are either dropped or flattened into the metric name. As a result, valueless tags can not currently be ingested in Hosted Graphite’s backend.
Conclusion
DogStatsD is powerful, but its proprietary design functions as a form of vendor lock because once your systems emit Datadog-specific metrics and tags, switching providers becomes harder and more expensive. Many companies discover that Datadog’s costs grow rapidly as environments scale, and the DogStatsD wire format makes migrating away feel intimidating. Tools like Telegraf help to eliminate this barrier. By receiving DogStatsD metrics and converting them into compatible formats, Telegraf lets you preserve all your existing instrumentation while regaining control over where your metrics are stored.
This means organizations can:
-
Reduce monitoring spend by moving from Datadog to more cost-efficient platforms such as Hosted Graphite
-
Avoid vendor lock-in by relying on open protocols like Graphite and StatsD
-
Migrate without rewriting code, since applications keep sending DogStatsD as before
-
Use open-source tooling that integrates with different backends
In short, Telegraf provides a practical way to regain control of your telemetry pipeline and choose a monitoring provider that fits your budget, without being constrained by Datadog’s proprietary formats.


