

Table of Contents
- MetricFire
- MetricFire vs. Datadog: the core identity
- MetricFire vs. Datadog: the agents
- MetricFire vs. Datadog: dashboards, alerts and integrations
- MetricFire vs. Datadog: pricing
- MetricFire’s Bonus aggregation tool “Data Views”: 9 times the value for money
- MetricFire vs. Datadog: Prometheus and Kubernetes monitoring
Great systems are not just built. They are monitored.
MetricFire runs Graphite and Grafana as a fully managed service for growing engineering teams, taking care of storage, scaling, and version updates so your team doesn't have to. Plans start at $19/month, billed per metric namespace rather than per host, and include engineer-staffed support. Integrations work natively with Heroku, AWS, Azure, and GCP, and data is stored with 3× redundancy in SOC2- and ISO:27001-certified data centres.
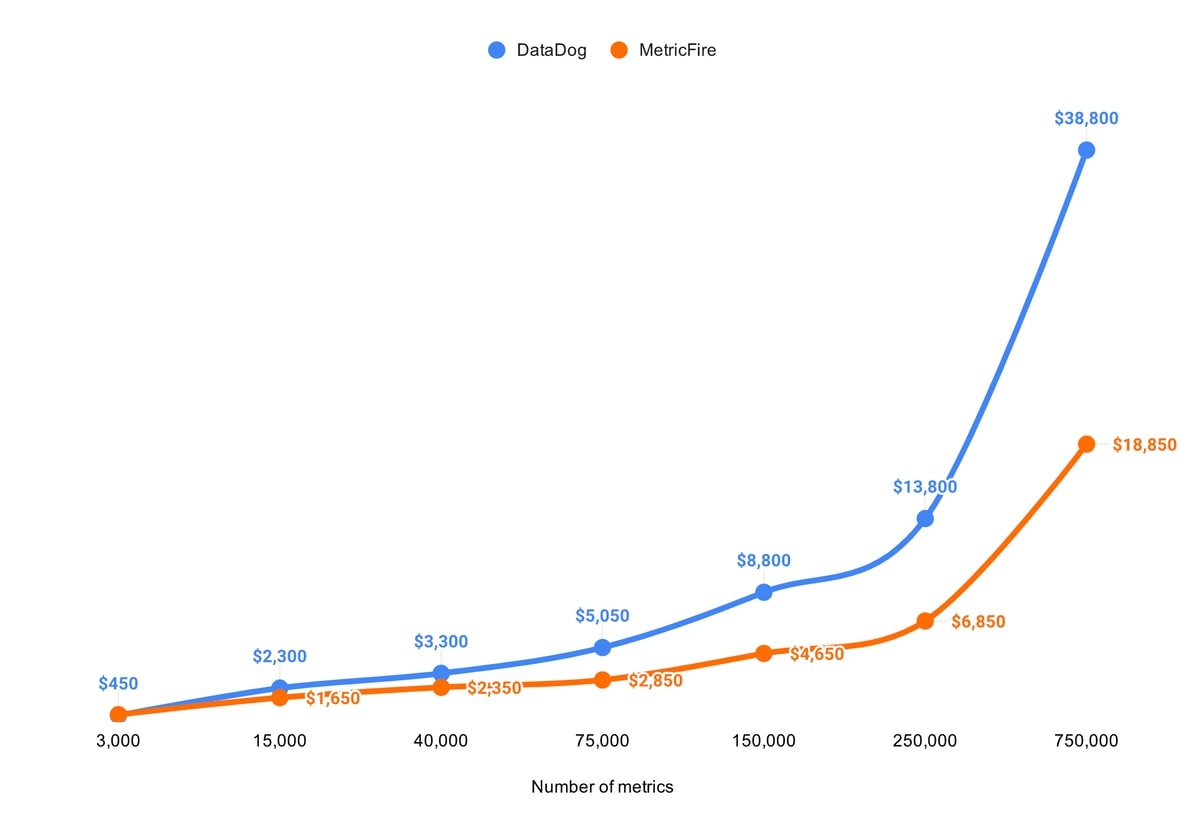
Before we dive into the specifics of MetricFire vs. Datadog, let's address the most critical point: scaling. Datadog is great for users who need to do a little of everything, but Datadog's biggest weakness is scaling.
Datadog can do logs, APM, time series and more, but scaling time-series metrics, alerts, and servers will cause your monthly bill to escalate. The graph below shows what you pay at Datadog vs. MetricFire:
Now, let's dive into MetricFire vs. Datadog and their critical comparisons.
MetricFire
MetricFire is an enterprise-focused monitoring solution that provides users with end-to-end infrastructure monitoring built on two primary open-source services: Grafana and Graphite. MetricFire has made technical improvements to these open-source systems and made both open-source projects available as one hosted product. MetricFire is designed for teams of every size, from startups to large-scale enterprises.
With Hosted Graphite on MetricFire, redundant storage is available up to 3 times. With Hosted Graphite running on TimescaleDB, essentially replacing Graphite's antiquated file-based whisper storage, one can seamlessly scale with a cluster-based database. MetricFire additionally provides increased support for tagged metrics, automatic backup and 24/7 support from engineers.
Grafana as a service is a highly intuitive user interface included in all of MetricFire's standard pricing plans. You should book a demo with MetricFire!
MetricFire vs. Datadog: the core identity
MetricFire and Datadog have fundamentally different core identities. Datadog is an agent-based monitoring tool that can easily plug into any infrastructure or tech stack. It is a proprietary product, and its main interest is making money. Expanding existing subscriptions to extract more money from customers is vital to its 2020 business model.
Datadog runs its service by itemizing each feature and charging extra for new use cases for metrics. On the other hand, MetricFire is open-source at heart, and we aspire to be a partner in monitoring for our customers. For organizations managing complex data integration workflows alongside their monitoring infrastructure, solutions like Integrate.io provide complementary capabilities for ETL and data pipeline management, allowing teams to seamlessly connect monitoring data across databases, APIs, and data warehouses.
MetricFire is built on open-source Graphite and Grafana, which means there is absolutely no vendor lock-in. You can do that if you want to leave or start running your monitoring systems independently. Also, you can easily customize your own MetricFire account with any of the hundreds of plugins or integrations available in the open-source communities.
MetricFire specializes in scaling, and we are here to be your low-cost tool for scaling custom metrics. We don't charge extra for metrics from a different source. All metrics are treated equally, regardless of the number of hosts you work with or the data sources.
Look at this article to learn more about MetricFire's core identity—we're here to work with you.
MetricFire vs. Datadog: the agents
The Datadog monitoring agent is the core of their service. You have to use it, and even though it's quick to install, it has limited configuration options. You can't get what you need from just the Datadog Agent. If you're interested in monitoring outside of the Datadog agent with Datadog, you have to use their "custom metrics" feature. These are charged at a high rate in the Datadog platform and can easily cause your monthly bill to exceed 50,000 USD.
On the other hand, as a long-time industry standard, Graphite is supported by a host of monitoring agents, and many other services have Graphite reporting built right in. The list on the Graphite website gives a pretty good idea of how extensively supported Graphite is.
For example, you can easily monitor Kubernetes clusters with a Snap Daemon directly compatible with Graphite or Hosted Graphite.
Any Graphite-compatible agent can send data to Hosted Graphite. Hosted Graphite also provides a monitoring agent that is quick to install using our custom script. It's built around Diamond, and the additional features include self-monitoring via the Hosted Graphite Agent UI, a metric relay for your local application metrics, and a configurable datapoint backlog store to ensure recovery during network fluctuations. You can read more about those features here in the Hosted Graphite docs.
If you're interested in monitoring metrics beyond what an agent can provide, MetricFire is the right tool for you. MetricFire specializes in scaling custom metrics monitoring. We allow you to pull metrics from any source, either through your custom scripts or Grafana's world of plugins.
MetricFire vs. Datadog: dashboards, alerts and integrations
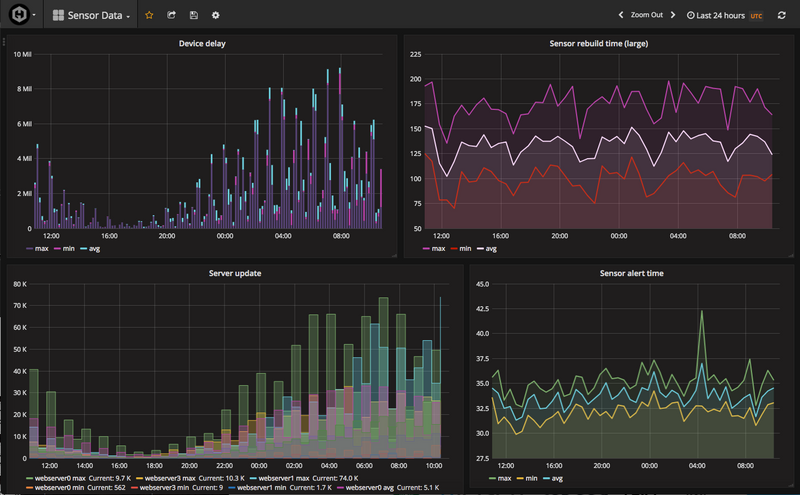
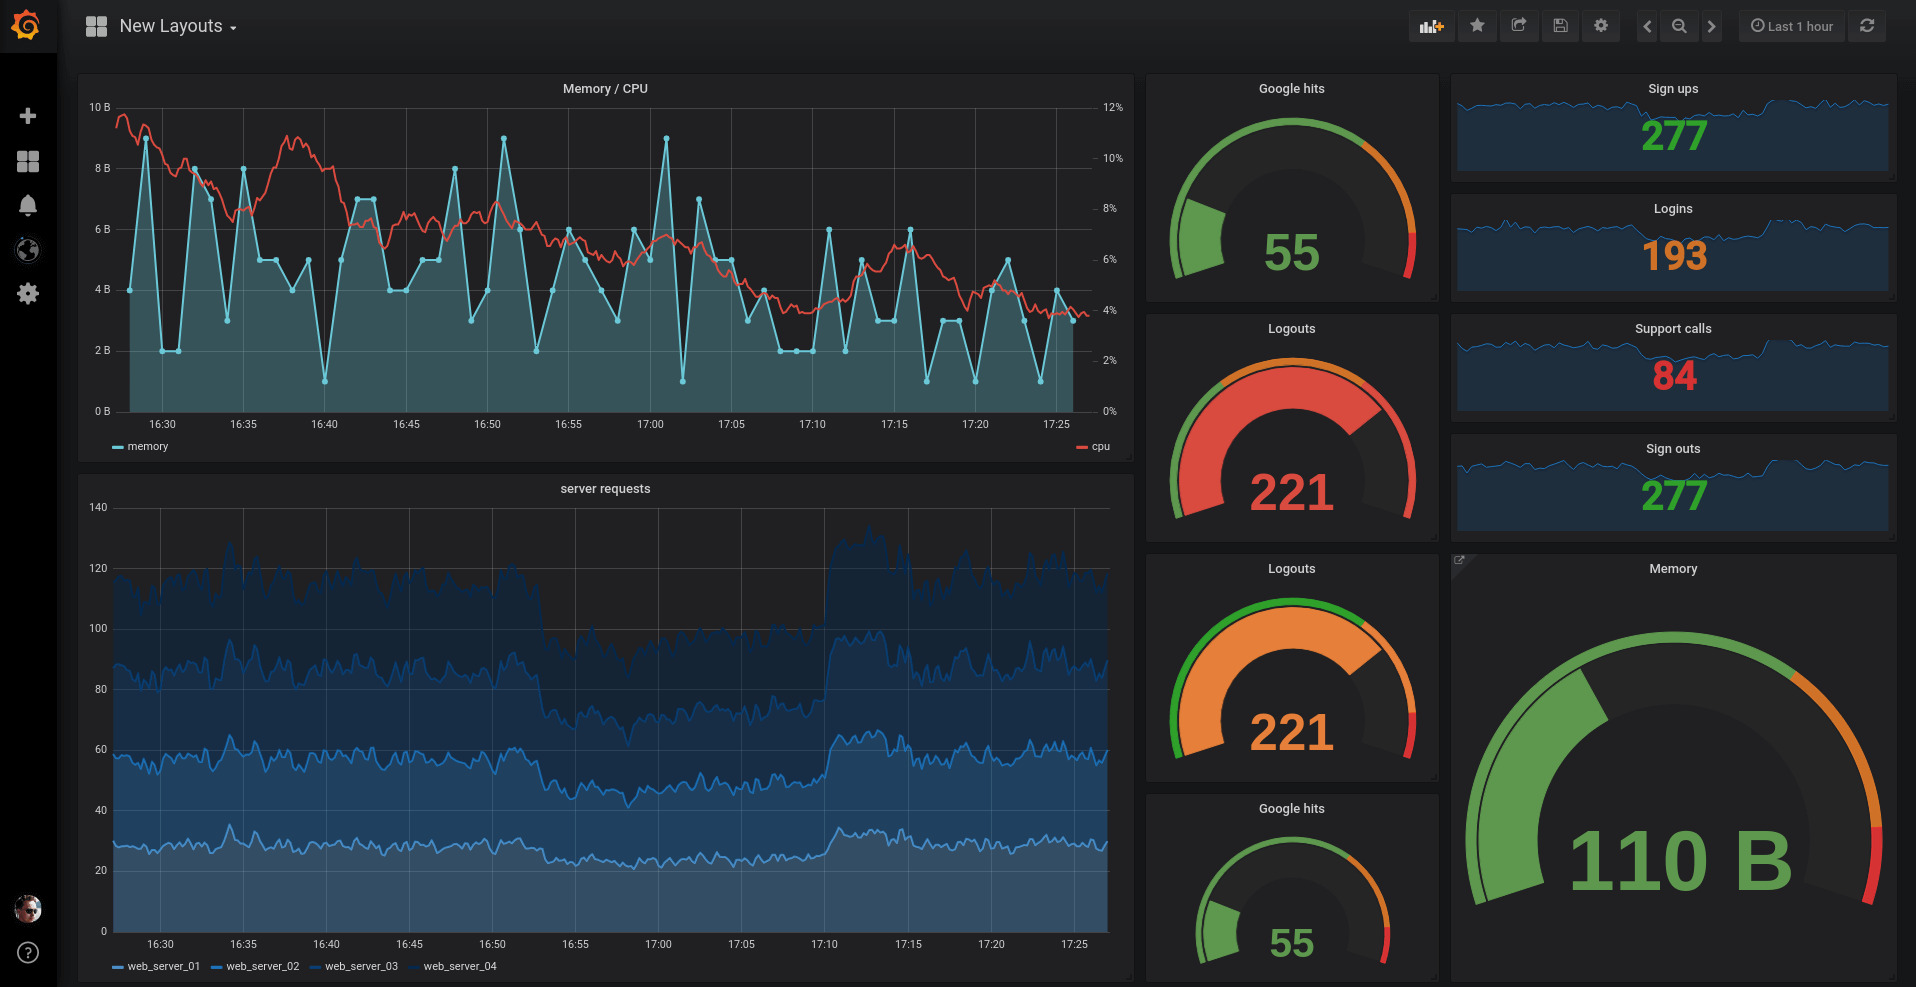
Datadog has a dashboard and alerts built into the website. It's one of the main selling points, after all. However, MetricFire surpasses Datadog on visualizations through their Hosted Grafana solution.
MetricFire supports many other graphing products and provides an easy-to-use rendering API to access stored data using the full power of Graphite's many functions. Hosted Graphite allows access to the Graphite Render API and a hosted version of the most well-known and influential dashboard service, Grafana.
But users aren't limited to that, and we have users who use their own local Grafana or the open-source Cabot dashboard and alerting service.
Grafana is the most well-known; it was initially built primarily for use with Graphite but has since branched out as other monitoring services introduce similar API support. In every MetricFire plan, customers have access to a hosted version of Grafana as the primary dashboarding tool; however, the Render API means various other options. The Graphite website lists 24 other visualisation tools and ten different monitoring/alerting tools, allowing users to customise their setup as much or as little as they want.
Check out MetricFire's dashboards here:
MetricFire vs. Datadog: pricing
Datadog's per-host pricing is set and reasonably inflexible. It has some leeway for containers and custom metrics, but fundamentally, you pay what you pay, even if that price includes features you don't use.
Regarding the MetricFire pricing, check out the pricing page here.
We sell bulk metrics; you can do whatever you want with them. The rate is extremely low, and you can quickly build a customized monitoring system for your products!
We've done a lot of work into how Datadog charges their customers. While Datadog appears low-cost, scaling custom metrics to hundreds of thousands can become costly. Check out this price comparison here:
MetricFire's Bonus aggregation tool "Data Views": 9 times the value for money
The figures are based on the fact that one Datadog metric is as good as one Hosted Graphite metric, but HG metrics are nine times as good! Hosted Graphite provides data views and different ways of looking at the same data. Where Datadog supports StatsD, we do all the work StatsD does ourselves and provide you with an array of varying aggregation methods for every metric you store with us. That means you can decide whether to view the average, max or even 95th percentile values when making your graph without setting that up in advance or storing a different metric.
Check out more about the Data Views feature here!
MetricFire vs. Datadog: Prometheus and Kubernetes monitoring
Datadog has the advantage of offering a Prometheus solution. However, you can't ingest Prometheus metrics in the same style as a real Prometheus installation. Datadog still offers an agent-based Kubernetes monitoring solution. You can attach Datadog's agent to your Kubernetes cluster, which will send metrics about your Kubernetes cluster to the Datadog platform.


