
Table of Contents
Great systems are not just built. They are monitored.
MetricFire runs Graphite and Grafana as a fully managed service for growing engineering teams, taking care of storage, scaling, and version updates so your team doesn't have to. Plans start at $19/month, billed per metric namespace rather than per host, and include engineer-staffed support. Integrations work natively with Heroku, AWS, Azure, and GCP, and data is stored with 3× redundancy in SOC2- and ISO:27001-certified data centres.
Introduction
Grafana is a tool that allows developers and SREs alike to view data produced by their applications in a clean manner. It provides a multitude of options for the developers to decide how they want to ingest their data be it from Graphite, Prometheus or any other common data store tool. And most importantly it also allows them to specify how that data is then rendered back, with a plethora of options available there too. However, sometimes a user might want to use a slightly unusual data source or visualize their data in a novel way. This is where plugins come in. Plugins fill the gaps in what Grafana supplies and what the user wants. In this blog entry we will investigate what makes up a plugin and look through a worked example.
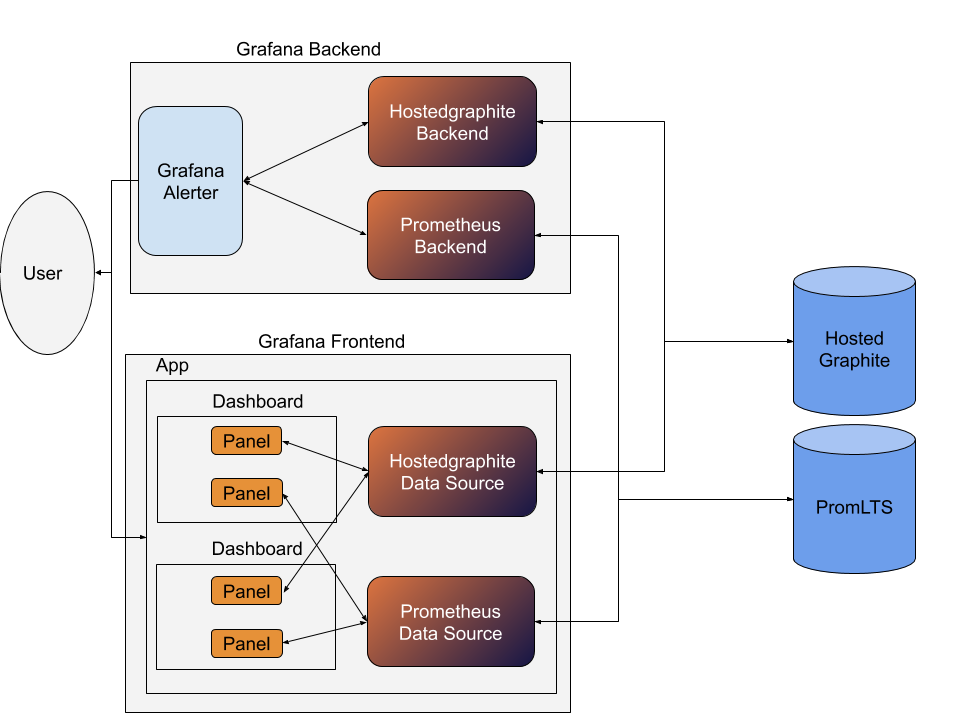
Grafana plugins come in 4 main flavours. These are datasource, backend, panel and app. Each is designed with its own benefits and limitations. Here is a brief overview of each and what they achieve:
Datasource: These plugins allow you to enable interactions with any database that can communicate over HTTP. If you're working with multiple data sources across your infrastructure, a platform like DreamFactory can provide governed API access to any data source, making it easier to integrate various databases and backend systems into your Grafana visualizations.
Backend: Wrap a datasource on the backend to enable alerting on the data.
Panel: Provide a custom way of rendering data on the frontend.
App: Allow the user to create entire new styles of pages, wrap panels and data-sources together and provide a whole different experience of the system.
Here’s a pretty picture to save me 1000 words.
Let’s take a look at the actual requirements of the various different plugins and what we might need to do to implement each. Also, make sure to check out MetricFire's free trial where you can try setting up plugins.
Datasource plugins
This is one of the simpler plugins to implement. All we need to do is create a typescript library that exports the following objects implementing these functions/attributes as well:
QueryCtrl
static templateUrl // Used to render the view for when users edit their metricsConfigCtrl
static templateUrl // Used to render the view for configuring the datasourceDatasource
query(options) // Used to execute queries to the actual database
testDatasource( ) // Used during setup to make sure the connection has been established, this should also test the authentication has been successful (so the first query doesn’t fail)
annotationQuery(options) // Called by dashboards to get annotations
metricFindQuery(options) // Used by query creator to get metric suggestions
PS: You can find the type for the query options parameter here Link.
Backend plugins
Backend plugins are pretty similar to datasource plugins in that they need to execute queries to a remote service. However these are written in any language that supports gRPC calls. Alternatively you can implement the Go interface directly.
Here is the protobuf definition to be implemented:
service DatasourcePlugin {
  rpc Query(DatasourceRequest) returns (DatasourceResponse);
}
You can find the further definitions of the protobuf in this repo.
Therefore in order to implement a custom datasource we need only implement the Query function! Thereafter all alerts should be able to be triggered based on metrics in your datasource.
Panel plugins
Panel plugins are created by implementing one of PanelCtrl, MetricsPanelCtrl and QueryCtrl. PanelCtrl just allows you to display in a panel box with little to know restriction on what you do with that space. MetricsPanelCtrl extends on PanelCtrl and adds hooks for receiving updates from the environment. Here are the most important functions/attributes we need to override in each:
PanelCtrl
static templateUrl // Used to render the view for the panel
this.events.on(‘data-received’, (  ) => { /* handle the event*/} ) // used to receive datasource data
// Alternatively achieved ( in v6.3+ ) by overriding:
handleDataFrame(data: DataFrame[])
MetricsPanelCtrl
static templateUrl // Used to render the view for the panel
this.events.on(‘refresh’, (  ) => { /* handle the event*/} ) // used to refresh periodically
this.events.on(render, (  ) => { /* handle the event*/} ) // used to initially render
App plugins
Apps are a bundling together of panels and datasources. They can be defined by exporting a ConfigCtrl.
Here’s what we need for a valid ConfigCtrl:
static templateUrl // Used to render the view for the configuration page
postUpdate( ) // Use this to import dashboards containign your custom panels and datasources
That’s it! That’s enough for our plugin to function.
Exporting your plugin
Ok great you’ve written your plugin. Now what? Now we need to tell Grafana how to use your plugin. This is achieved differently for backend plugins and frontend plugins so let’s also talk about them separately.
Backend
Backend’s need a plugin.json file with several important attributes to identify the plugin
id : String // unique name for the plugin
type : String // either panel/ datasource/ app (backends are datasources too)
name : String // Display name for the plugin
metrics : Boolean // Can be queried for metrics                     ---- at least one of these
annotations : Boolean // Can be queried for annotations    ---- at least one of these
backend : Boolean // This differentiates the backends and datasources
alerting : Boolean // Allow it to be queried for evaluating alerts
executable : String // Used to render the view for the configuration page
Frontend
Frontends also need a plugin.json file which just specifies some metadata and for datasources whether it accepts metrics or annotations or both.
id : String // unique name for the plugin
type : String // either panel/ datasource/ app (backends are datasources too)
name : String // Display name for the plugin
metrics : Boolean // Can be queried for metrics                     ---- at least one of these
annotations : Boolean // Can be queried for annotations    ---- at least one of these
Modern Grafana
Newer Grafana plugins can utilise extensions of the `GrafanaPlugin` object to do their configuration in a more imperative and obvious way e.g. in the example app repository that Grafana themselves have made they show both the legacy and modern styles of exposing the plugin.
Get a free trial with MetricFire and start making Grafana dashboards right away. Feel free to book a demo if you have questions about what Grafana can do for you.


