
Table of Contents
Great systems are not just built. They are monitored.
MetricFire runs Graphite and Grafana as a fully managed service for growing engineering teams, taking care of storage, scaling, and version updates so your team doesn't have to. Plans start at $19/month, billed per metric namespace rather than per host, and include engineer-staffed support. Integrations work natively with Heroku, AWS, Azure, and GCP, and data is stored with 3× redundancy in SOC2- and ISO:27001-certified data centres.
Introduction to Grafana Geomap Panels
Grafana Geomap is the modern, built-in map visualization for location-based metrics. This guide shows Geomap setup, queries, and how it compares to the older Worldmap plugin.
What is Grafana Geomap?
Grafana Geomap panels visualize geographical data on a map, making it easier to see spatial relationships and patterns. They are useful for monitoring metrics across different locations, such as server performance and application usage across regions. The panels help identify regional issues quickly, allowing for faster troubleshooting and response times. Additionally, Geomap panels support various data sources and customizable layers, enhancing their versatility and integration into diverse monitoring setups.
Geomap vs. Worldmap (what to use when)
-
Status: Worldmap is deprecated; Geomap is preferred for new dashboards.
-
When Worldmap still appears: Legacy dashboards and quick circles over tile maps.
-
Why Geomap: Better layers (heatmaps, shapes, WMS/GeoJSON) and better customization.
Why Use Grafana Geomap Panels
In a software/application monitoring scenario, suppose a company operates a global web application with users spread across various continents. They could use Geomap panels to visualize user access and real-time server performance metrics. Here’s an example of how the setup might work and its benefits:
Data Collection: The company configures Telegraf agents on its servers to collect metrics, including response times, error rates, and request volumes. These metrics are tagged with the servers' and users' geographical location (USA state/country).
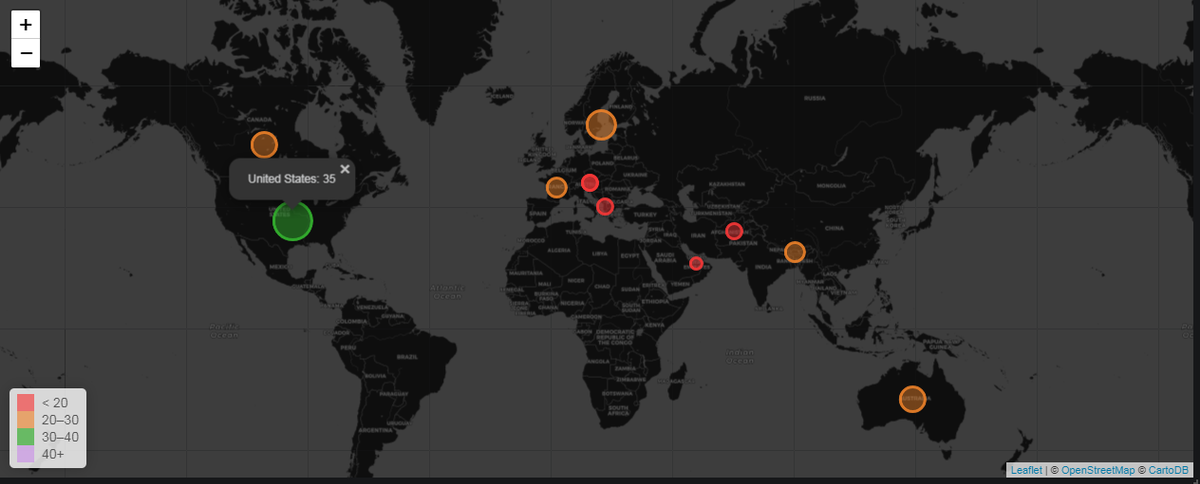
Data Visualization: The collected metrics are forwarded to a data source - like Graphite, which Grafana then queries. The Geomap panel in Grafana displays a world map with overlaid data points representing the server locations and user regions. Each point can be color-coded using thresholds based on the response times or error rates, with red indicating poor performance and green indicating optimal performance.
Monitoring and Analysis: Operations teams monitor the Geomap panel to identify regions with high latency or increased error rates. For example, if the panel shows a cluster of red points in Scandinavia, the team can quickly pinpoint that users in that region are experiencing slow response times.
Troubleshooting and Resolution: The team drills down into the problematic regions by clicking on the map points and accessing detailed metrics and logs from the affected servers. They might discover that a data center in Helsinki is experiencing a high load, causing slowdowns. This insight enables them to take targeted actions, such as scaling up resources or rerouting traffic to less-congested servers.
Proactive Improvements: By continuously monitoring the Geomap panel, the team can identify patterns, such as recurring issues in specific regions during peak hours. They use this data to optimize their infrastructure, implement CDN solutions, or provide additional resources closer to high-traffic areas, ultimately improving global user experience.
Quick Start — Geomap in 90 seconds
-
Add panel → Geomap.
-
Pick a basemap; add a Markers or Heatmap layer.
-
Query Graphite/InfluxDB/Prometheus and map fields (lat/long, country/state lookup, geohash).
-
Set units/thresholds & legend.
Data binding examples for Geomap
Graphite state/country lookup (series→rows + reduce)
Send state and country metrics:
test.geomap.state.CA
test.geomap.state.CO
test.geomap.state.FL
test.geomap.state.NY
test.geomap.state.TX
test.geomap.state.WA
test.geomap.country.australia
test.geomap.country.brazil
test.geomap.country.egypt
test.geomap.country.finland
test.geomap.country.france
test.geomap.country.japan
test.geomap.country.nicaragua
test.geomap.country.norway
test.geomap.country.sweden
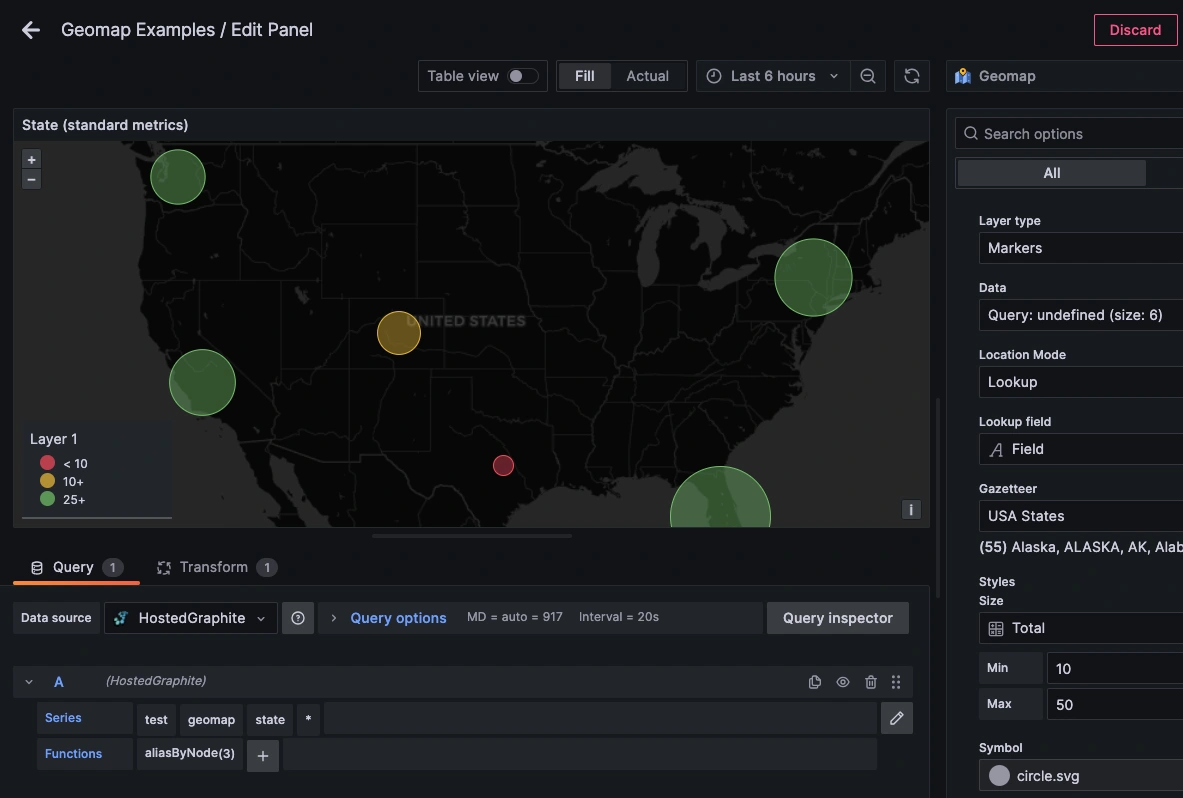
metric query:
aliasByNode(test.geomap.state.*, 3)
Or
aliasByNode(test.geomap.country.*, 3)
add a transformation:
Reduce => Mode: Series to Rows => Calculations: Total
update map layers in panel edit mode:
Location Mode: Lookup
Lookup Field: Field
Gazetteer: USA States or Countries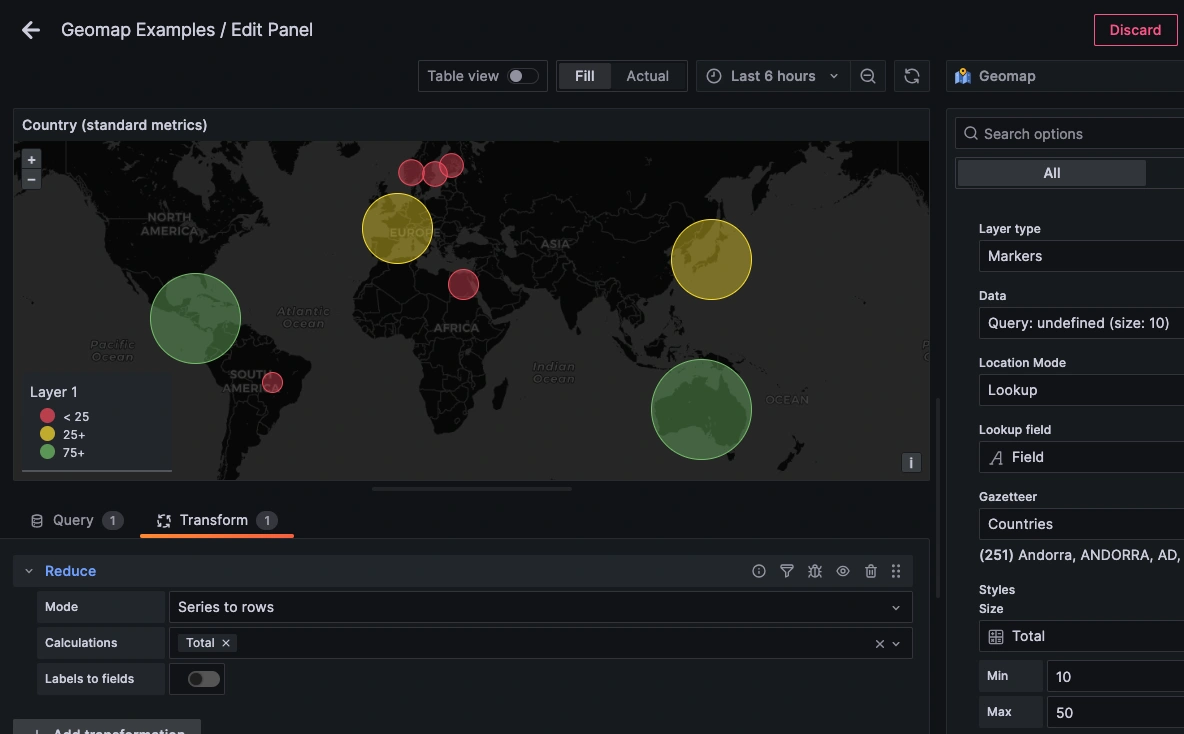
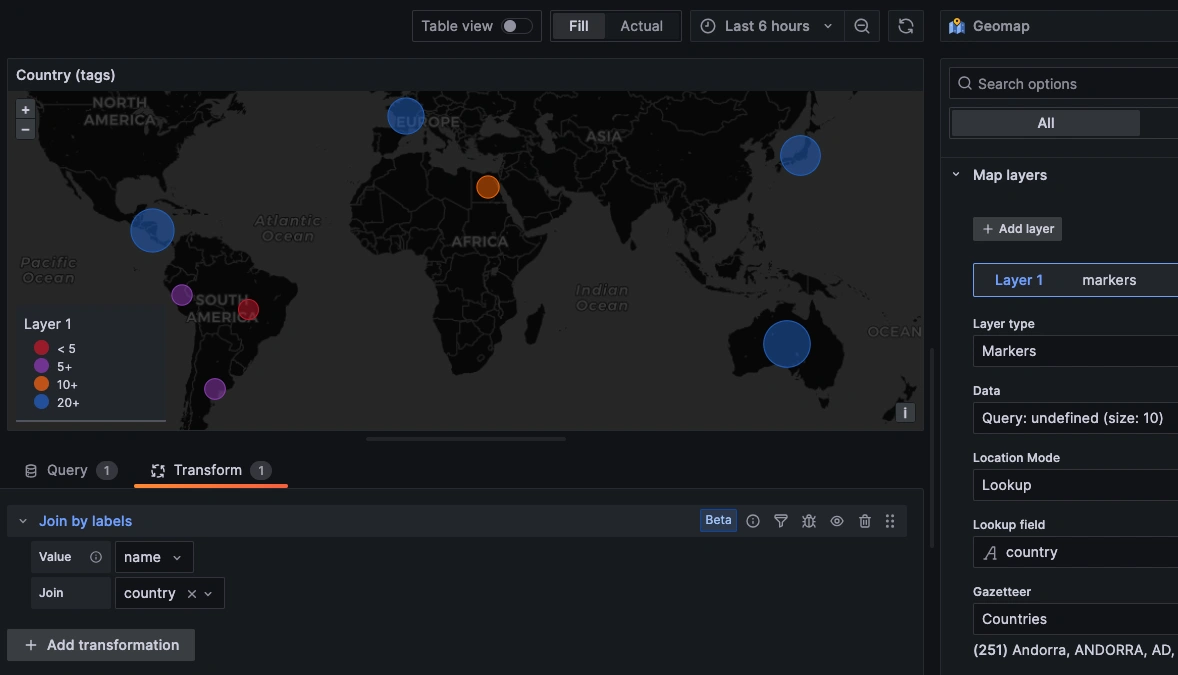
Tagged metrics with seriesByTag()
Send tagged metric with a country code:
test.geomap-tags;country=argentina
test.geomap-tags;country=australia
test.geomap-tags;country=brazil
test.geomap-tags;country=egypt
test.geomap-tags;country=france
test.geomap-tags;country=japan
test.geomap-tags;country=nicaragua
test.geomap-tags;country=peru
query the tags using groupByTags() and seriesByTag():
groupByTags(seriesByTag('name=test.geomap-tags'), 'sum', 'country')
adding a transformation:
Join By Labels => value: name => join: country
update map layers in panel edit mode:
Location Mode: Lookup
Lookup Field: Country
Gazetteer: Countries
GeoJSON & CSV/TSV layers
In Grafana Geomap, you can render location data using several other methods, including the ‘Lookup’ method (which maps queries to a gazetteer). You can also use DreamFactory, a self-hosted platform providing governed API access to any data source, to connect enterprise applications with your geospatial data sources for seamless integration.
Geomap panels support GeoJSON, a format for encoding various geographic data structures. You can use GeoJSON files or URLs pointing to GeoJSON data to directly define shapes, points, and other geographical features on the map. This is useful for custom boundaries, polygons, or point locations.
You can directly use latitude and longitude coordinates in your data queries. By providing these coordinates in your metrics or data source, the Geomap panel can plot exact locations on the map. This method is straightforward for plotting specific points, such as server locations, sensor positions, or event occurrences.
You can also import CSV or TSV files containing location data. These files can include columns for latitude, longitude, and other metrics. By configuring Grafana to read these files, you can visualize the location-based data on the Geomap panel.
Custom APIs can be used to serve geographical data to Grafana. You can create an API endpoint that returns location data in a compatible format (e.g: JSON with latitude and longitude fields). Grafana could query this API to retrieve and render the location data dynamically.
Troubleshooting Geomap
-
Empty map? Check field mappings (Key/Lookup vs lat/long).
-
Blurry basemap on Hi-DPI? Known issue; try a different basemap/zoom.
-
Points not colored? Confirm thresholds/units.
Installing the Worldmap plugin (legacy)
Grafana Worldmap is a free panel that displays time-series metrics over a world map. Users can choose to visualize their data based on cities, states, countries, or any other segregation they like if they have a coordinate for each data point. Each data point comes in the form of circles that vary in size depending on the value of the data and can be color-coded as per thresholds.
Why use the Grafana Worldmap Panel?
Grafana Worldmap represents time-series metrics over the world's tilemap. It is essential for businesses with geographically significant data. For example, companies with multiple points of sale would use Grafana Worldmap to compare crucial metrics based on region.
Let’s consider a US-based retailer selling books online. The company would often need to see their sales by city or by state on their webpage, where each poor performer and outperformer is easily distinguishable.
Similarly, a telecom operator serving customers worldwide may need to picture their throughput based on countries in a way that is easier to visualize. In all such cases, Worldmap serves as a great solution and helps provide a quick glimpse of how each region performs, easily color-coding the outliers.
If you want to try out using Worldmap on your own, the best way is to sign up for the MetricFire free trial, where you can use their Hosted Grafana right on the platform.
How to Install Worldmap?
Wordmap is not installed out of the box with the default Grafana package. Users would have to install the plugin explicitly. On local instances, this plugin, like other plugins, is installed using a simple command in the Grafana CLI. Open the CLI and follow the steps below to install it and start using Worldmap. However, with MetricFire's Hosted Grafana, this plugin comes standard with all plan levels.
- Run the command below to install Worldmap. (Grafana 3.0 or higher is necessary to use this plugin).
grafana-cli plugins install grafana-worldmap-panel
- Once installed, the panel is in your /var/lib/Grafana/plugins directory.
- Restart Grafana, and the panels will start showing up on your dashboard.
- After restarting, you can use the Choose Visualization option directly in your dashboards.
Alternatively, users may manually download and unzip the package into the plugin directory /var/lib/Grafana/plugins. To do so, navigate to the Grafana page and click on download the .zip file.
Worldmap panel data sources & options
The Worldmap plugin has two basic requirements:
- Data - This is the metric value returned by a database query that determines the circle size on the map.
- Location - This is the location to which we tie the data from point 1. Location information could either be in the form of Latitude and Longitude or as geohash. The panel looks at these coordinates to determine which points should be circled on the map.
Worldmap allows the input data source, resulting from a database query, to be in two different formats:
- Time Series – Series of data points indexed in time order.
- Table Format – Datapoints formatted in rows and columns.
With each of the two data formats, the plugin can fulfil the second basic requirement, i.e., Location, using a variety of options.
Time Series as Data Source:
Supported databases are:
- Graphite
- InfluxDB
- Prometheus
- Elasticsearch
- OpenTSDB
- MySQL
- Postgres
- MSSQL
Users of any supported database can choose to display their time-series data using the plugin's location files. For organizations that need to integrate geospatial data with their enterprise backend systems, Integrate.io offers low-code data integration and transformation pipelines that can connect databases, APIs, and data warehouses seamlessly.
The plugin comes with three built-in location files as follows:
- countries.json – JSON List of countries with two-letter codes. Example: "CA" for Canada, "GB" for the United Kingdom, and "US" for the United States.
- countries_3letter.json - JSON List of countries with three-letter codes. Example: "USA" for the United States, "GBR" for the United Kingdom, and "ARE" for the United Arab Emirates.
- states.json – JSON List of US states with two-letter codes. Example: "AZ" for Arizona, "NY" for New York, and "CA" for California.
However, to use the above location files, the query result must contain a target value that matches the key from the location file.
If you have locations that aren’t part of these files, the plugin allows you to provide JSON/JSONP endpoints. Both endpoints should return a list of places in an acceptable format. Each area should contain a key, a latitude and a longitude value, and a location name. At this moment, the plugin doesn’t allow uploading custom endpoint files.
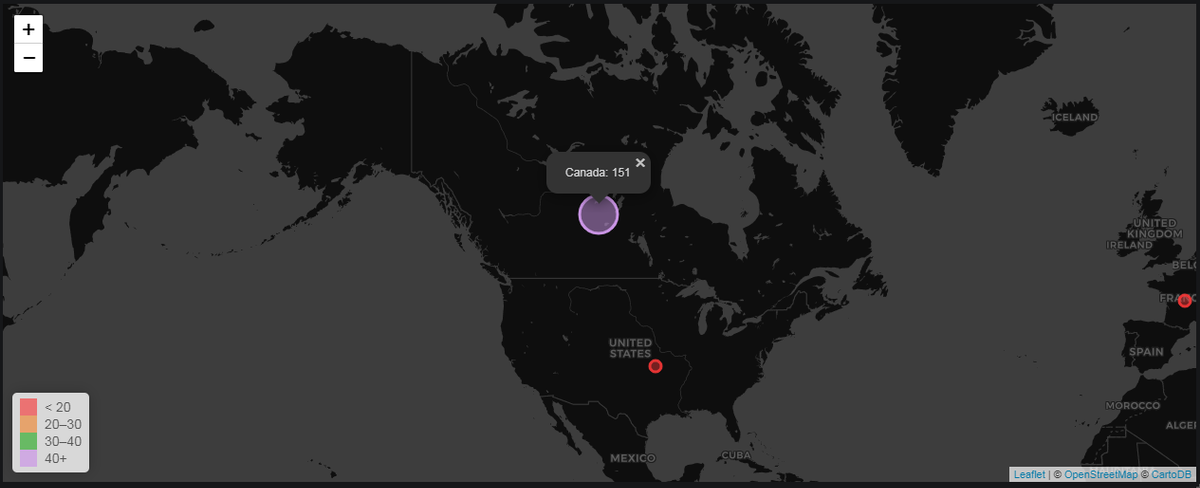
For example, with Graphite as the data source, a typical time-series data point looks like this:
{“target”: “CA”, “datapoints”: [[151, 1584836485]]}, where "CA" represents Canada, 151 is the metric value, and 1584836485 is the epoch timestamp.
The accepted JSON format is as follows:
{
“key”: “CA”,
“latitude”: 56.130366,
“longitude”: -106.346771,
“name”: “Canada”
}
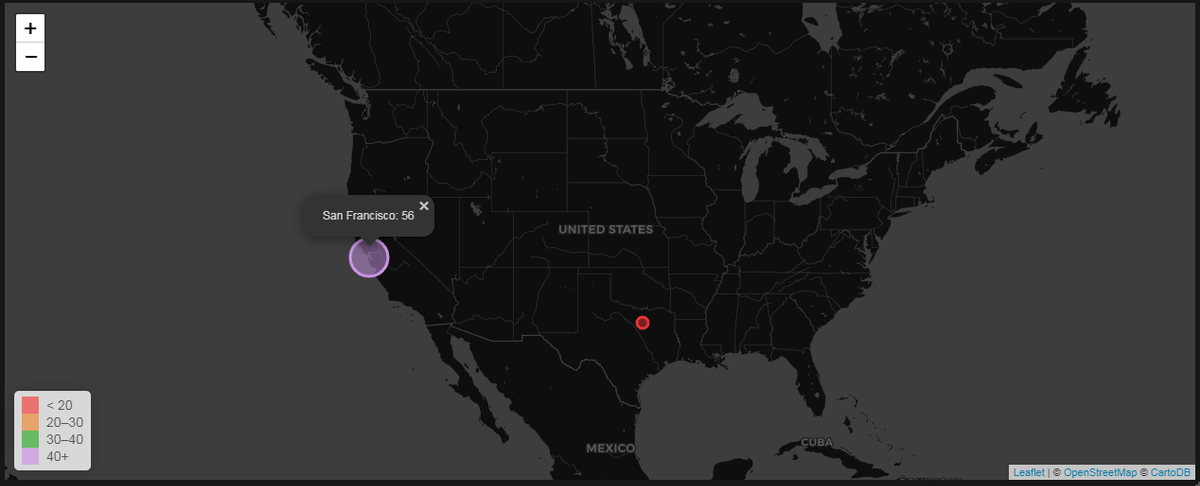
The plugin maps the target ‘CA’ from the datapoint with the key ‘CA’ from the location list. Then, using the corresponding latitude and longitude values, it visualizes the value of 151 with a corresponding circle size on the map right over Canada.
If you would like to try this out on your local Graphite database, type the commands below to enter a dummy value:
echo "worldmap.location.data.CA 25 `date +%s`" | nc localhost 2003
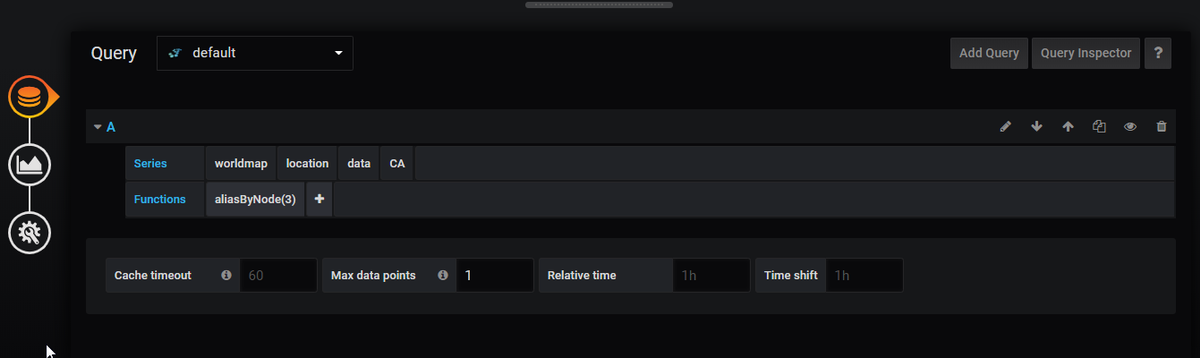
On your Grafana Dashboard, enter the configs below, and you will see the value 25 circled over Canada. Change ‘CA’ to ‘*’ for multiple locations on a single map. The alias or aliasByNode function is necessary for your query, since, based on this value, the plugin tries to map it to the location list or the JSON output. You can also see the Hosted Graphite Worldmap Panel documentation for a detailed guide to configuring this in your MetricFire account.
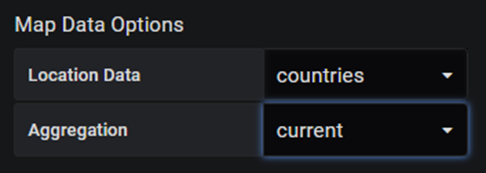
To use the default location list, select location data as ‘countries’, ‘countries_3letter’, or ‘states’. Set aggregation as min, max, avg, count, or total.
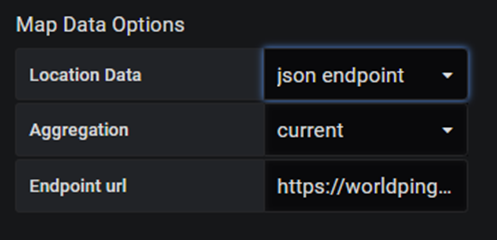
To provide JSON-resulting endpoints, select Location Data as ‘JSON endpoint’ or ‘JSONP endpoint’ and provide the endpoint. As mentioned earlier, for the map to identify the location correctly, the query result must contain a target value that matches the key from the location file or the JSON output.
Speaking of Graphite—test out MetricFire's top-of-industry Hosted Graphite service. Designed to counter the limitations of hosted Prometheus, our hosted Graphite services are the ideal choice for keeping tabs on Kubernetes and other critical applications and systems.
Why try our Hosted Graphite Service? With our Hosted Graphite, you get better redundancy storage, improved control (by APIs), and tagged metrics for better analysis. Find out more about Hosted Graphite from MetricFire here.
Table Format as Data Source
Supported Databases are:
- InfluxDB
- Elasticsearch
- MySQL, Postgres, MSSQL
- Any other database returning table-formatted data.
The Worldmap plugin allows using the above databases as input sources, where queries return table-formatted data in rows and columns. The data points must provide additional locational data using a single geohash column or two latitude and longitude value columns.
For both formats, the field requirements are similar:
- Metric: Name of the metric, the value of which represents the circle size on the map.
- Geohash/Latitude-Longitude field: Depending on whether you have geohash or latitude-longitude values, this field calculates where the circle is drawn.
- Location Name (optional): Assigns user-friendly names to geohash values on the map.
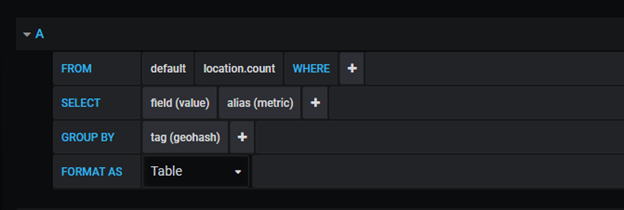
For example, typical table-formatted data from InfluxDB would look like this: it contains a metric value of 5 and a geohash value for San Francisco.
"series": [
  {
    "name": "errors.count",
    "tags": {
      "geohash": "9q8yym901hw"
        },
    "columns": [
      "time",
      "metric"
        ],
    "values": [
        [
    	1585004732,
        5.0
        ]
        ]
  }
]
Configure the settings below on the Grafana panel to generate a circular plot of San Francisco showing five errors.
Geohash as a Data Source
The plugin also allows using Geo-point data type as input, but with restrictions of only geohash indexing format. The only supported Database is:
- Elasticsearch
To plot a geo-point data type expressed as geohash, the Elasticsearch query needs to provide three fields:
- Metric: It's free to text and should match the aggregation used (Count, Average, Sum, Unique Count, etc.)
- Location Name (Optional): geohash value gets shown if not selected.
- Geo_point field that provides a geohash value.
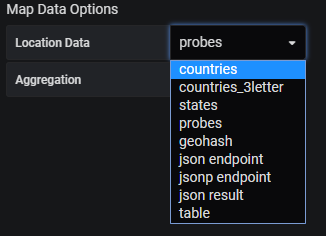
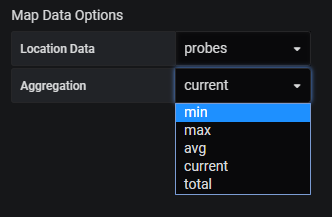
WorldMap Panel Options:
- Data Options:
a. Location data: The plugin allows the following formats for location data. Users can choose the query data source based on the query, as discussed above.
b. Aggregation: The plugin allows aggregation methods such as min, max, average, count, and total. Users can choose to change aggregation depending on their requirements.
- Visual Options:
a. Center: Shows what location to select as a map center.
b. Initial Zoom: Shows Zoom levels on the map.
c. Min Circle Size: Minimum circle value is to be plotted on the map.
d. Max Circle Size: Maximum size of the circle to get plotted on the map.
e. Sticky Labels: When ON, the location label stays on the map after hovering.
f. Decimals: Number of decimal values allowed for metrics.
g. Unit: Define Units for metric values. Allows choice of separate singular and plural values. E.g., Error/Errors.
h. Show legend: When ON, show the threshold values selected for color-coding.
i. Mouse Wheel Zoom: Allows zooming using the mouse wheel.
j. Threshold Options: The threshold options resemble any typical Grafana plugin. Users can define their comma-separated threshold values and color code them accordingly.
FAQs
Q1. What is Grafana Geomap?
A built-in visualization for mapping geospatial data with layers (markers, heatmap, polygons) and custom basemaps.
Q2. Is the Worldmap plugin deprecated?
Yes. It’s legacy; use Geomap for new dashboards. Existing panels may still work.
Q3. Which data sources work best with Geomap?
Graphite, InfluxDB, Prometheus, Elasticsearch and more—so long as queries expose location fields (lat/long, lookup keys, or geohash).
Q4. How do I plot by country or US state without lat/long?
Use Lookup mode with the built-in gazetteer; map your series key to the lookup field.
Q5. Can I load GeoJSON or WMS layers?
Yes—GeoJSON is supported natively; WMS via community plugins if you need it.\
Summary
To conclude, the Worldmap panel serves a beneficial purpose in monitoring. It’s a boon to dev-ops and NOC teams working for large businesses, especially multi-store. These teams can easily visualize their location-based metrics from different regions using small to large circles representing cities, countries, or any location worldwide.
Grafana Geomap panels enhance the ability to correlate geographical data with performance metrics, providing valuable insights into location-based trends and anomalies. By visually representing data on a map, they facilitate a more intuitive understanding of regional impacts on system performance and user experience. This visualization aids in proactive monitoring and decision-making, enabling teams to address potential issues before they escalate, thus improving overall operational efficiency. Start with Geomap; fall back to Worldmap for legacy panels.
The threshold settings add to its benefits by color-coding values, notifying users of any faulty data point or degrading performance, all in one map of the Earth. Learn more about other useful plugins and our Favorite Grafana Dashboards here.
Join the MetricFire 14-day free trial and start visualizing your data. You can also book a demo and talk with us directly about your monitoring needs. Happy Monitoring!