
Table of Contents
Great systems are not just built. They are monitored.
MetricFire runs Graphite and Grafana as a fully managed service for growing engineering teams, taking care of storage, scaling, and version updates so your team doesn't have to. Plans start at $19/month, billed per metric namespace rather than per host, and include engineer-staffed support. Integrations work natively with Heroku, AWS, Azure, and GCP, and data is stored with 3× redundancy in SOC2- and ISO:27001-certified data centres.
Introduction
Grafana is an open-source analytics and interactive visualization web application used for monitoring application performance. It allows users to ingest data from a wide range of sources, query and display it in customizable charts, set alerts for abnormal behavior, and visualise data on dashboards. Its open-source nature, however, requires users to manually maintain their Grafana instance, a task that is handled by MetricFire's Hosted Grafana offering, which provides all the functionality with none of the management overhead.
Here we detail what is Grafana, its features and data sources.
Key Takeaways
-
Grafana is an open-source analytics and interactive visualization web application that allows users to ingest data from various sources, query this data and display it on customizable charts for easy analysis.
-
Grafana comes with a variety of visualization options to help users view and understand their data, which are split into "panels" that are then used to build the Grafana dashboard.
-
The platform has built-in support for a wide range of notification channels, including email, Slack, PagerDuty, and more, and allows users to set alerts to be notified of abnormal behavior.
-
Grafana allows users to annotate, or leave notes directly on graphs, providing a way to seamlessly mark important points on their graphs and serve as a reminder for further action in the future.
-
The platform is completely open source and backed by an active vibrant community, but the open-source nature requires users to manually maintain their Grafana instance.
What is Grafana? - Overview
Today, almost every application stack would usually consists of a number of different applications, each performing a specific role and working together towards a common goal. This is the case whether it be that of a Fortune 500 company or a computer science student trying to complete a tech project.
As such, the stability and reliability of your infrastructure would greatly depend on the performance of each application within that infrastructure.
Understanding the state of these applications is vital to keeping your systems in the best shape possible. This is done by monitoring our applications, in other words, collecting data (usually in the form of time series data) about these applications that would inform you of their current state at all times.
The larger your stack, the more applications you need to monitor to ensure your infrastructure is healthy. This would lead to collecting large amounts of performance data on your application. You would then require a massive amount of effort to parse through and make sense of this data, which is not a pretty task without the right tool.
Grafana was made exactly for this purpose!
Grafana is an open-source analytics and interactive visualization web application. It allows you to ingest data from a huge number of data sources, queries this data and display it on beautiful customizable charts for easy analysis.
It is also possible to set alerts so you can quickly and easily be notified of abnormal behavior and lots more. In simple terms, Grafana allows you to transform the mountain of performance metric data collected from your applications, into visualizations. This will allow you to draw conclusions and make decisions to keep your application stack healthy.
By utilizing performance metric data, MetricFire specializes in monitoring systems by using both Graphite and Grafana. You can use our product with minimal configuration to gain in-depth insight into your environment.
If you would like to learn more about it you must book a demo with us, or sign on to the free trial today.
What features does Grafana have?
Grafana comes with a plethora of features that provide value straight out of the box. These features are the reason Grafana is arguably one of the most popular visualization software available for metric monitoring, simply because of their ease of use:
1. Visualization
Grafana possesses a huge variety of visualization options to help you view and understand your data easily. These options are split into “panels” which are then used to build the Grafana dashboard.
A panel is the most granular visualization building block in Grafana and is used to display data that has been queried from the data source attributed to that panel. For easier understanding, think of a panel as a space on the dashboard that houses a specific type of visual portrait of information.
This information is being pulled from the data source attributed to that panel and can be a type of graph (gauge, histogram, bar chart, etc.), or logs and alerts. For example, one could create a gauge panel with its data source set to Prometheus, and then query CPU usage data stored in Prometheus to be displayed on this panel. Such a panel would look like this:
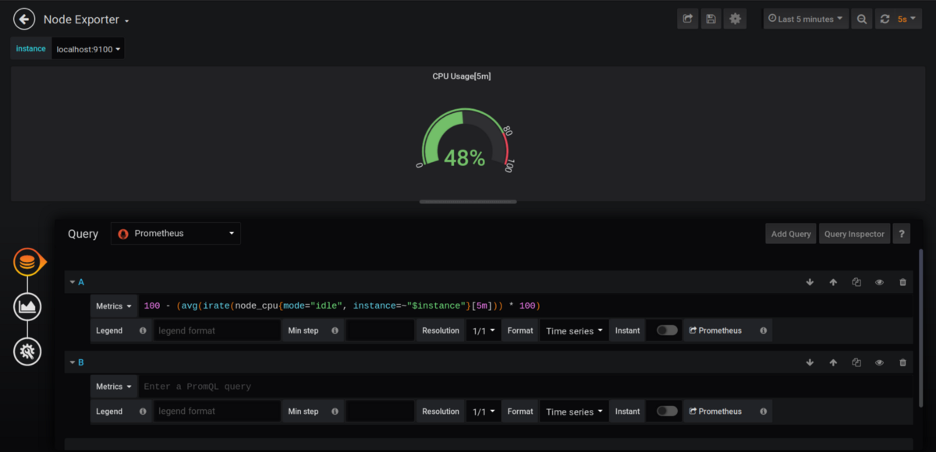
You could stack up panels like this to make up a dashboard, with each panel displaying its own piece of information in the manner that best suits you. Worthy of note is the fact that although Grafana ships with some pretty cool panels, you could design and add your own panels using plugins - the power of Open Source.
Check out these MetricFire articles (Grafana plugins and Grafana plugins explained) on how to set up Grafana plugins. For a more in-depth look into Grafana dashboards, look no further than this MetricFire article.
2. Alerting
When monitoring applications, it is essential to be made aware the second something goes wrong or is abnormal. This is vital to keeping your systems healthy and reducing downtime. Grafana has built-in support for a huge number of notification channels, be it email, Slack, PagerDuty, etc., whichever best suits you.
In order to create an alert, you’d have to create and configure an alert rule. This rule serves as a trigger for your alert, such that whenever said rule is broken, an alert notification is sent via the alert notification channel you had configured into the rule. For a more detailed look into Grafana alerts, look no further than this MetricFire article - Grafana alerting.
3. Annotations
Grafana allows you to annotate, or in simple terms, leave notes directly on graphs. This simple but powerful feature provides a way to seamlessly mark important points on your graph. This serves as a reminder for further action in the future, to provide context to an onboarding team member, or to simply mark a special event on your graph.
Think of it as writing a sticky note and placing it directly on your graph, but this time, you don’t need any sticky note papers. Further information on annotations can be found in our Grafana annotations tutorial article (yes, we have articles for everything Grafana!).
4. Open Source
Grafana is completely open source and backed by an active vibrant community. This presents some huge benefits to its users such as the flexibility to develop and publish their own plugins or use plugins developed by other people. These plugins are usually easy to install by pretty much downloading the source code and running it manually.
However, its open-source nature does pave the way for some drawbacks. For example, you would have to manually maintain your Grafana instance yourself, manually perform updates and so on. These drawbacks are completely handled by MetricFire’s Hosted Grafana offering, which provides all the functionality Grafana has to offer, with none of the management overhead.
Book a free trial today or call for a demo with our team to try it out.
What Data sources does Grafana have?
Grafana is a tool used to analyze and visualize data. But this data would have to be stored somewhere in order for Grafana to access and display it. These databases are what we refer to as data sources, and a Grafana datasource is simply any database from which it can pull data. For enterprises managing multiple data sources and needing governed API access across systems, DreamFactory provides a secure, self-hosted platform that enables controlled data access to any data source, which can then be queried and visualized in Grafana.
All you have to do is create a connection between your Grafana instance and that data source and provide a data query. Grafana would then pull and display data from this data source at predefined/configurable intervals based on the query provided. Each data source supported by Grafana has a specific query editor for an optimal query writing experience.
It can be customized for the capabilities and features peculiar to that data source, with some of these editors having an autocomplete feature. You could also display data from multiple data sources on a single dashboard. This can be achieved in a couple of ways.
First, by separating out the data sources such that each panel in the dashboard displays data from a separate data source. Second, use a special “mixed” data source, which allows you to combine data from multiple data sources onto a single panel.
Due to its open-source nature, Grafana has native support for a massive number of databases. However, if your database is not supported by Grafana at this moment, you can write up a plugin through which your database would interact with Grafana. It would then work the same as though it had native support for that database.
For this reason, it's highly likely that you would be able to export your data to Grafana, no matter where it's stored.
How MetricFire can help with hosting your Grafana instance
Grafana is an open-source analytics and visualization web application that allows you to ingest data from various sources, query the data, and display it on customizable charts for easy analysis. It is designed to help you monitor your application performance and infrastructure health by collecting large amounts of performance metric data and transforming it into visualizations. Grafana comes with features like visualization, alerting, and annotations, and is open-source. The tool is used to visualize data stored in databases such as Graphite. While its open-source nature can have some drawbacks, MetricFire's Hosted Grafana offering provides all the benefits of Grafana with none of the management overhead.
MetricFire provides a managed Grafana, offering users the ability to directly use Grafana as a cloud-hosted web app without the need to install or set up Grafana locally. This offering is completely maintained and upgraded by MetricFire and takes away the manual update and maintenance cycles required by normal open-source applications. This allows you to focus solely on monitoring your system.
Sign up for a free trial today to take our Hosted Grafana for a spin, or schedule a demo to speak to one of our experts to help you get started.