
Table of Contents
Great systems are not just built. They are monitored.
MetricFire runs Graphite and Grafana as a fully managed service for growing engineering teams, taking care of storage, scaling, and version updates so your team doesn't have to. Plans start at $19/month, billed per metric namespace rather than per host, and include engineer-staffed support. Integrations work natively with Heroku, AWS, Azure, and GCP, and data is stored with 3× redundancy in SOC2- and ISO:27001-certified data centres.
Problem: Our application receives alerts every day about system performance, code bugs, and other issues. We need a way to delegate these problems to the correct people.
Solution: Use PagerDuty to create alerts that are assigned to specific people.
What is PagerDuty?
PagerDuty is a platform that lets you track alerts from several different products on a single application, and can let you assign alerts to specific people on your team. Today we will add an alert to PagerDuty that is coming from MetricFire's product, Hosted Graphite. Check out the MetricFire free trial so you can follow along with this tutorial. When something goes wrong with the system metrics that are being monitored, MetricFire will send a notification to PagerDuty.
Setting Things Up
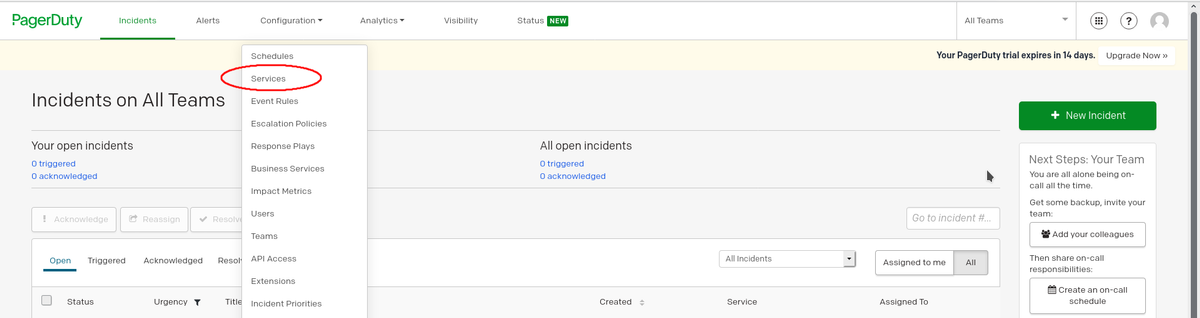
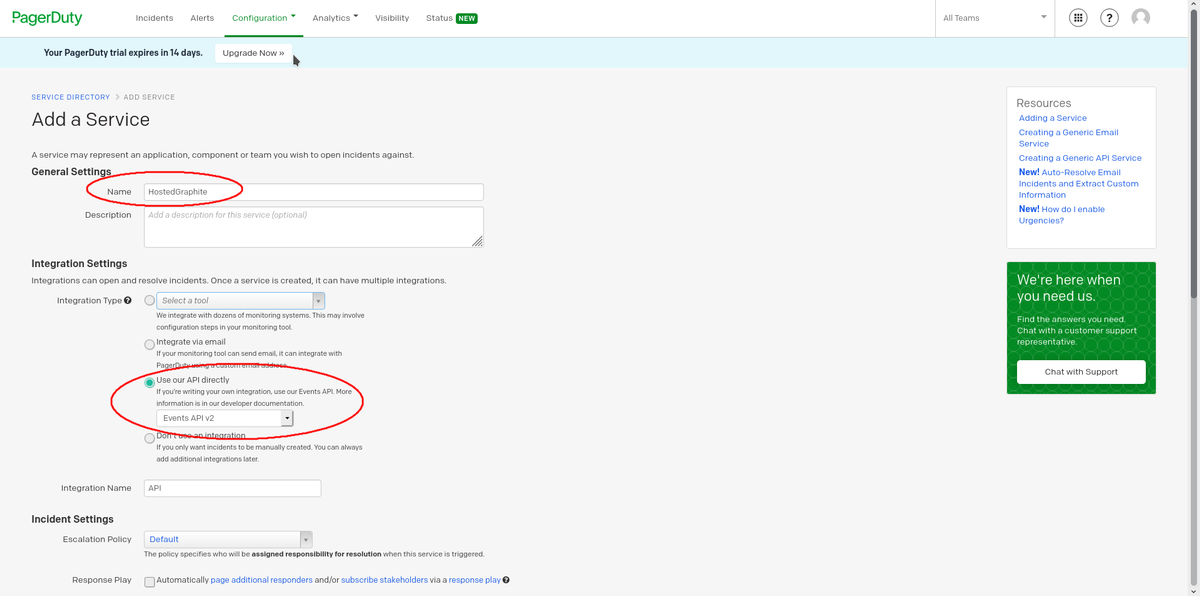
PagerDuty side: Let’s first create a service. From your PagerDuty dashboard, go to Configuration > Services > + New Service.
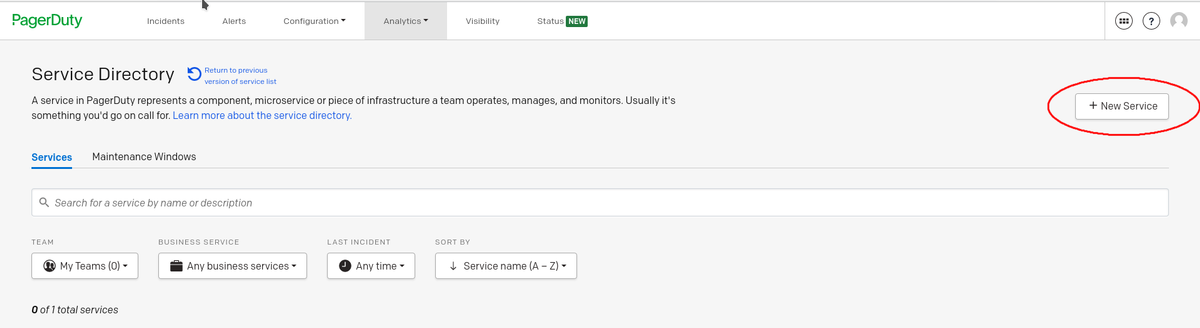
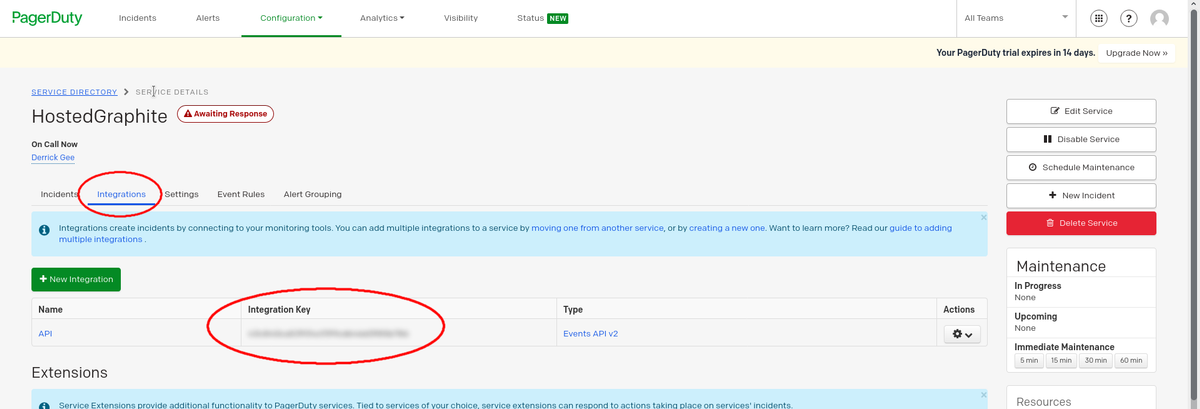
Next, we will name our new service. Then under Integration Settings, we want to check ‘Use our API directly. This will give us an integration key for the new service we just made under the service’s integration tab. Now we can add this integration key to our Hosted Graphite account.
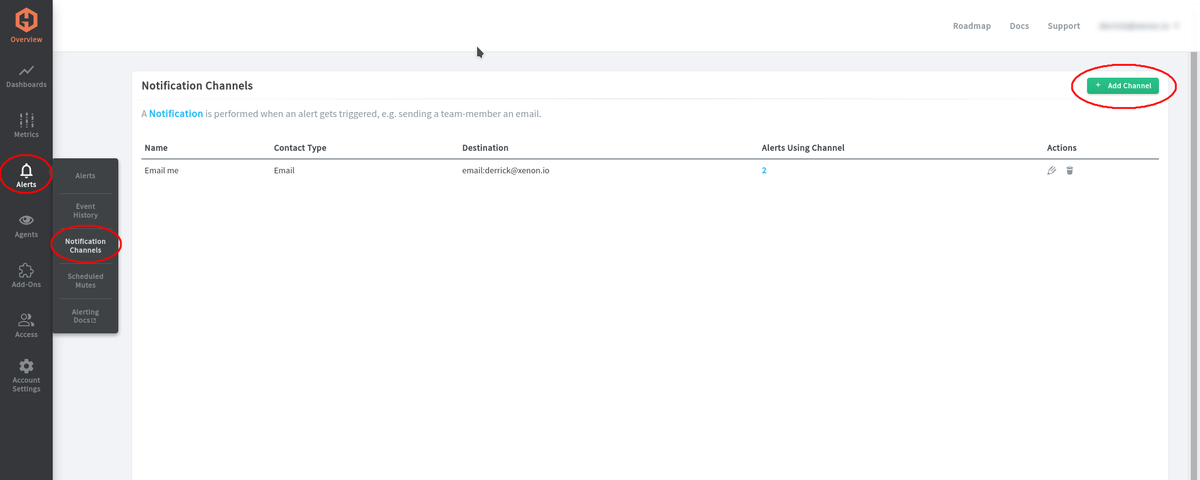
Hosted Graphite side: From our Hosted Graphite dashboard, let’s go to Alerts > Notification Channels > + Add Channel.
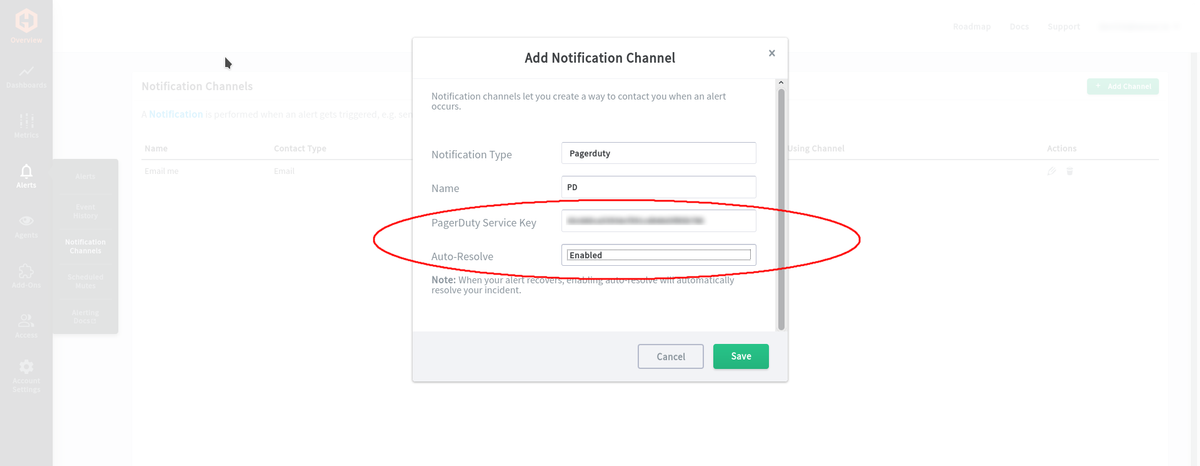
We will need to set the Notification Type to PagerDuty, give it a name, and then insert that integration key we just got from our new service on PagerDuty. Now we can use this new channel for the notification channel for alerts that we create on Hosted Graphite.
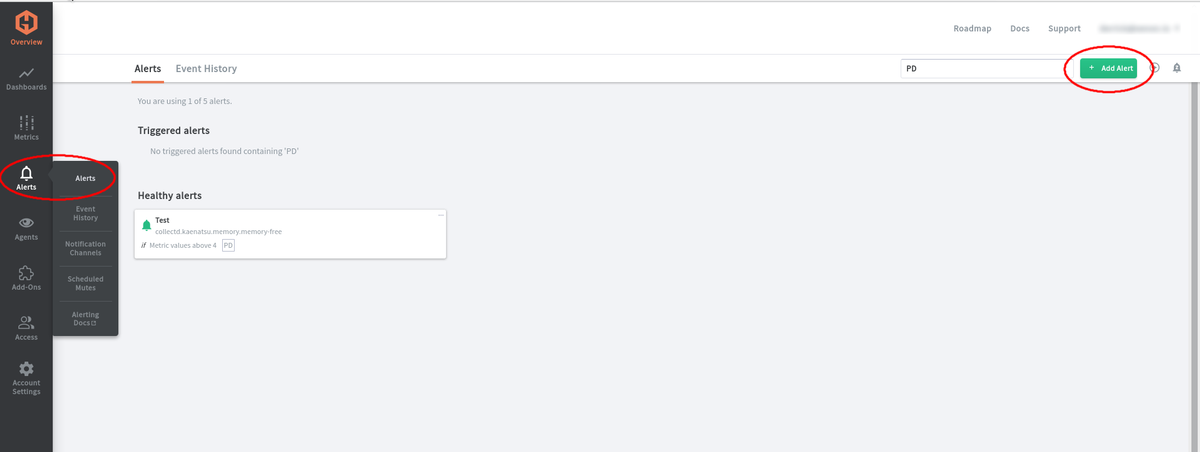
Next, let’s create some alerts on one of our graphs. Go to Alerts > Alerts > + Add Alert.
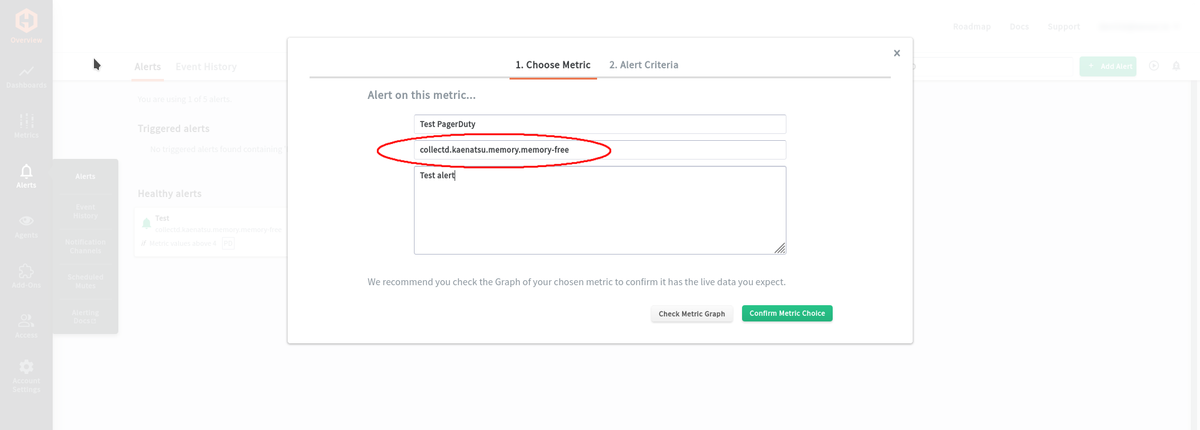
Give the alert a name, and then be sure the metric query is correct. You can go to Metrics > Metrics Treemap to reference the query you want.
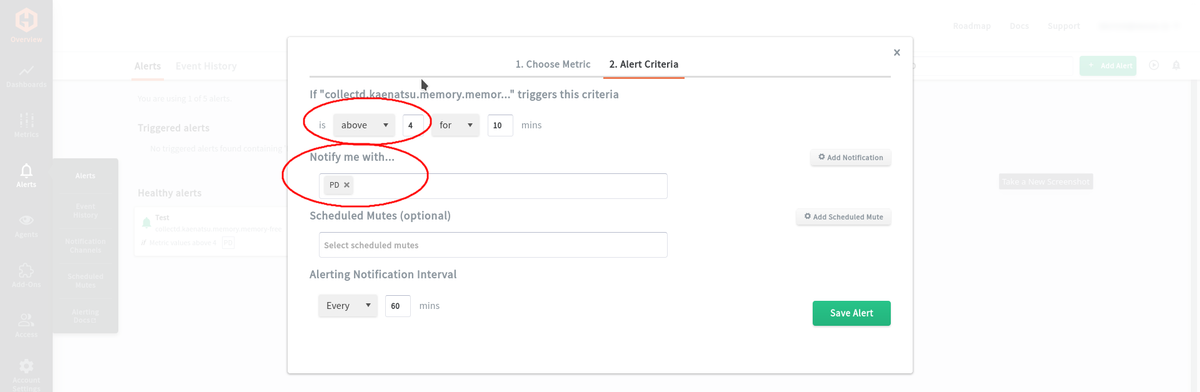
Next, we will set the criteria for the alert. The alert can be set to fire if the value is above or below a certain point, or if the value goes completely missing. Once you have it set to what you want to keep track of, be sure to set ‘Notify me with…’ to your new PagerDuty notification channel that we created in the above images.
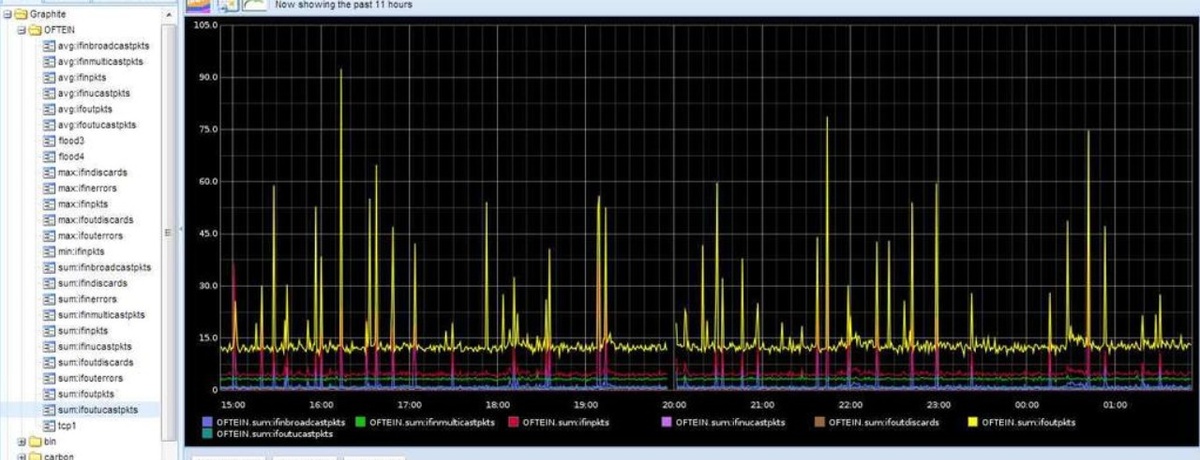
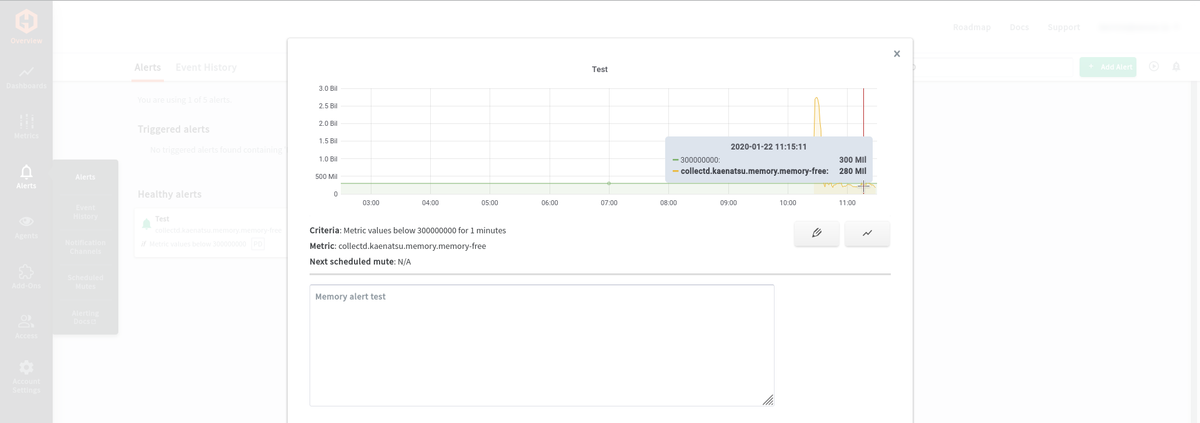
You can check to see if the metric query is working by going back to ‘1. Choose Metric’ and click on ‘Check Metric Graph’ at the bottom of the window. Something like the image below should show up.
The Result
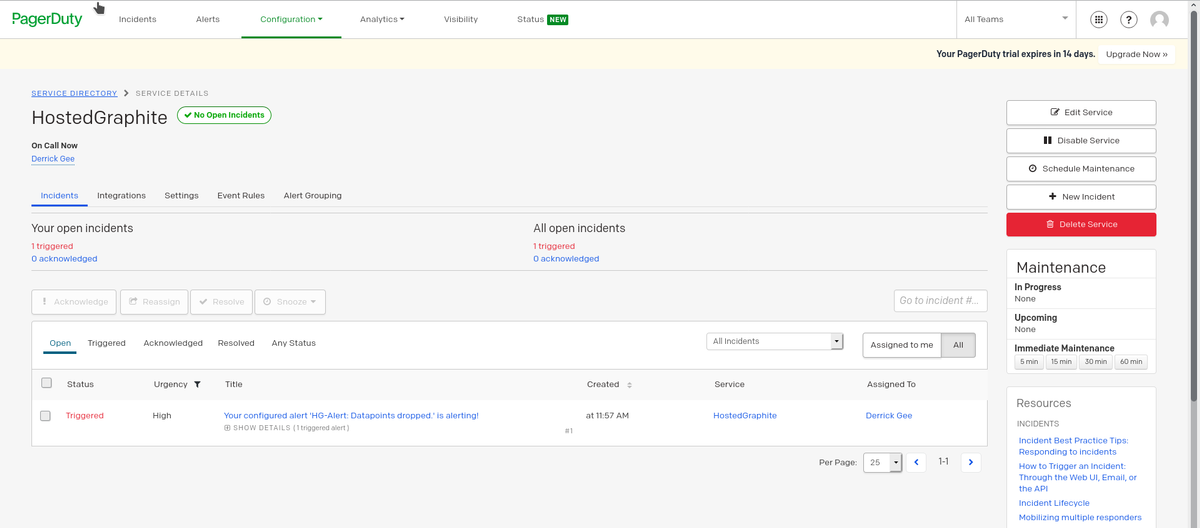
Once the alert criteria reaches it's threshold, you should get a detailed alert on your PagerDuty’s service that you set up with Hosted Graphite. Now you are able to manually or automatically delegate tasks to specific individuals on your team whenever an alert pops up.
Get to know MetricFire better, and get a free trial so you can start making dashboards right away. Feel free to book a demo if you have questions about what Hosted Graphite can do for you.