
Table of Contents
Great systems are not just built. They are monitored.
MetricFire runs Graphite and Grafana as a fully managed service for growing engineering teams, taking care of storage, scaling, and version updates so your team doesn't have to. Plans start at $19/month, billed per metric namespace rather than per host, and include engineer-staffed support. Integrations work natively with Heroku, AWS, Azure, and GCP, and data is stored with 3× redundancy in SOC2- and ISO:27001-certified data centres.
This article will give an overview of the native Graphite dashboard and how Grafana differs from it. It will first focus on Graphite's Dashboard UI and then branch out into a comparison of Grafana with the Graphite Dashboard UI, highlighting the best features of both platforms.
What is Graphite?
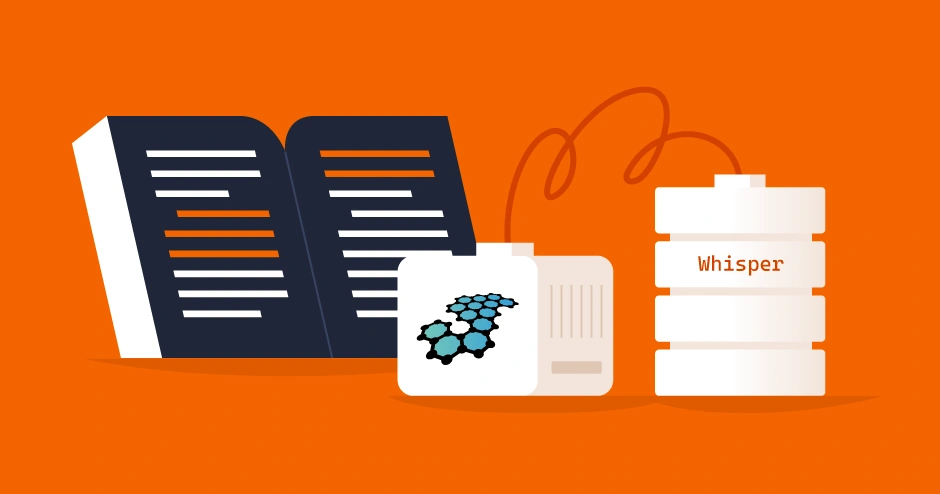
Graphite is an open-source real-time monitoring software for graphing numeric time series data. Time series data is received through Carbon daemons and recorded in the Whisper database. Graph rendering happens on-demand through the Graphite web app built in Django. To learn more about Graphite, check out our article on architecture and concepts or Graphite installation and setup.
Also, check out the MetricFire free trial, where you can send metrics and try out the dashboards yourself. You can apply what you learned and make dashboards directly on the platform.
Getting the most out of Graphite
Graphite Dashboard UI
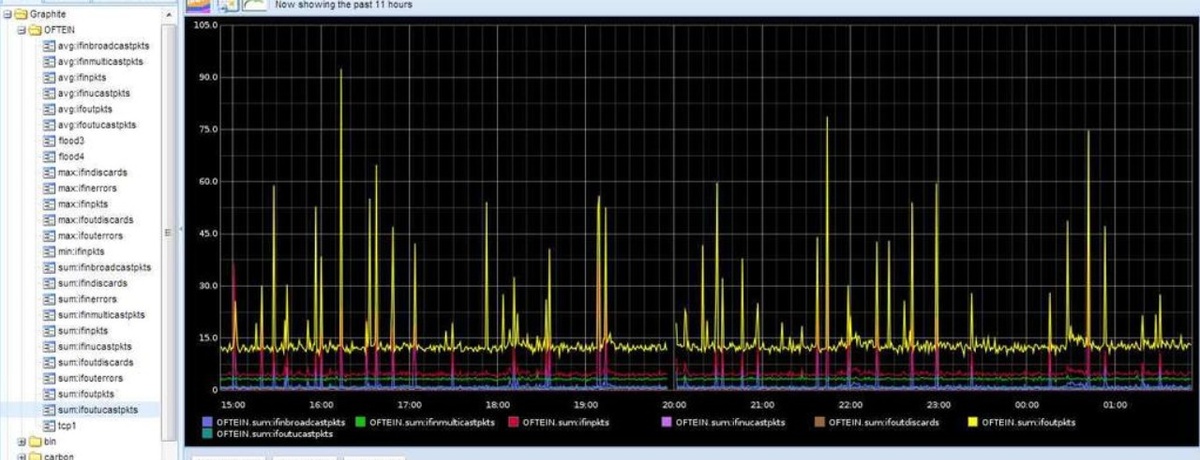
Graphite's Dashboard creation UI is set up directly in the Graphite web app. Each Dashboard can consist of more than one graph. You can choose metrics to graph in the completer on top of the Graphite composer or display metrics in a tree structure and select them there.
The Graphite Dashboard UI has the following features:
Operations on metrics - allows you to transform metric series using predefined functions.
A metric series is a set of data points. One metric element can have one or more metric series. Graphite has predefined operations that can morph these metric elements by performing operations on the data.
Graph customization - allows you to adjust the graph
How everything is rendered within a graph can be specified within the Render Options menu, which is visible with a single click over any graph. Graphite has some functions that only work on a graph and not on a single metric element. Here are some significant features available for Graph rendering:
- Display options allow you to set up fonts and colors, show or hide axes, apply a template, and more.
- Line Mode sets how a line in a graph is rendered (slope, staircase).
- You can specify the X-axis's time zone and date/time format.
- Y-axis metrics can be any data mapped concerning time; hence, there are more functions to manipulate how these are displayed. For example, you can set up labels, minimum/maximum values, unit systems, the number of minor lines that appear, and the side the axis is shown on.
Miscellaneous Operations - allows you to do more interesting operations such as cloning graphs, emailing, and rendering graphs from a URL
Operations like Breakout, for example, create one graph per metric. After rendering these, the original graph is removed. Other operations available are cloning, emailing, and rendering a graph from a URL.
Graph Resizing - changes the appearance on the dashboard
You can resize graphs by entering their horizontal and vertical dimensions in pixels or selecting a preset size from the Graphs -> Resize menu.
Events - keep track of changes
This is used to mark events that could affect metrics directly in the graph, such as when a feature is released. This is a lesser-known feature of Graphite. Setting up events can be done through Graphite's JSON API, or through the GUI.
No Login Requirement - not easy to share
Only a local setup is required to use the Graphite Dashboard UI. Graphs and dashboards can be shared easily, but collaboration is difficult as shared accounts are unavailable on vanilla Graphite.
Alerting Implemented Through Seyren and Cabot
Seyren is a dashboard for Graphite, and its core is written in Java. Its focus is only on alerting. It is configurable through various environment variables and provides a simple interface for setting up alerts. The most remarkable thing about Seyren is its support for a dozen Alert channels. Seyren has exclusive alerts, such as its integration with Hubot and IRC. It takes data directly from locally hosted Graphite when specifying what port it runs on. However, it is a rather old tool and is no longer maintained.
Cabot is another alerting tool for Graphite developed by Arachnys. It can send alerts via email, SMS, and call.
Grafana - A comparison with Graphite visualization
Grafana is a full-fledged visualization tool compatible with various data sources. You can read about it in more detail in our blog article about Grafana Dashboards. When using Grafana with Graphite, Grafana works as an interface for creating Dashboards and editing graphs. Grafana is feature-rich and built to set up dashboards easily and effectively.
Here are things that Grafana does better than the native Graphite dashboard UI:
Rich Visual Customization
The Graphite web app renders graphs using its Render API, which is powerful, but Grafana has more potential for custom data visualizations.
In Grafana, metric visualization isn't limited to graphs. Grafana has over 20+ ways to display data visually. Any customization applied to a graph or a dashboard is quickly rendered on the web front-end.
Customizing a graph in the Graphite dashboard UI requires a lot more work. Navigating through multiple drop-downs to find a feature is time-consuming. Grafana keeps everything on the same level.
Working with Metrics
Alongside extensive graph customization, Grafana offers a different way to set up metrics for a graph. Grafana has a Graphite Query editor feature, allowing quicker metric selection from drop-downs. Functions and their parameters can be quickly modified in this space.
Setting up Annotations
Annotations are Grafana's equivalent of Graphite Events; they are much easier to set up. Tags and descriptions form an annotation. They can be pulled into Grafana from pre-existing Graphite Events or set up by clicking on a data point on a graph and entering the required metadata. Some add-ons automatically create specific annotations when an action occurs.
Alerts
Alerts are not supported in Graphite dashboard UI without extensions, making this a critical benefit of using Grafana.
Alerting exists to communicate unusual metric changes through notification channels. These channels usually exist in real-time communication with clients or incident management platforms. Alert rules are available for setup through graph panels in a Grafana dashboard.
Notifications are generated and sent out only when specific alert rules are triggered.
Grafana can send a PNG image of the graph panel when an alert is triggered. It primarily supports Slack, Pagerduty, VictorOps, email, and webhooks as notification streams.
Navigation and Organization
Grafana has several keyboard shortcuts to go around things. For example, zooming in on a graph can be quickly done by clicking and dragging a selection rectangle. Dashboards can be organized within folders and playlists. Folders have custom access permissions, and playlists are helpful for dashboard presentation.
However, Graphite dashboard UI does accomplish some remarkable things in comparison:
One-stop setup
Graphite dashboard UI is better for quickly displaying data on a graph without additional setups.
Lots of Extensions
Graphite has been an open-source tool since 2008, and that shows in the plenty of other integrations built to work with it. 80+ functional tools extend Graphite or use it as a data source.
Hosted Graphite by MetricFire
MetricFire is a collection of services that help you collect, store, and visualize metric data from any source. MetricFire brings together the power of Grafana and Graphite on a common web platform. MetricFire's Hosted Graphite provides the following features:
- Quick flexibility between Graphite composer, Graphite dashboard UI, and Grafana
- Local Grafana integration
- More features over Vanilla Graphite
- Team account support, where users can be given limited or unrestricted access
- Ready-made Dashboards
- Cluster native storage
- tagging and annotations on metrics
Even more to power Graphite
Graphite has been around for a decade, and many tools work well with it and focus on different aspects of the time-series data pulled in. Here are a few more visualization tools that work well with Graphite:
Graphene
Graphene is capable of displaying thousands of data points in real time. It was built with a focus on Graphite as a data source.
Graphsky
Graphsky is a built-in dashboard tool for Graphite using PHP. It builds graphs using JSON files. The simple UI focuses on graphs, controlling which graphs are displayed and when.
Targets-io
A dashboard app for organizing, analyzing, benchmarking, and reporting results of performance tests run over metrics stored in Graphite.
Tasseo
Tasseo is a lightweight, real-time dashboard that can be used with Graphite and other time-series databases.
TimeSeriesWidget
TimeSeriesWidget can be used to add time-series graphs to an app/website. It's a plugin to make highly interactive graphs with easy options to toggle between visible and invisible components on a graph.
Conclusion
Graphite provides an easy way to get time-series data into a database. Grafana takes Graphite visualization two steps further by introducing features that work well with the established Graphite metric format. MetricFire goes beyond by allowing us to use both the Graphite dashboard UI and Grafana with just the typical out-of-the-box installation.
Get a free MetricFire trial and try out Hosted Graphite and Grafana. You can also book a demo and talk to us directly about your monitoring needs.