
Table of Contents
Great systems are not just built. They are monitored.
MetricFire runs Graphite and Grafana as a fully managed service for growing engineering teams, taking care of storage, scaling, and version updates so your team doesn't have to. Plans start at $19/month, billed per metric namespace rather than per host, and include engineer-staffed support. Integrations work natively with Heroku, AWS, Azure, and GCP, and data is stored with 3× redundancy in SOC2- and ISO:27001-certified data centres.
Introduction
Monitoring and visualizing metrics are crucial tasks in today's data-driven world, especially when dealing with time-series data. Grafana, an open-source analytics and monitoring solution, has emerged as a powerful tool for this purpose. Developed and supported by Grafana Labs, Grafana offers the ability to query, display graphs, and set alerts on time-series metrics, regardless of where the data is stored. With its lightweight backend and support for over 30 data sources, Grafana has become a go-to choice for thousands of companies looking to monitor and analyze their data.
In this article, we delve into the world of Grafana and explore how to harness its capabilities by integrating it with Graphite, one of the most popular backend data sources. We'll provide you with step-by-step instructions on setting up the integration, forming Graphite queries, and rendering meaningful graphs in Grafana. Whether you're a seasoned monitoring expert or just getting started, these insights will help you master the art of reading Graphite metrics using Grafana. So, let's dive in and unlock the full potential of these powerful tools for monitoring and visualization.
Key Takeaways
- Grafana is an open-source analytics and monitoring solution developed by Grafana Labs. It allows users to query, display graphs, and set alerts on time-series metrics from various data sources.
- Grafana has a lightweight backend and can integrate with multiple data sources, making it a versatile tool for exploring metrics, visualizing data, and monitoring in real time.
- Grafana supports over 30 open-source and commercial data sources, including Graphite, InfluxDB, Prometheus, Elasticsearch, and more.
- Users can create dashboards and panels in Grafana to visualize data from Graphite by forming Graphite queries and rendering graphs. The article explains how to create and configure these dashboards.
- Aggregation functions specific to the Graphite backend, such as scaleToSeconds, movingAverage, and alias, can be applied to the data to customize visualizations.
What is Grafana?
Before getting started on how to read Graphite metrics, let us first dive into understanding what Grafana is all about. In a nutshell, Grafana is an open-source analytics and monitoring solution developed and supported by Grafana Labs. It allows you to query, display graphs, and set alerts on your time-series metrics no matter where the data is stored.
Grafana has a very lightweight backend and can seamlessly integrate with your workflow to help explore metrics, visualize data, explore logs, evaluate data points, and notify issues in real time. Grafana supports over 30+ open-source and commercial data sources and is backed by a vibrant community of developers. It’s used by thousands of companies today to monitor anything and everything.
MetricFire has an ongoing free trial for Hosted Grafana and Hosted Graphite. You can also schedule a demo and see what is a good fit for you!
Data sources in Grafana
Grafana supports a wide range of data sources to power its excellent graphs. These data sources include time-series databases, relational databases, log aggregation systems, cloud monitoring systems, etc. Currently, supported data sources include:
- Graphite
- InfluxDB
- Prometheus
- PostgreSQL
- OpenTSDB
- Elasticsearch
- MySQL
- Microsoft SQL Server
- Google Cloud Monitoring
- AWS Cloudwatch
- Azure Monitor
- Loki
Graphite, InfluxDB, Prometheus, and Elasticsearch are among the most popular backend data sources for Grafana. For the scope of this article, we will only focus on Graphite and explore different ways to see how to read Graphite metrics into Grafana. Platforms like Integrate.io can help streamline data integration pipelines if you need to route your metrics through ETL or reverse ETL processes before they reach Grafana. Check out our article on how to use Graphite with Grafana.
Integrating Graphite with Grafana
To read the Graphite metrics with Grafana, it’s important to integrate with it first. Grafana comes with a built-in plugin that can be directly used to connect and fetch data from graphite instances located on the same/different servers. Follow the steps below to quickly set up Grafana-Graphite integration.
1. Open Grafana and click on the * icon (settings tab) in the left vertical navigation bar.
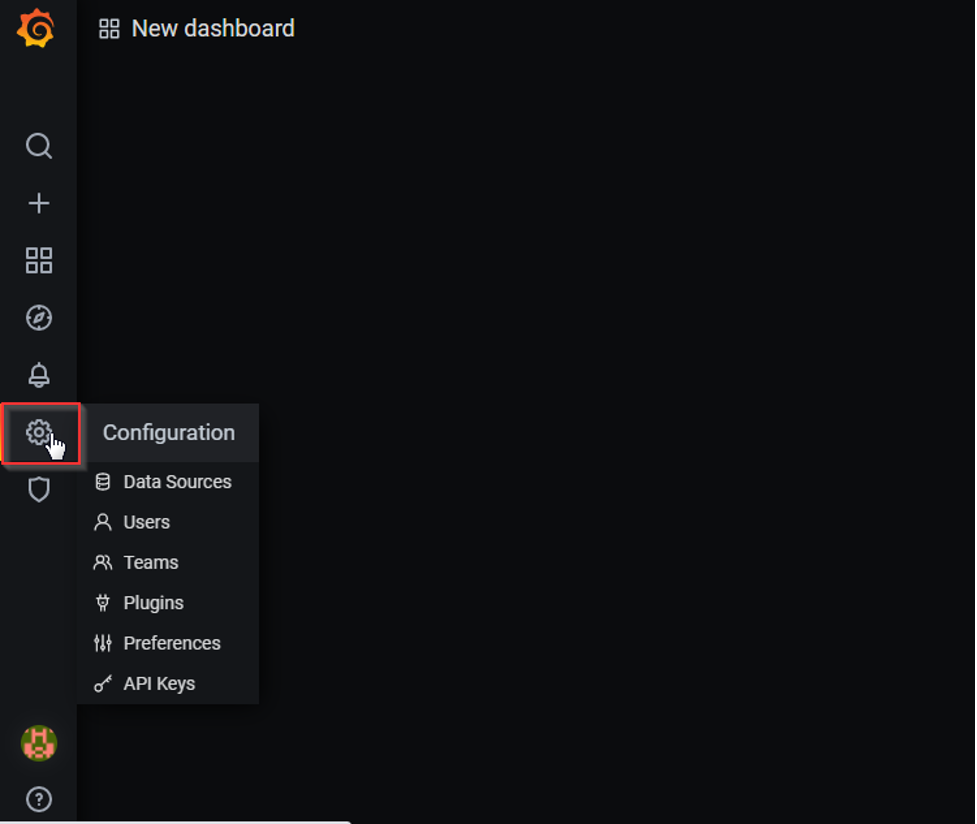
2. Select “Data Sources” from the list.
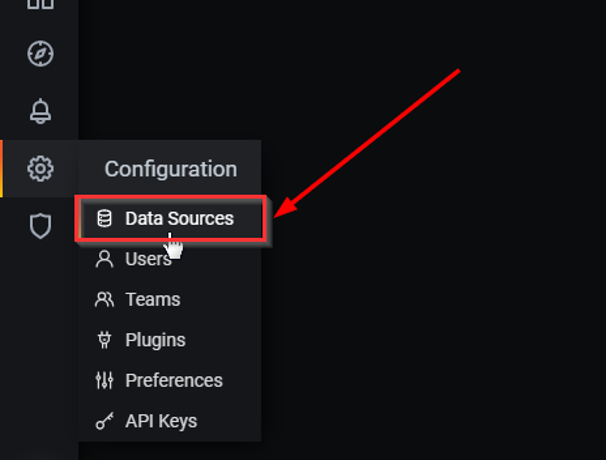
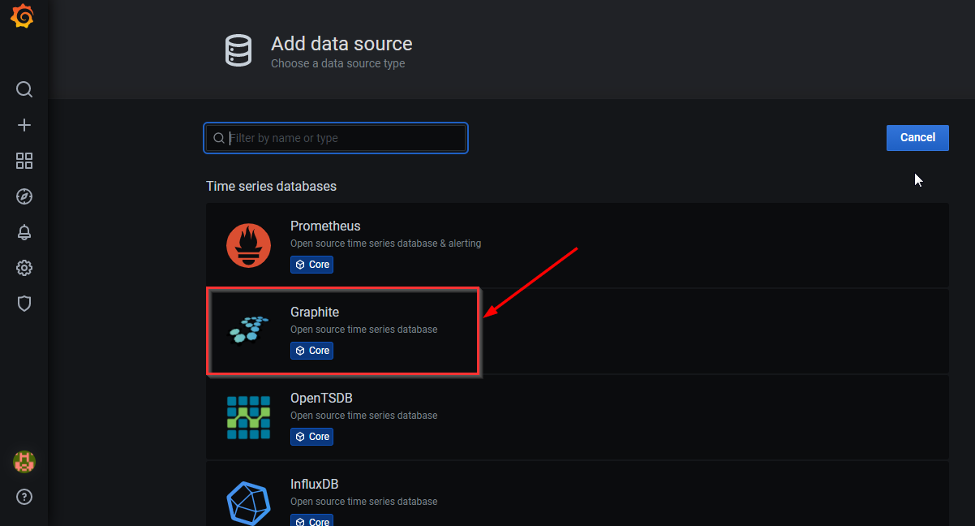
3. A new page opens. Click on “Add data Source”.
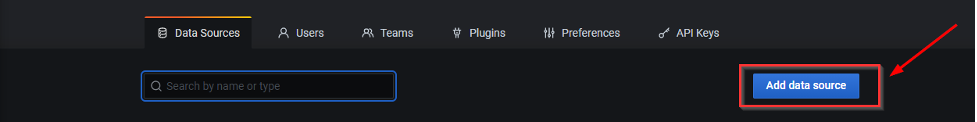
4. Select “Graphite” from the list of time series databases.
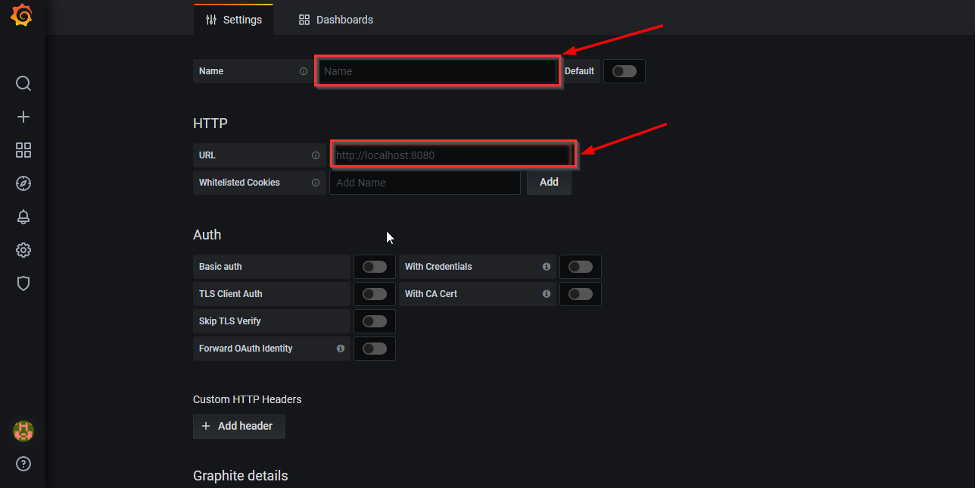
5. Enter a name for the Graphite DB. Enter the URL for your Graphite host. Users may or may not choose to install Graphite and Grafana on the same server. If installed on the same server with default configs, users can simply use http://localhost:8080.
Else enter the correct hostname or IP address of the Graphite server along with the right port (8080 is the default port).
Note: If Graphite is installed on a different server, please ensure that both your servers can communicate with each other.
6. Click on “Save & Test”. If the server hosting Grafana can reach your graphite server and establish communication through the right port, you will see the message “Data Source is working” and “Datasource updated” in green popups. Our setup is completed here.
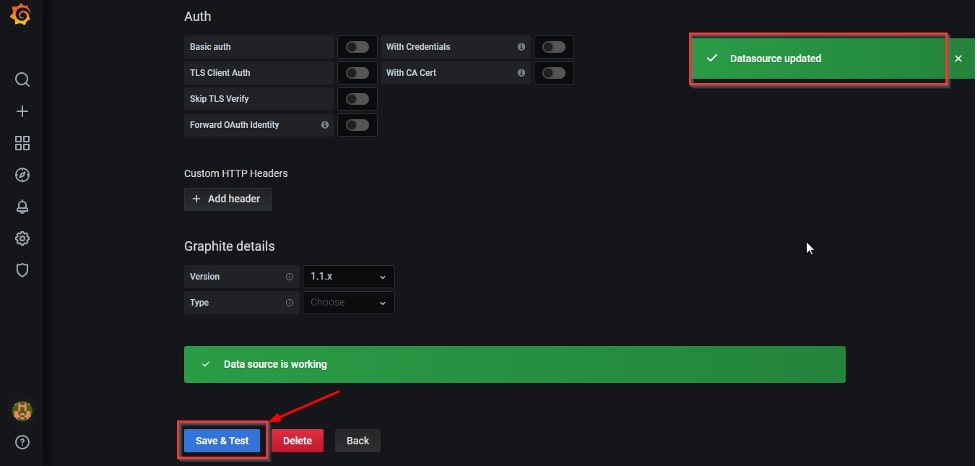
The next step is to use the Graphite database to fetch and render data in graphs.
Forming Graphite queries and rendering graphs in Grafana
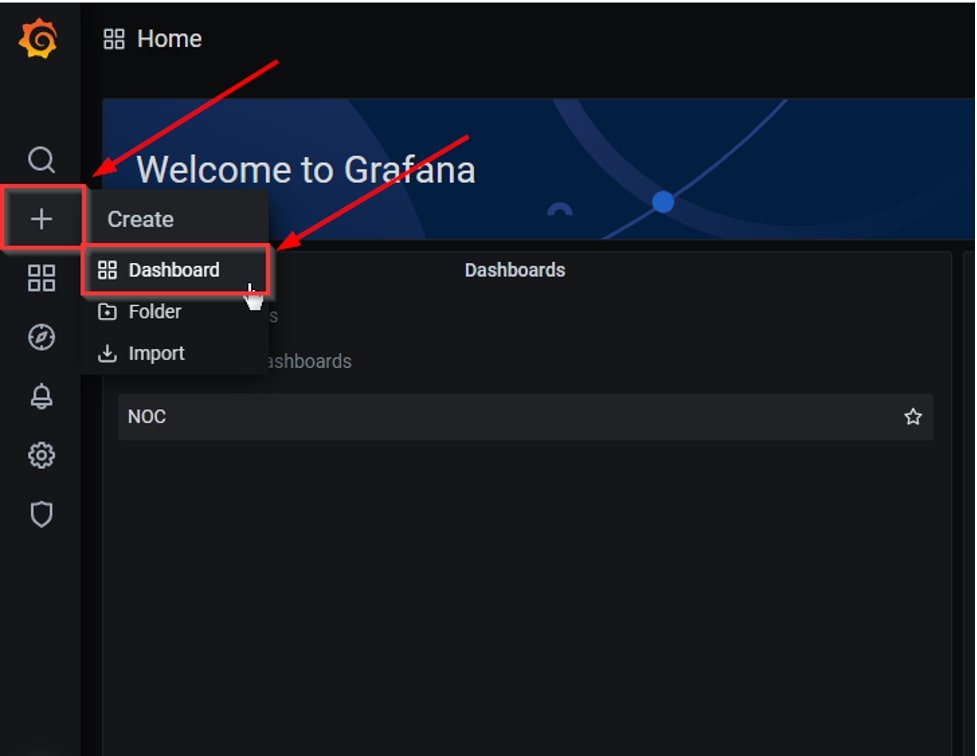
1. Click on the + icon to create a new dashboard.
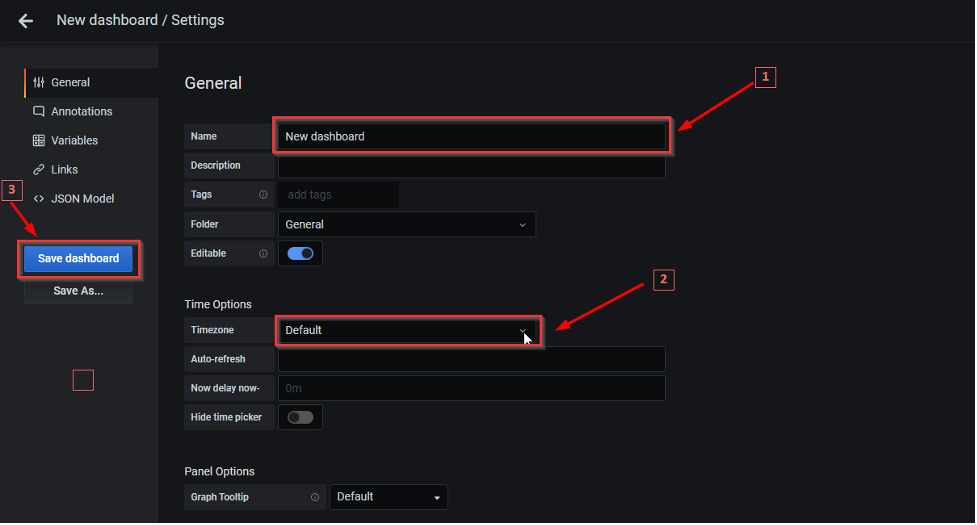
2. On the new dashboard, click on the * Gear icon on the top and enter a name for your dashboard, select a timezone or keep it default (optional) and save the dashboard.
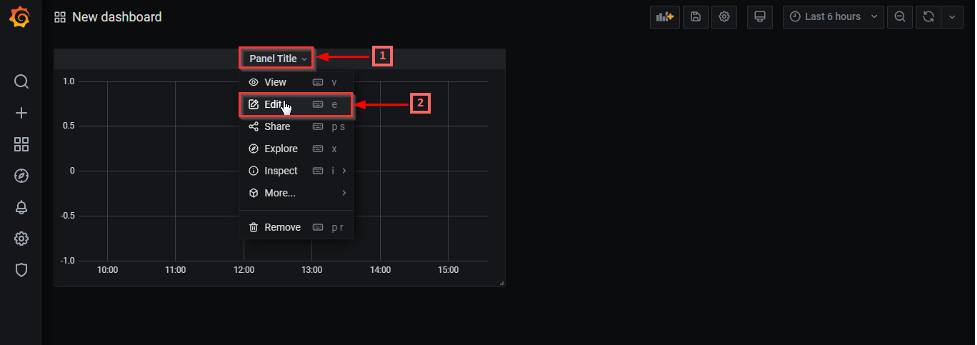
3. Now, let’s create our graph. Click on “Panel Title” and select the “Edit” option.
4. Enter a name for your dashboard panel (1 in pic below). Click on “Select Metric” and add your Graphite query by selecting the right metric hierarchy (2 in pic below). This hierarchy should be equal to the dot-separated hierarchical definition of each metric used during data storage in Graphite.
Grafana auto-populates sub-folder names depending on your current selection and lets you select one or more metrics from it. At any point of time, users can enter a wildcard entry to select more than one KPI or subfolder. If you are not sure about the correct metric tree, open your Graphite UI to confirm the right path.
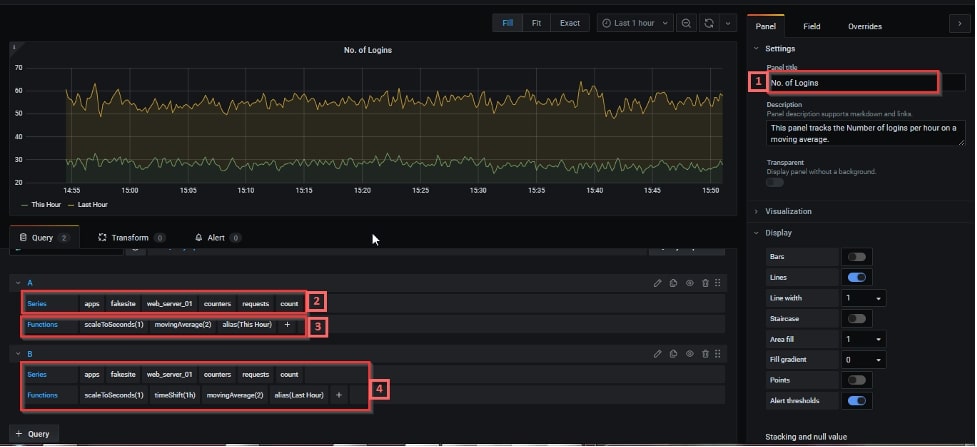
Once the query populates a graph, there can be scenarios where users may want to apply aggregation functions to their data. These functions are specific to the backend database system (i.e. Graphite here). The entire list of functions supported by Graphite can be found here.
For our example, we have used some simple functions like scaleToSeconds, movingAverage and alias (3 in the pic above). We also created a similar query to help compare the patterns with the previous hour using a timeShift function (4 in the pic above).
Select “Save” to save any new changes.
With these basic settings, our Grafana is ready to display any metric coming out of our Graphite instances. To get the best experience contact our technical support for further queries or you can also talk to an expert.
Conclusion
Integrating your Graphite server with your Grafana host is a one-time configuration and is easily achieved with a few clicks. The advantages of using Grafana with Graphite are numerous and their easy coupling serves as the basis of monitoring and visualization. Thus, by following these simple sure-shot steps enumerated above, one can easily master reading Graphite metrics.
Interested in exploring Grafana dashboards? Read our article here and gain further insight into creating basic to advanced Grafana dashboards. Furthermore, if you are also interested in learning about Graphite monitoring, here is a good read as well.
MetricFire’s cloud-hosted solution will help you visualise your data without any setup hassles. Go ahead and avail your free trial to get started, or contact us for a quick and easy demo and learn from one of our MetricFire engineers!


