
Table of Contents
Great systems are not just built. They are monitored.
MetricFire runs Graphite and Grafana as a fully managed service for growing engineering teams, taking care of storage, scaling, and version updates so your team doesn't have to. Plans start at $19/month, billed per metric namespace rather than per host, and include engineer-staffed support. Integrations work natively with Heroku, AWS, Azure, and GCP, and data is stored with 3× redundancy in SOC2- and ISO:27001-certified data centres.
Both Graphite and InfluxDB are time-series monitoring data platforms, both of which have high levels of adoption throughout many industries. Both of them are suitable for enterprise use, are scalable, and are stable. That being said, there are some benefits and drawbacks to each. While InfluxDB has many benefits, many developers still prefer Graphite due to its large community, stability, and reliability (You can get a free Graphite demo with MetricFire!).
Key Takeaways
- Graphite and InfluxDB are both time-series monitoring data platforms widely adopted in various industries, suitable for enterprise use, scalable, and stable.
- InfluxDB offers benefits like fast metric processing, automation services with Golang daemons, robust observability features, and easy integration with other tools. It can be free to start but becomes costlier as resources scale.
- Graphite, when paired with Grafana, provides exceptional reporting and dashboards. It is stable and has low system overhead, making it highly scalable. Like InfluxDB, the cost depends on the hosted service used.
- Graphite is written in Python, while InfluxDB is written in Go, catering to different programming expertise levels. Graphite has a data schema, supports concurrency and durability, and has a strong community and documentation.
- Choosing between InfluxDB and Graphite depends on specific needs. Graphite is favored for stability and simplicity, especially in large and complex systems or network monitoring scenarios. InfluxDB is advantageous for native integrations and more complex reporting needs.
What is InfluxDB monitoring?
InfluxDB monitoring is an open-source time-series database that can be used to store and retrieve time-series data across an infrastructure. Used to track IoT devices, application metrics, and operations monitoring, InfluxDB provides additional transparency to system states. It's free to start with InfluxDB, and it's hosted on cloud services, so none of the data can easily be lost. It's used throughout many enterprise applications.
Cost
It's free to start using InfluxDB, though organizations will gain costs as they scale upward. Like many cloud solutions, the cost of InfluxDB will be directly relative to the number of resources used. As an open-source toolkit, the cost of InfluxDB largely relates to the cloud server resources, as well as the in-house engineering. Companies can also invest in managed InfluxDB services, which can be easier for them to use, maintain, and implement.
Unique features
InfluxDB provides fast metric processing, along with Golang daemons for automation services. Tags, measurements, meta-data reporting, and metric reporting all enhance observability and monitoring and make it easier for organizations to pare down to the data that is most important to them. InfluxDB is fast and easy to set up, provides for fast development, and integrates with a large number of other tools through APIs and data pipelines, platforms like Integrate.io can help teams build ETL and ELT pipelines to connect InfluxDB data across your enterprise ecosystem. Features include a SQL-like query language, numerous supported programming languages, sharding, simple rights management systems, and more.
What is Graphite monitoring?
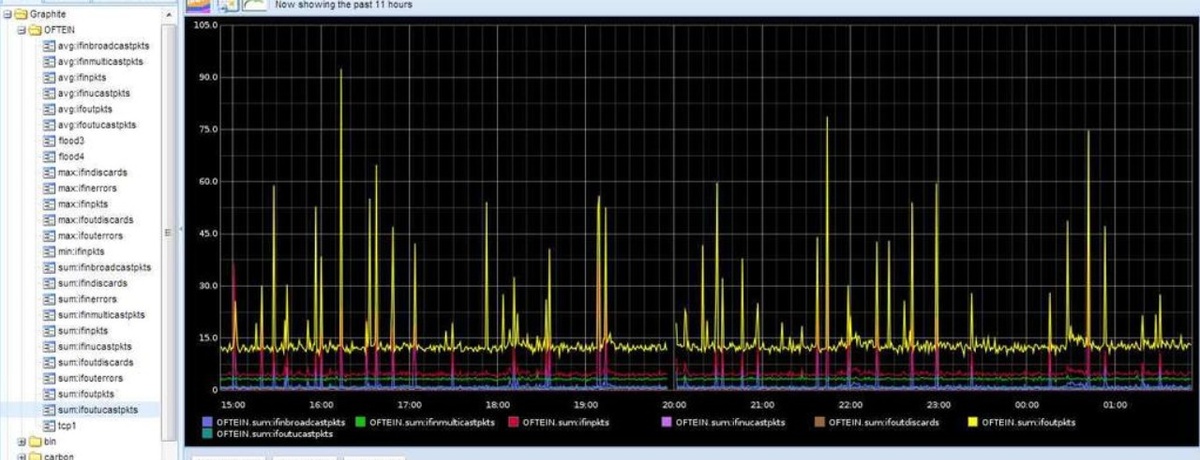
Graphite is another open-source monitoring solution that operates across the cloud, though there are some distinct differences from InfluxDB. Graphite can be more challenging to install and maybe a little harder to maintain. Paired with Grafana, Graphite has exceptional reporting and dashboards. Graphite monitoring is exceptionally stable once it has been set up, and there's very little overhead for the system which makes it more scalable.
To get rid of the hassle and cost of setting up and maintaining your own Graphite, you can use Hosted Graphite by MetricFire. Hosted Graphite gives you everything Grafana and Graphite can give you with none of the hassle! You should try the free trial here.
Cost
There are free trials available for Graphite monitoring. Like InfluxDB, the cost of Graphite monitoring is really the cost of the hosted service, as Graphite itself is open source. An organization should find a reliable hosting service to try out Graphite monitoring and can test both InfluxDB and Graphite to determine which is the best option for them.
Graphite monitoring will become more or less expensive depending on the resources needed, but it will be very comparable to InfluxDB. Hosted Graphite is a very cost-effective way to get your server and infrastructure monitoring hassle-free!
Unique features
Graphite is written in Python whereas InfluxDB is written in Go. This makes Graphite more readily usable for those who are experts in Python programming, though the Go language can be faster with less overhead. Unlike schema-free systems, Graphite has a data scheme in place, and it supports both concurrency and durability. It is a popular and well-known solution and has strong community backing, along with a significant amount of documentation.
For those interested in learning more about Graphite monitoring, a trial of Hosted Graphite is available at MetricFire.
Graphite vs InfluxDB
Choosing between InfluxDB and Graphite depends on your needs. Graphite is an excellent solution because it is extremely stable, simple, and scalable. Organizations that need a system with great levels of complexity may find that Graphite is superior for their uses. Graphite is great for enterprises that have large, sprawling systems. It’s also great for organizations that are doing network monitoring, where Graphite has unparalleled functionality with network monitoring.
Because both systems can be tested during a free trial, and because both systems are hosted, it's in an organization's best interest to test both.
One major advantage of InfluxDB is that it natively supports more integrations. For systems that need other reporting and monitoring tools, this can be a tremendous boon. But for those who would prefer to keep their systems less complex and less exposed, the answer is more likely to be Graphite.
However, Hosted Graphite by MetricFire works in partnership with Hosted Grafana. This platform gives immense flexibility in your ability to monitor more broadly. Hundreds of plugins are available, and they allow you to pull in more data.
Try Hosted Graphite to see if it’s right for you!
Conclusion
Many developers find themselves preferring one system or another, depending on their personal needs and the system that they are trying to develop. MetricFire provides Hosted Graphite trials for those who want to try out Graphite; developers can try Graphite and InfluxDB to determine what really works for them.
Both Graphite and InfluxDB provide greater levels of transparency for those who want to be able to track systems over their organization, and having this type of organizational data tool is incredibly important.
Graphite has existed since 2006, and InfluxDB has been in development since 2012. Both of them have shown significant strides in recent years and are continuously being improved upon and modified. As they grow more robust, many of the downsides for both of them will likely dissipate.