
Table of Contents
- Should You Do It Yourself or Do It With MetricFire?
- 3 Key Differences Between In-House Monitoring and MetricFire
- What Are Infrastructure and Application Back-End Monitoring?
- Overview of In-House Monitoring (Open-Source Graphite/Grafana)
- MetricFire: Overview of MetricFire’s Hosted Graphite/Grafana
- Advantages of MetricFire
- Disadvantages of MetricFire
- Final Thoughts on In-House vs. MetricFire: Which Is Right for You?
Great systems are not just built. They are monitored.
MetricFire runs Graphite and Grafana as a fully managed service for growing engineering teams, taking care of storage, scaling, and version updates so your team doesn't have to. Plans start at $19/month, billed per metric namespace rather than per host, and include engineer-staffed support. Integrations work natively with Heroku, AWS, Azure, and GCP, and data is stored with 3× redundancy in SOC2- and ISO:27001-certified data centres.
Should You Do It Yourself or Do It With MetricFire?
3 Key Differences Between In-House Monitoring and MetricFire
|
You’re ingesting 20,000 data points a second, in 400,000 metrics, from thousands of AWS instances – and your monitoring can’t handle the load. You need a scalable, highly-available monitoring and dashboarding solution (and you need it yesterday).
Should you do it yourself with an in-house Graphite monitoring system? Or will you skip the headache and choose a hosted service like MetricFire? MetricFire is a fully-managed, monitoring-as-a-service that shows off your metrics via beautiful dashboards without months of expensive development.
This guide explores the advantages and disadvantages of in-house infrastructure monitoring versus hosted infrastructure monitoring with MetricFire. By the end of the article, you should understand the critical challenges surrounding infrastructure monitoring, and how the in-house/open-source approach to monitoring compares to a hosted/open-source solution like MetricFire.
If you have any questions, contact the MetricFire team, and we'll be happy to jump on a call!
What Are Infrastructure and Application Back-End Monitoring?
Some application monitoring tools focus on tracking “front-end” performance. This means that they measure app performance, availability, memory bloat, and other components more commonly dealt with on the front-end. Other monitoring tools focus on tracking back-end systems relating to the infrastructure that supports the running of the app. By making the metrics for back-end resources “observable” on dashboards, development teams can monitor the vital signs of applications, optimize performance, and troubleshoot problems.
Where does MetricFire fit into the monitoring equation? MetricFire does time-series metrics, and we do it well. MetricFire can be used for anything from synthetic monitoring to APM, but it really succeeds when monitoring the back-end performance – i.e., infrastructure monitoring, server monitoring, and system metrics. MetricFire excels when monitoring time-series metrics related to the servers, networks, systems, and other platforms or services that support the application.
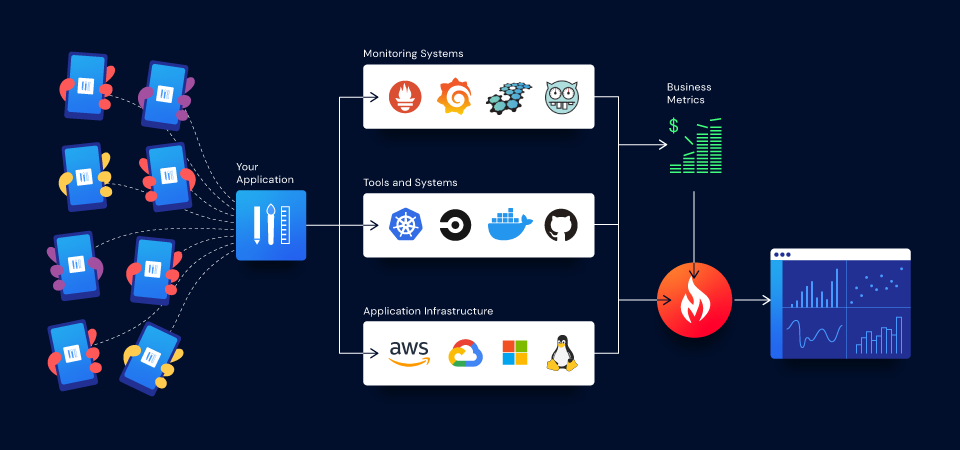
Common metrics for infrastructure monitoring generally include load balancing, proxy requests, API calls, application traffic, CPU, container metrics, etc. related to the following systems:
- Application infrastructure: This is the server, storage, network, and other resources that support your app. Your infrastructure will express metrics on its own, then you will need tools to consume and monitor that information.
- Tools and systems: These are the tools and systems an app is built on – such as Kubernetes, Docker, Zuul, Github, Circle CI, etc. They will either send the metrics themselves, or you’ll use a collector/custom script to collect them.
- Business metrics: Your application and your business are intrinsically connected. If your app is inefficient, you make less money. These metrics refer to the key performance indicators that the application sees – i.e., KPI metrics that indicate efficient and profitable app operation. Do you know which feature of your app makes the most money?
- The monitoring system itself: Monitoring systems are essential components, so they need to express and collect metrics to monitor themselves. (In the case of an in-house non-Prometheus setup, this would require a collector or custom script that directly touches the monitoring system’s code).
You’ll need to decide between three overall strategies when it comes to systems and infrastructure monitoring. Then, tools with smaller use-cases will fill in the gaps surrounding this overarching strategy. These three strategies are:
- In-House open-source infrastructure monitoring tools (Graphite, Grafana, etc.):
Graphite is the most powerful, cutting-edge, and flexible time-series metrics monitoring system available. They are free and open-source, and they won’t leave you subject to vendor lock-in. The problem is, that scaling and long-term management of these platforms require constant troubleshooting by experienced in-house engineers. Which is burdensome/distracting for large teams, and possibly suffocating for small teams.
Storing time-series data for these systems comes at a high cost. Also, the open-source dashboards they work with (like Grafana or Kibana) are beautiful, but only after an extensive setup. These factors ultimately make open-source Graphite expensive, time-consuming, and labor-intensive to implement and maintain.
- Proprietary infrastructure monitoring products:
This option is easier than running open-source technology on your own. You can purchase a prebuilt application infrastructure “monitoring-as-a-service.” There are many proprietary products like this available, such as DataDog and SolarWinds. These platforms are fast to set up, and you don’t have to devote a team of engineers to keep them running – and they tend to display their metrics with beautiful, ready-made dashboards. The problem is, that these proprietary solutions are either narrow and can’t offer the same level of flexibility you can achieve with Graphite; and they are priced for large enterprises and are too expensive for everyone else (DataDog). Also, committing to one of these solutions means you’re subject to vendor lock-in.
- Hosted open-source infrastructure monitoring tools (MetricFire is hosted Graphite/Grafana):
MetricFire is unique among infrastructure monitoring products because it is built on top of open-source Graphite and Grafana (as a hosted open-source solution). MetricFire is Graphite and Grafana as a service. This makes MetricFire a best-of-both-worlds solution that bridges the gap between Graphite and a ready-made solution that won’t expose you to vendor lock-in. MetricFire improves the capabilities and flexibility of Graphite in an agile, pre-built, and ready-to-use package – with visually-stunning Grafana dashboards to boot!
Key takeaways: Great infrastructure monitoring is essential to system performance and optimization. You have three main options for this kind of monitoring:
- set up an open-source platform in-house which is expensive, time-consuming, and labor-intensive; or
- save time with a proprietary monitoring product like DataDog (advanced and extremely expensive); or
- achieve the best of both worlds while saving time, money, and personnel resources with a hosted open-source product like MetricFire.
Now let’s take a look at the advantages and disadvantages of both in-house monitoring and MetricFire in detail.
Overview of In-House Monitoring (Open-Source Graphite/Grafana)
Let’s look at the advantages and disadvantages of an in-house Graphite back-end monitoring system (Option 1 above).
Advantages of In-House Monitoring
Developing an in-house monitoring system offers the following advantages:
- No fees: The most popular open-source monitoring tools (Graphite and Grafana) are free to use. These powerful platforms have all the functionality you need and more with zero fees.
- Frequent technology updates: Graphite and Grafana are under constant development. Thousands of engineers – both volunteers and those funded by large enterprises – are constantly modernizing these projects. The most recent Graphite releases were in March 2020 (Version 1.1.7) and October 2019 (Version 1.1.6).
- Customize the solution to your specifications: Developers can customize Graphite and Grafana to meet their precise requirements.
- Avoid vendor lock-in: Since you’re in full control of your in-house monitoring solution, there’s no vendor lock-in. You can shut down the monitoring system and move your data elsewhere at any time.
These advantages are why many large enterprises build in-house monitoring solutions with Graphite and Grafana. It’s also why small and large organizations alike are turning to MetricFire – because MetricFire offers the above advantages “as-a-service” in an easy-to-use, highly-affordable package.
Disadvantages of In-House Monitoring
The disadvantages of in-house monitoring and dashboarding are especially relevant for businesses with limited budgets:
- High auxiliary costs: While open-source tools are free, setting them up and maintaining them is not. For example, a Graphite/Grafana or Prometheus/Grafana system requires one or more full-time engineers (with salaries of $100k+ each) to set up and continually maintain. There will also be auxiliary costs related to storage, configuration, and more.
- Scaling challenges: Scaling challenges are common as your monitoring requirements grow.
- Data storage limitations: Prometheus doesn’t include an efficient long-term storage option so long-term storage isn’t a default configuration. In order to make decisions based on long-term data, you’ll need to configure long-term storage manually (which fills up your storage fast), so you’ll typically need to add a third-party storage solution like Integrate.io for data integration and pipeline management.
- No support: Your IT team is the only support when things break down. It will take longer to troubleshoot and resolve bugs and performance problems – if you can resolve them at all.
- Setting up an in-house solution takes time: You will experience challenges and delays as you brainstorm and experiment with the technologies and strategies your dashboard/monitoring solution requires.
These disadvantages – particularly the auxiliary costs and IT staff commitments – are why most organizations go with a monitoring-as-a-service product for their infrastructure monitoring system.
In-House Infrastructure Monitoring: Tools and Moving Parts
Just like a structural inspection for a wooden farmhouse differs from the inspection for a 40-story building, the nature of your in-house monitoring system will differ based on the application it tracks – and there will be a wide range of essential components to individually select, integrate, and configure.
At its core, your in-house infrastructure monitoring consists of (1) the app infrastructure that you’re monitoring; (2) Prometheus or Graphite to poll and store time-series data from all of the systems you’re using; and (3) a dashboarding tool that displays metrics after querying the necessary data (from Prometheus or Graphite).
You’ll need to select your dashboarding tool and other components that complete the system:
- Will you use Grafana or Kibana for dashboarding?
- Will you use Pagerduty or VictorOps for incident management?
- Does your client library have a built-in metrics collector?
- Where do you store your time-series metrics?
These are just a few of the many decisions you’ll make while building your in-house infrastructure monitoring. Here’s how the finished product might look with Prometheus:

(Image source: https://prometheus.io/docs/introduction/overview/)
Some of the monitoring tools/components in this diagram include:
- Alertmanager: This lets you define different alerts – like “CPU Usage High” or “Request Duration Increase” – depending on the metrics Prometheus is sampling.
- PromQL: This is the querying language used to query the metrics in Prometheus.
- Pushgateway: This allows services to push metrics into Prometheus.
- Service discovery: Prometheus automatically discovers the services that are running and tries to predict what it needs to monitor. This helps Prometheus run in dynamic Kubernetes environments without as much configuration.
Finally, your application is going to be unique in its language, architecture, and client library – but Prometheus comes with a host of client libraries and excellent documentation, so you should find what you need. For example, if you used Spring Boot (which uses Kotlin) to instrument the app, Prometheus can accommodate.
Final Thoughts on In-House Monitoring
Open-source Graphite and Grafana offer power and flexibility. However, setting them up and maintaining them requires a dedicated team of developers. This team will need to make the right setup decisions, select the best tools, and continually tinker with the system.
As the co-founder of MetricFire Dave Concannon puts it:
“Would you rather have your developers writing code for you, or would you rather have them fixing a thing that lets you know when something else has gone wrong?”
At the end of the day, in-house monitoring takes up valuable engineering time that’s better spent fixing and improving the app infrastructure you’re monitoring (instead of fixing and improving the monitoring system itself).
MetricFire: Overview of MetricFire’s Hosted Graphite/Grafana
MetricFire bridges the gap between in-house monitoring with an open-source tool (Graphite), and monitoring with a proprietary product. Since MetricFire is built on top of Graphite and Grafana, it achieves the best of both worlds by offering the flexibility of the open-source tools as a pre-built and ready-to-use service.
The most popular features/characteristics of MetricFire include:
Highly-scalable cloud monitoring and on-premise options: MetricFire is a cloud-ready solution that scales to any size. You can also install and run MetricFire on-premise.
MetricFire: MetricFire improves on open-source Graphite with add-ons and improvements like:
- Easier time-series data collection through a combination of Carbon and MetricFire’s proprietary Agent.
- Scalability and high availability by using a cluster-native storage system instead of Graphite’s Whisper data storage engine.
- Pre-built connectors and plugins for a wide variety of technology and services like AWS, Azure, and Heroku.
- Get alerts through online channels such as email, Slack, Pager Duty, and Pingdom - with ready-to-go webhooks and APIs to make setting it up easy.
- MetricFire APIs allow you to modify the platform to automate tasks, control dashboard access, and collaborate with team members, and more.
Easy-to-Use Grafana dashboard editor: All MetricFire packages include hosted Grafana dashboards. MetricFire speeds up the Grafana setup process with the following features:
- Easy alerting through ready-to-go plugins for your favorite notification systems.
- Managed data storage.
- Our Solutions Engineers are experts in monitoring. They see thousands of different dashboard types & can help you build a custom solution.
Advantages of MetricFire
MetricFire offers the following advantages over in-house monitoring solutions:
- A complete ecosystem of end-to-end time-series monitoring: MetricFire wraps the most advanced open-source monitoring platforms (Graphite, and Grafana) along with pre-configured plugins (collectd, Kubernetes, StatsD, and more) into a single hosted environment.
- The right tools: With MetricFire, you don’t have to stress about which tools and components are right for your monitoring setup. MetricFire chooses the best available options, then packages them into a complete monitoring solution that’s ready from day one.
- Improvements over open-source monitoring platforms: MetricFire increases the functionality of open-source monitoring platforms by bundling multiple services and plugins into a single hosted environment, and adding new features such as Data Views to enhance them.
- Multiple monitoring use-cases: MetricFire offers infrastructure monitoring (network and server monitoring), app monitoring, and business intelligence.
- Avoids errors: Setting up an open-source monitoring solution is often an error-filled process while you tweak the solution to address your needs. With MetricFire, we have the monitoring expertise you need so you’re not reinventing the wheel.
- Frees up tech staff: MetricFire’s speedy setup and hosted monitoring frees up your tech staff to focus on more important activities – like developing, optimizing, and updating the systems and apps MetricFire is monitoring.
- Saves money: MetricFire has the lowest per-metric rate out of any service provider.
- Predictable monthly billing: With affordable and predictable monthly pricing options, MetricFire makes it easy to plan your budget. Plans start at $85/month for small businesses and go up to $3,849/month for large enterprises.
- No vendor lock-in: With MetricFire, you own and control all of your data You’re free to cancel the service and export your data at any time. This prevents vendor lock-in, allowing you to enjoy the full benefits of an open-source tool with the stability, security, and high availability of hosted SaaS.
- Saves time: The average in-house monitoring system takes several weeks, to a month or more to set up. MetricFire just works from day one.
- Excellent customer support: All service level commitments receive unlimited, phone and video conference support from MetricFire’s awesome team of engineers.
Key takeaways: MetricFire offers the same advantages of an open-source, in-house monitoring solution in less time, for less money, and without needing a team of engineers to manage and troubleshoot the platform.
Disadvantages of MetricFire
MetricFire’s hosted Prometheus and hosted Graphite make the advanced capabilities of open-source solutions more accessible. At the same time, you should be aware of some potential disadvantages:
- Less control than open-source: Convenience and “ease of use” never come without giving up a little bit of control. You won’t be able to recode the monitoring system from scratch - but hopefully, you won’t need to. Although MetricFire doesn’t offer as much control as in-house Graphite, MetricFire offers a great deal more control than competitors like SolarWinds and Datadog.
- Graphite is not for everyone: Graphite is monitoring industry standards, but they’re not perfect for all circumstances. Although MetricFire has added plugins and enhancements to overcome challenges, check with the MetricFire team if you have any reservations about hosted Graphite.
MetricFire doesn’t just save you time and development costs during the setup process. It eliminates the need for a full-time engineering team to monitor your system.
Final Thoughts on In-House vs. MetricFire: Which Is Right for You?
As you’ve seen in this guide, developing an in-house monitoring system requires a large budget, a dedicated team of engineers, and continued maintenance, and there’s no expert support for when your team runs into issues. This means that open-source Graphite is not the most practical solution – especially for small- to medium-sized organizations that don’t have the resources to support this kind of solution.
In contrast, MetricFire offers a best-of-both-world, where you get all of the benefits and advantages of an in-house monitoring solution with the ease, convenience, and cost savings of a pre-built, proprietary monitoring product.
Want to try MetricFire for yourself? Contact the MetricFire team now!


