
Table of Contents
Great systems are not just built. They are monitored.
MetricFire runs Graphite and Grafana as a fully managed service for growing engineering teams, taking care of storage, scaling, and version updates so your team doesn't have to. Plans start at $19/month, billed per metric namespace rather than per host, and include engineer-staffed support. Integrations work natively with Heroku, AWS, Azure, and GCP, and data is stored with 3× redundancy in SOC2- and ISO:27001-certified data centres.

Introduction
Prometheus is very commonly deployed with another component called Alertmanager which provides numerous features such as the deduplication of alerts, silencing, grouping, inhibition, and routing (source). In fact, Prometheus and Alertmanager are almost inseparable because Prometheus has strong support for it - there is a top-level key called alerting in the configuration of Prometheus. This key is solely for specifying the Alertmanager nodes, as well as the mangling rules of alerts before firing them.
However, this might not be as straightforward as it seems at first glance. Experience shows that some issues come up again and again. This article will shed light on them and show you how to avoid and solve these common problems.
Key Takeaways
- Prometheus is often used alongside Alertmanager, which offers deduplication of alerts, silencing, grouping, inhibition, and routing.
- Labels are used to identify alerts and can be overridden in the alerting rule's definition, while annotations add information to alerts and require manual creation.
- Flapping alerts occur when alerts frequently fire and resolve, leading to excessive notifications
- Alerts can fail silently if the metric specified in the alert expression doesn't exist.
- Prometheus creates new metrics for alerts, potentially leading to a "cardinality explosion."
Annotations vs. Labels
One of the first things that you will run into while defining alerts are these two things called annotations and labels. Here is what a simple alerting rule looks like:
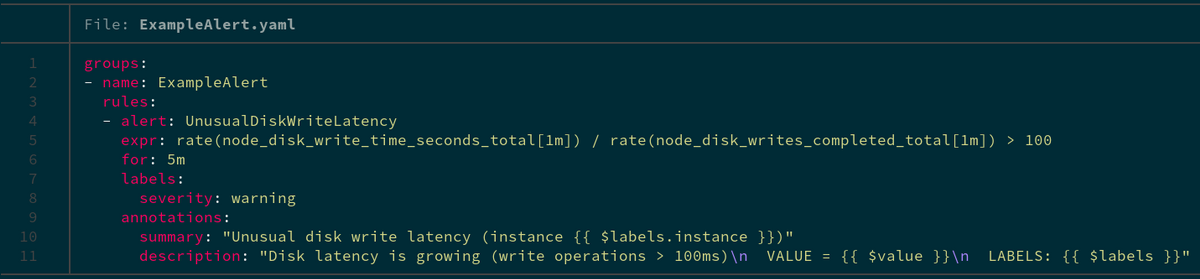
As you can see, annotations and labels are seemingly used for the same thing: adding extra data to the alert above what is already there.
- Labels are something that identifies the alert, and they automatically get written based on the alert’s expression by default. But, they can be overridden by the alerting rule’s definition, in the labels section.
- Annotations also add information about the alert but they do not get automatically pre-filled by using the alerting rule’s data. Instead, you are supposed to create your own annotations which enrich the data that comes from the labels.
Also, you can use the available templating system. For instance, in this example, you can see things such as {{ $value }} which gets substituted with the value of the alert’s expression. This is not possible with labels that are ordinary string values. You can find more information about the different possibilities for the templating engine by looking into Go’s documentation or here in Prometheus’ documentation.
There is one more crucial difference: labels are used to group related alerts together. The key group_by in a route’s configuration is used to set what labels are used to lump alerts together into one, which means that the end receiver that you had configured in Alertmanager will receive them in one batch.
The variable CommonLabels in your notification template will contain all of the labels that you have specified. But, each separate alert in the Alerts variable might contain extra labels beyond what's contained in CommonLabels. The separate alerts in the Alerts variable might also contain extra labels beside the ones that you have specified in group_by.
Therefore please pay attention to this small difference when making alerting rules because it is easy to make a mistake here, especially if you are new to Prometheus.
Avoid Flapping Alerts
After writing some alerting rules, have you ever noticed that they are continuously firing and becoming resolved time and time again? This may be happening because your alerting rule fires the alert to your configured receivers too quickly, without waiting to see if it gets solved naturally. How do we solve this?
The issue might come from:
- The non-existence (or it being too small) of the "for" clause in your alerting rule and/or
- Aggregation operations in your alerting rule
First of all, in your alerting rules, you ought to almost always have some kind of time component in them that indicates how long the alert should wait before sending the notification. This is important because failures are inevitable due to the network connection being imperfect so we might sometimes fail to scrape a target. We want to make sure the alert has been active for a designated amount of time before we send the notification, that way, if the alert gets resolved within 1 - 2 minutes, we aren't notified at all. Also, any service level indicators, objectives, or agreements that you might have for your services are typically defined in terms of an error budget that you can "spend" over some time or the percentage that your service was available over the last, let's say, one month. In turn, monitoring systems such as Prometheus are designed to alert on trends - when something goes really haywire - but not on exact facts. Here is a useful generator for SLOs that generates these things automatically for you according to Google's book.
When trying to solve this issue using the Aggregation Operations option listed above, we see that this is the harder way to solve the problem because it involves the expression itself, so it might be harder to change. Please feel free to use any of the aggregation functions described on this page, and then increase the time ranges used in your range vectors gradually as described here. However, this is not always applicable because you might want to alert if a specific metric becomes 1, for example. That's where the former method comes into play.
As you have seen before, the definition of an alerting rule contains a field called "for":
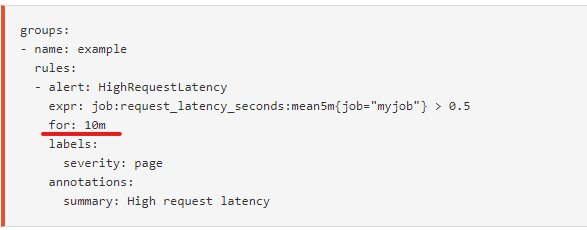
In this picture, the "for" value is equal to 10m or, in other words, 10 minutes. It means that Prometheus will check that the alert has been active for 10 minutes before firing the alert to your configured receivers. Also, note that by default alerting rules are evaluated every 1 minute and you can change that via the evaluation interval parameter in your Prometheus configuration.
It is important to recognize that it probably does not make much sense to make the "for" clause smaller than the evaluation_interval because your alerting rule will be evaluated two times either way. Even if you make the "for" clause smaller than the evaluation_interval, your "for" clause will be “equal” to evaluation_interval in practice.
So please always consider one of those two options (or both) so that you will not get unnecessarily spammed with notifications. Notifications should always be actionable.
Be careful with PromQL expressions
Now let’s talk about the dangers that lie in the PromQL expressions that you might use for alerting rules.
Missing metrics
First of all, you should keep in mind that the metric that you have written in the expr field might not exist at some point in time. In such a case, alerting rules silently start failing i.e. they do not become “firing”. To solve this problem, you should add extra alerts that would alert you on missing metrics with the absent function. Some even coalesce this with the original alert by using the "or" binary operator:
checker_upload_last_succeeded{instance=”foo.bar”} != 1 or absent(checker_upload_last_succeeded{instance=”foo.bar”}) == 1
However, this is most useful in cases where you do not use any aggregation functions and only use a single metric since it quickly becomes unwieldy.
Cardinality explosions
Prometheus creates new metrics called ALERTS and ALERTS_FOR_STATE for every alert defined in your system. They contain all of the labels that were generated from the alert’s expression and the extra labels that you have defined as discussed previously. The purpose of ALERTS and ALERTS_FOR_STATE is to allow you to see what kind of alerts were firing historically. But, there is one small problem - if your original expression does not contain any specific label selectors, Prometheus could potentially create thousands of new time series for each of the matched series. Each of the series has a set of labels that was generated by joining the labels of the original expression and the extra labels that you have defined in your alerting rule. The labels defined in the alerting rule are static, however, the labels on the metric are not - this is where the cardinality problem comes from. This could potentially significantly slow down your Prometheus instance because each new time series is equal to a new entry in the index which leads to increased look-up times when you are querying something. This is one of the ways to get what is called a “cardinality explosion” in your Prometheus instance. You should always, always validate that your alerting expression will not touch too many different time series.
For example, it is not unimaginable that you will be scraping something like kube-state-metrics which could have thousands of metrics. Let’s say you have numerous pods running in your Kubernetes cluster and then you might have lots of metrics like kube_pod_created. The metric's value shows when the pod has been created. Perhaps, you will have an alerting rule like kube_pod_created > 1575763200 to know if any pods have been created after 12/08/2019 @ 12:00 am (UTC) which could be the start of your Kubernetes cluster's maintenance window. Alas, your users would continue creating thousands of new pods each day. In this case, ALERTS and ALERTS_FOR_STATE would match all of the pods’ information (the pod's name and its namespace, to be more exact) that you have in your Kubernetes cluster thus leading to a multiplication of the original time series.
This is a fictitious example but nevertheless, it shows you the danger lies in this aspect of PromQL expressions. In conclusion, you should be conscious of the decisions that you are making in terms of the label selectors in your alert expressions.
Huge Queries
Last but not least, let’s talk about how alerting rules might start utilizing all of the resources of your Prometheus instance. You might unwittingly write an alert that would load hundreds of thousands of samples into memory. This is where --query.max-samples jumps in. By default, it forbids you from loading more than 50 million samples into memory with one query. You should adjust it accordingly. If it hits that limit then you will see errors such as this in your Prometheus logs: "Query processing will load too many samples into memory in query execution". This is a very helpful notification!
But, typically your queries will go through and you will not notice anything wrong until one day your Prometheus instance might start responding slower. Fortunately, Prometheus has a lot of nice metrics itself that show what might be taking longer than usual. For instance, prometheus_rule_group_last_duration_seconds will show, by alerting the ruling group, how long it took to evaluate them the last time in seconds. You will most likely want to create or import a Grafana dashboard that will visualize this data for you, or you could actually write another alert that will notify you in case it starts taking more than a specified threshold. The alerting expression could look like this:
avg_over_time(prometheus_rule_group_last_duration_seconds{instance=”my.prometheus.metricfire.com”}[5m]) > 20
You will most likely want to add the calculation of the average here since the duration of the last evaluation will naturally have some level of jitter because a load of your Prometheus will inevitably differ over time.
Conclusion
PromQL and the Prometheus alerting engine provide lots of different capabilities to users but careful use of them is key to the long-term stability and performance of your Prometheus instance. You should keep in mind these tips while writing alerting rules and everything should be fine.
At MetricFire, we offer a Prometheus alternative with 24/7 support and alerting creation. We're happy to jump on a call any time to hear how MetricFire can help with your monitoring setup. Contact us at sales@metricfire.com, or sign up for a demo! You can also get a free trial and use Hosted Graphite within minutes.


