
Table of Contents
Great systems are not just built. They are monitored.
MetricFire runs Graphite and Grafana as a fully managed service for growing engineering teams, taking care of storage, scaling, and version updates so your team doesn't have to. Plans start at $19/month, billed per metric namespace rather than per host, and include engineer-staffed support. Integrations work natively with Heroku, AWS, Azure, and GCP, and data is stored with 3× redundancy in SOC2- and ISO:27001-certified data centres.
Introduction
The need to monitor the health of servers and networks is unanimous. You don't want to be a blind pilot who is headed for an inevitable disaster. Fortunately, there are many open source and commercial tools to help you do the monitoring.
As always, good and expensive are not as attractive as good and cheap. So, we've put together the most valuable cloud and windows monitoring tools to get you started. These tools will give you great value for your resources, and they will help monitor network equipment, identify network trends, present your monitored results graphically, back up routers, and switch configurations. Here are the top cloud and windows server monitoring tools in the market.
Cloud Server Monitoring Tools
A cloud server monitoring tool uses manual and automated tools to monitor the health of your servers and network. It integrates with the entire cloud management blueprint to allow the monitoring of cloud-based resources by the administrators. It helps you to identify and manage minor issues before they become major problems.
MetricFire
MetricFire gives a complete application and infrastructure monitoring platform built on a set of various open-source server monitoring tools. MetricFire provides a Graphite setup where you can view metrics in real-time on fully customized Grafana dashboards.
Check out MetricFire's Grafana Dashboards here:
MetricFire Pros:
· Hosted Graphite has all the capabilities that vanilla Graphite doesn't have.
· Beautiful Grafana dashboards to view your metrics.
· Long-term storage.
· Deeply technical support whenever needed.
· Alerts for events that need action (Via email, VictorOps, PagerDuty, Webhooks & more).
· Enables you to automate and modify everything using the inbuilt APIs.
· Enables you to collaborate and share with your team or control access.
You should sign up for the MetricFire free trial here, and start building hosted Grafana dashboards directly on the platform. Send metrics in minutes and monitor your whole infrastructure by installing only one agent. You can also book a demo and talk directly to MetricFire about how to best monitor your cloud servers.
New Relic
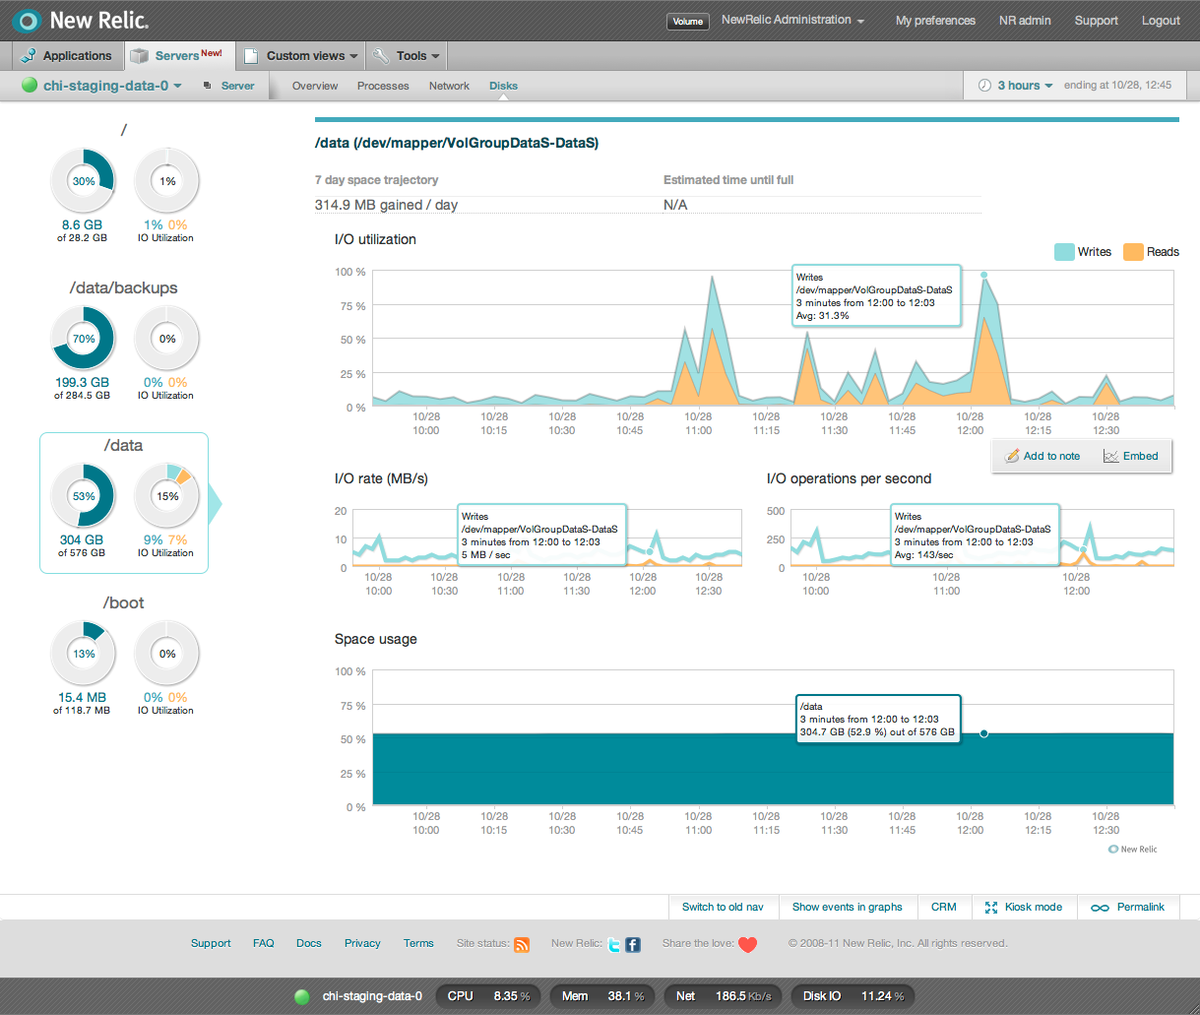
New Relic focuses on managing ever-changing, complex infrastructure and cloud applications. It enables you to know exactly how your cloud servers and cloud applications are operating in real-time. If you're managing APIs and data access patterns across your cloud infrastructure, platforms like DreamFactory can complement your monitoring strategy by providing governed API access to your data sources, allowing you to better track how applications interact with your backend systems.
New Relic Features:
· Enables you to set your own warnings when an error occurs.
· Enables you to create customized dashboards.
· It monitors database performance.
· All the monitoring is in one place. Enables you to view slow transactions, page loads, error rates, and all the running servers.
New Relic Pros:
· Flexible and quick to install.
· Has an excellent granularity of information.
· Can create metrics of its own alerts through the integration of various tools.
New Relic Cons:
· In the beginning, it is possible for metrics to be confusing.
· The mobile app doesn't support all features.
· Very costly.
AppDynamics
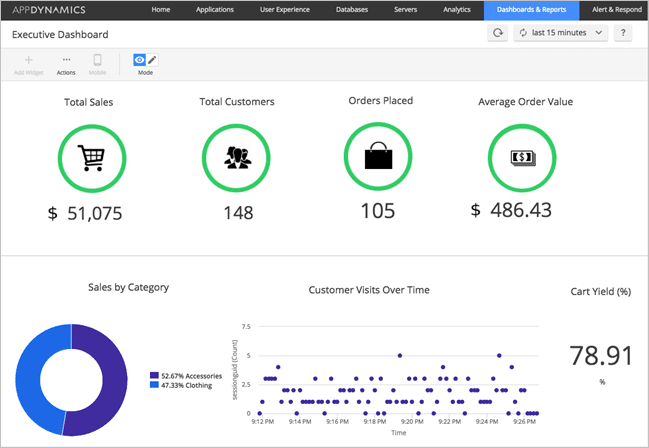
AppDyamics was acquired by Cisco Systems in 2017. The server monitoring tools provided by AppDynamics enable you to accelerate operation shift and access application performance. AppDynamics is designed to effortlessly adapt to whichever infrastructure or software environment you deploy it in.
AppDynamics Features:
· It can monitor business transactions.
· It supports NET and Node.js, java, and PHP.
· It can automatically map applications.
· It is an APM tool as well as a server monitoring tool.
AppDynamics Pros:
· Quickly discovers problems.
· Real-time corporate transaction monitoring.
· Inject complications faster than ever before.
AppDynamics Cons:
· You may need some training to completely understand the dashboards.
· The setup takes more time than competitors.
· It can only support a limited number of languages.
Windows Server Monitoring Tools
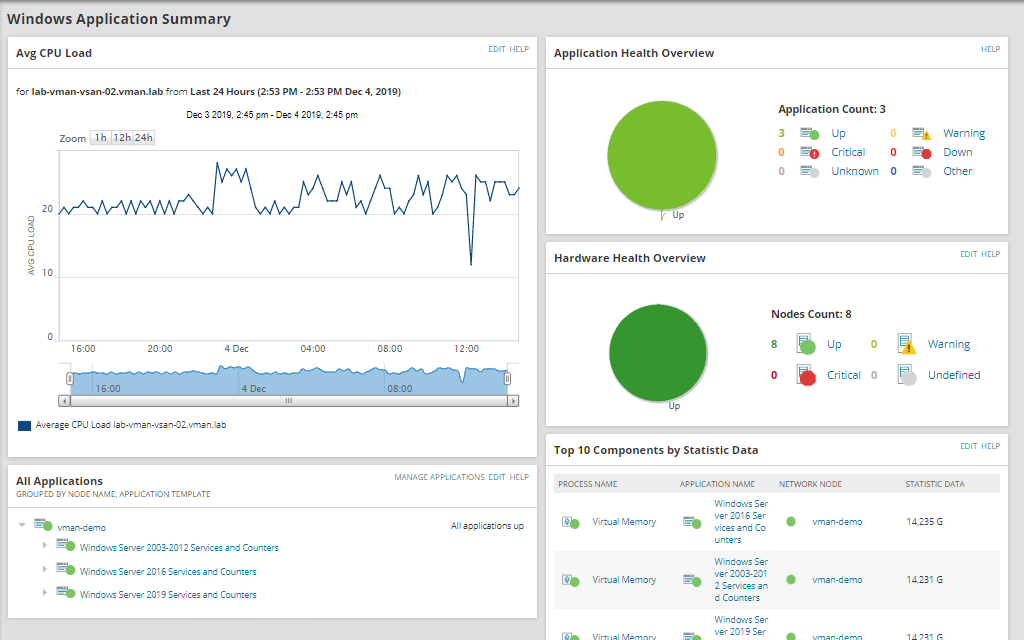
The servers within your business environment also need to be monitored actively using the best windows server monitoring tools. Assessing the performance of your servers like hard drive space, temperature, memory use, processor loads, fan operations, and more is vital for your business. Here are the best windows server monitoring tools in the market:
MetricFire
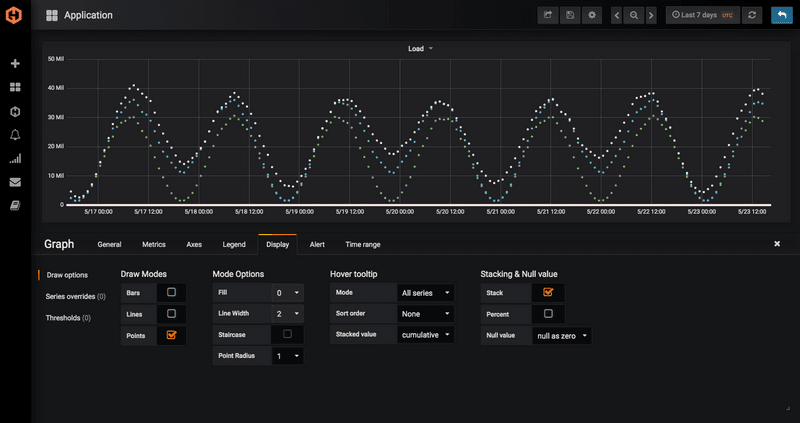
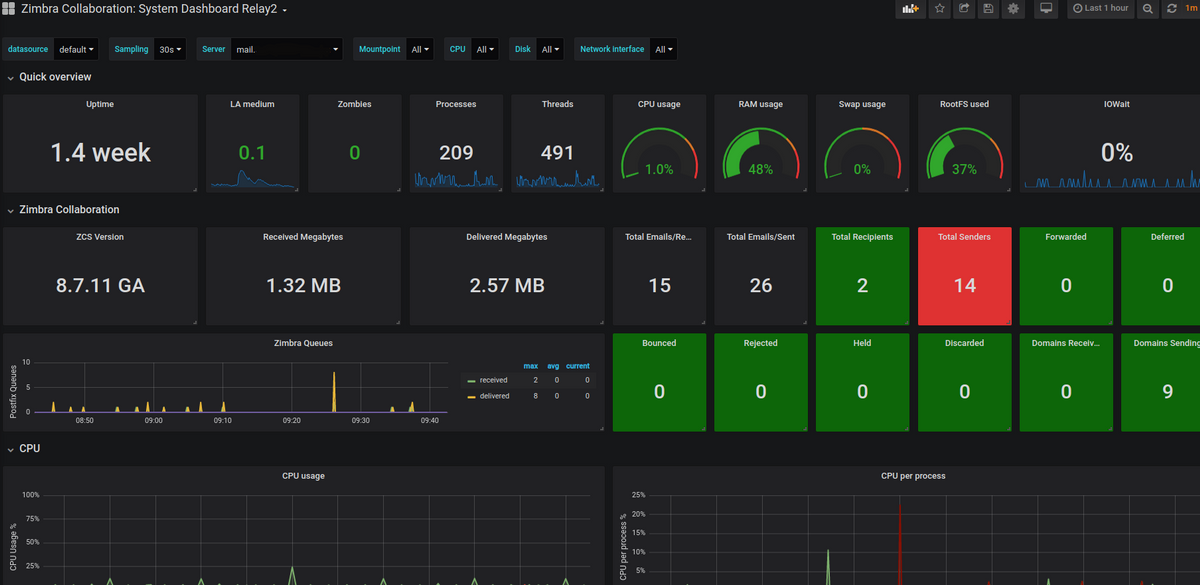
Not only is MetricFire a great cloud server monitoring tool, but MetricFire can also be set up on-premises and used to monitor local machines. Check out the dashboard below, which is monitoring a set of locally run servers.
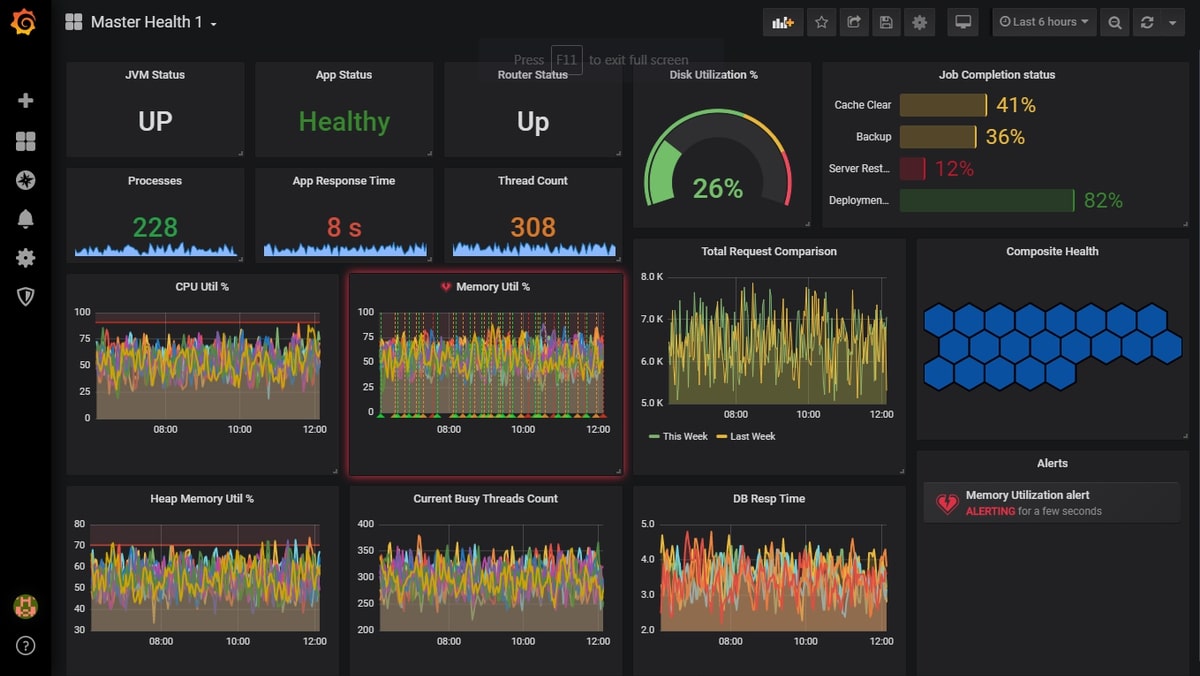
Check out the MetricFire blog for more information on how to monitor Windows servers. Also, sign up for the MetricFire free trial and start monitoring today. You can build the dashboard above by following our tutorial here.
PRTG
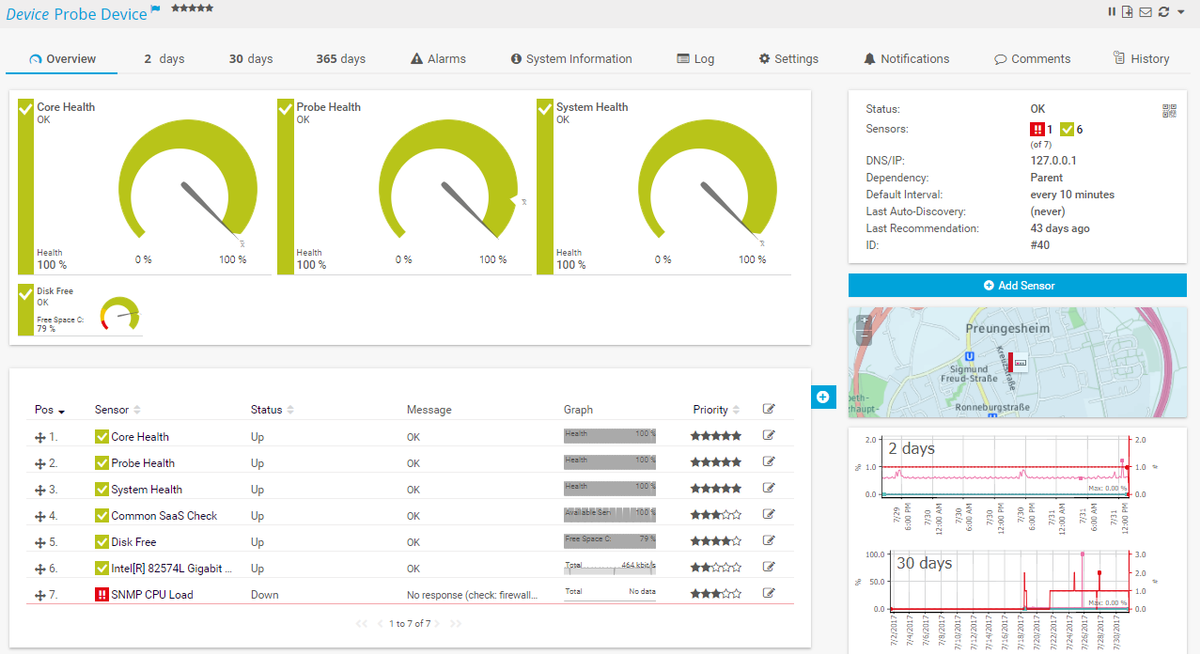
PRTG enables you to monitor memory use and traffic activity, and assess your remote systems—the event logs. The significance of assessing the event logs is that they alert you of any underlying issues so that you can fix them before they become major problems. PRTG provides a clear assessment of mail servers, web servers, virtual servers, database health, and more.
PRTG Features:
· Windows Security Management.
· Log Monitoring.
· Customizable.
· Overall Monitoring Solution.
· SNMP, WMI, and Performance Counters.
Zabbix
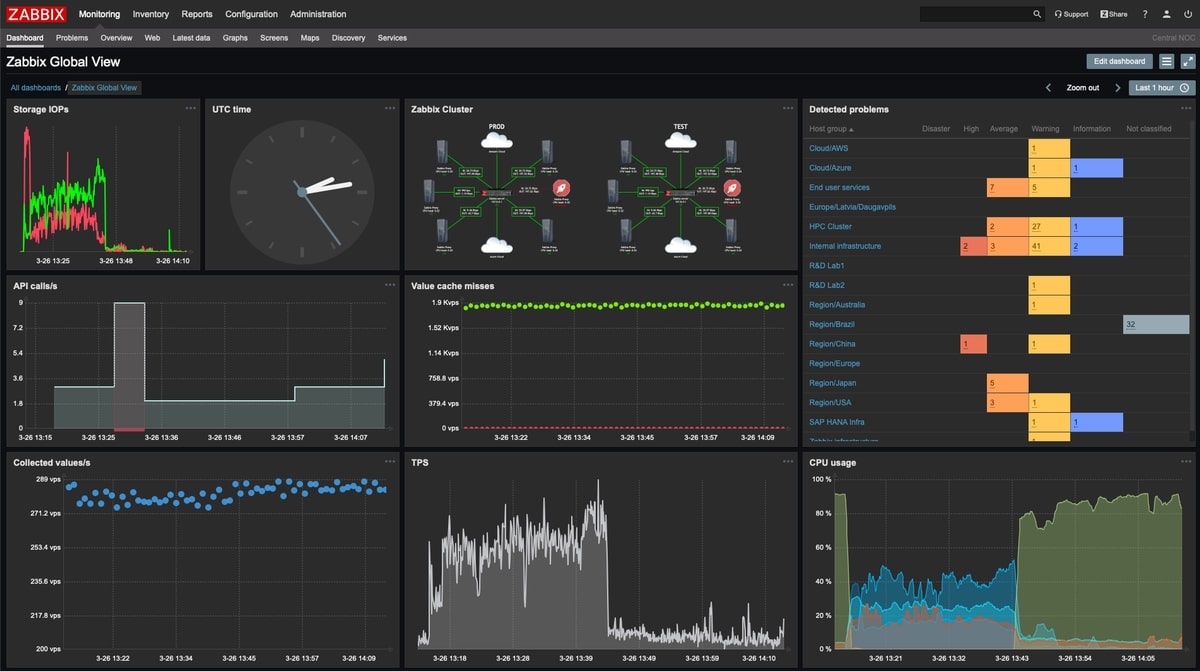
Zabbix is a server monitoring tool that gives you various tools to monitor your network and servers—web application stacks and monitoring virtualization. Zabbix can monitor web services, databases, and Java application servers.
Zabbix Features:
· Web App, Availability, Performance, Network, and Database monitoring.
· Capacity Planning.
Zabbix Pros:
· It allows you to customize the web interface and the dashboard.
· Displays CPU utilization graphs and network bandwidth usage.
· Supports custom maps.
· Supports slideshows and screens that display monitored data in real-time.
Zabbix Cons:
· It can be difficult to implement.
Conclusion
The time to face unknown major network and server problems is gone. The market is offering these incredible cloud and windows server monitoring tools to help you monitor the health of your network and servers.
MetricFire is a great fit for people who are looking to monitor using open-source tools but don't have the in-house resources to run a full monitoring production team on their own. MetricFire can monitor your metrics within a few clicks and just one installation of our agent.
Sign up for the MetricFire free trial and start monitoring now. You can also book a demo and talk to the MetricFire team about how our server monitoring tools can help you, and how we can support your team.