
Table of Contents
Great systems are not just built. They are monitored.
MetricFire runs Graphite and Grafana as a fully managed service for growing engineering teams, taking care of storage, scaling, and version updates so your team doesn't have to. Plans start at $19/month, billed per metric namespace rather than per host, and include engineer-staffed support. Integrations work natively with Heroku, AWS, Azure, and GCP, and data is stored with 3× redundancy in SOC2- and ISO:27001-certified data centres.

The easiest method of setting up a monitoring solution on MetricFire is using the Hosted Graphite Agent. It is a monitoring application written in Python and uses the diamond package to collect system metric data. The actual program you install is a systemd daemon, which can be enabled or disabled manually if needed.
Setting up MetricFire Agent
You will first need a MetricFire account, get started with a 14 day trial by signing up here. Once you have logged in, go to Agent on the left side, as seen in the image below. On the Agent page, click on “Add an Agent” to get the instructions on how to set up an Agent.
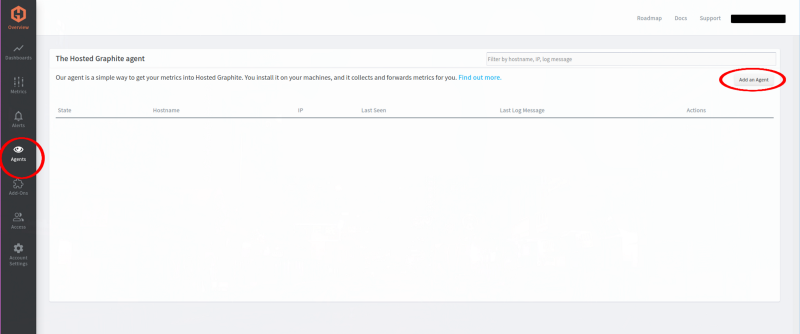
Add an Agent
The “Add an Agent” pop-up will give you a command to run in the terminal of the system you want to monitor. It will look like the image below.

For this article, I am using an Ubuntu machine. So, I will be using the Debian command like in the image above. Just copy, paste, and run the command as suggested. If you’re not sure what platform you are running, you can directly clone the GitHub repository for the agent here, and use the build.sh file to build the agent.
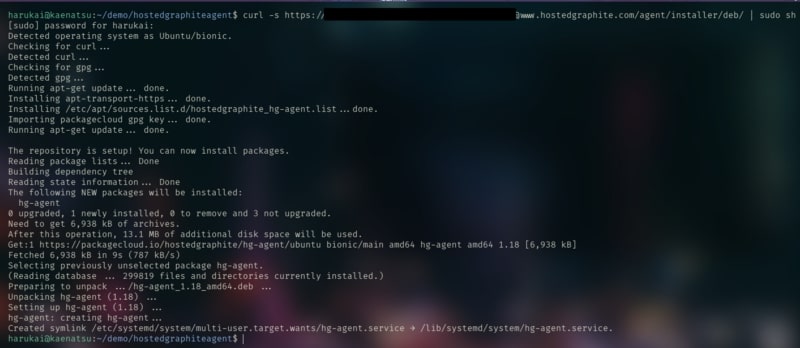
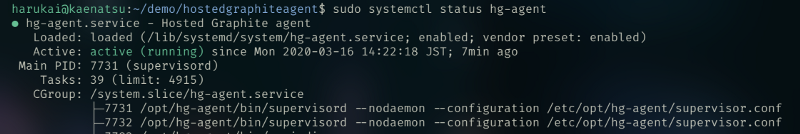
As you can see in the image above, it has been installed as a systemd daemon on my machine. After installing the Agent, it should automatically be running and sending metrics from our machine. You can check the status of it by running the command:
sudo systemctl status hg-agent
It should be shown as active like in the image below.
Check your Agent list
You can also check it out on your MetricFire Agent page, where we clicked on “Add an Agent” previously. It should now look like the image below.
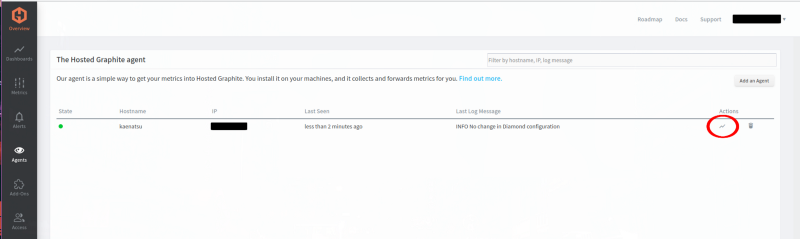
Referring to the image above, by clicking on Dashboard (where the red circle is), you can access a simple dashboard of the metrics coming from the Agent we just installed. It will look like the image below.
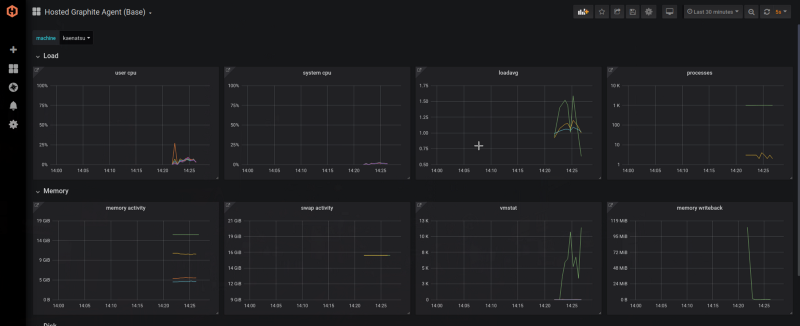
From here, you can customize your graphs further and create ones that are useful for your application. You can quickly get up and running with a simple dashboard for monitoring your system by using MetricFire’s Hosted Graphite Agent.
Conclusion
This blog post showed how to get metrics sent into the MetricFire platform using the Hosted Graphite Agent. Find out more information about how to monitor with Graphite by checking out our articles on Grafana Dashboards and the Graphite concepts and architecture.
To sign up for the free trial, click here to get started. Also, get the MetricFire team on a video call by booking a demo. We’re always happy to support our users to use the platform to its fullest.


