
Table of Contents
Great systems are not just built. They are monitored.
MetricFire runs Graphite and Grafana as a fully managed service for growing engineering teams, taking care of storage, scaling, and version updates so your team doesn't have to. Plans start at $19/month, billed per metric namespace rather than per host, and include engineer-staffed support. Integrations work natively with Heroku, AWS, Azure, and GCP, and data is stored with 3× redundancy in SOC2- and ISO:27001-certified data centres.
Introduction
Dashboards are great ways to visualize different KPIs in a single place. Metrics from all over your system can be framed together and viewed on a single screen, helping to correlate them and reducing the overall effort of analysis.
But when it comes to Grafana vs. SolarWinds, which one is better? It is often difficult to choose between their dashboarding capabilities. Both tools provide their own visualizations and help bring out interactive dashboards for users to use.
This article will provide a full picture of the pros and cons of each dashboard. We highlight the capabilities of both tools and compare their key differences in terms of dashboarding. Keep reading to learn more about their features so you can choose the option that best meets your needs.
Interested to see how MetricFire can help you with the process and help you get new organizational insight? Now's the time! Try a free trial or book a demo. You can try out Grafana directly in minutes and make dashboards monitoring your entire system for free.
Key Takeaways
- Dashboards are efficient for visualizing KPIs.
- Grafana: Open-source analytics with interactive, customizable dashboards. Supports 30+ data sources, plugins, and dynamic elements. Alerting and strong community support.
- SolarWinds: Suite for IT management with pre-built dashboards. Limited customization compared to Grafana.
- Grafana excels in data visualization and SolarWinds in IT management.
- Integrate SolarWinds data with MetricFire for enhanced monitoring.
- Consider your needs and flexibility when choosing between them.
What is Grafana?
Grafana is an open-source analytics and monitoring solution developed and supported by Grafana Labs. It lets you query, graph, and alert on your time-series metrics no matter where the data is stored. Grafana is backed by a vibrant community of developers and gets used by thousands of companies everyday to monitor anything and everything.
MetricFire runs a Hosted Grafana service that allows you to use Grafana without having to set up the open-source software. Sending metrics to Grafana is easy with MetricFire's custom-built agent.
Features of Grafana
- Grafana is made of a very lightweight backend and supports over 30+ open source and commercial data sources with minimal infrastructure.
- It can easily integrate with your workflow to help explore metrics, visualize real-time data, explore logs, evaluate data points and notify issues using different notification channels.
- It provides built-in support for prominent time-series databases like Graphite, influxDB, Prometheus, Elasticsearch, and many more.
- It comes with a huge collection of interactive plugins, starting from simple charts and graphs to heatmaps, geomaps, flow charts, and many more.
- Grafana allows querying and mixing different data sources into the same graph. Also, other features like the use of Ad-hoc filters and adding annotations make it a tough competitor in the market of data visualization and analytic tools.
With the help of Grafana's ever-growing community support, new plugins and dashboards are added every week with enhanced features and updates. For example, check out this dashboard for monitoring Kubernetes that you can download directly from the Grafana website.
Their official library consists of a wide variety of plugins like graphs, charts, dashboards, alert panels, etc. All these plugins come with many customization options, allowing users to display their data in different ways and convert them to fast and flexible dashboards.
MetricFire's Hosted Graphite service simplifies the process of creating effective dashboards. The platform makes it possible to get around some of the limitations of hosted Prometheus so you can monitor Kubernetes and other systems.
With our Hosted Graphite service, you get all the benefits of open-source Graphite with plenty of enhancements (a built-in agent, team accounts, granular dashboard permissions, integrations, etc.). You also get better redundancy storage, control by APIs, tagged metrics, backups, help from technical experts, on-call support, and much more.
Learn more about Hosted Graphite here.
Dashboarding in Grafana
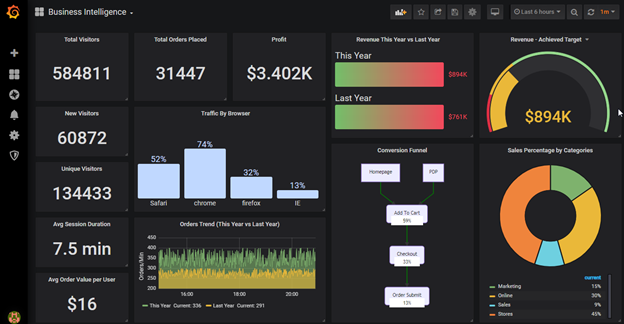
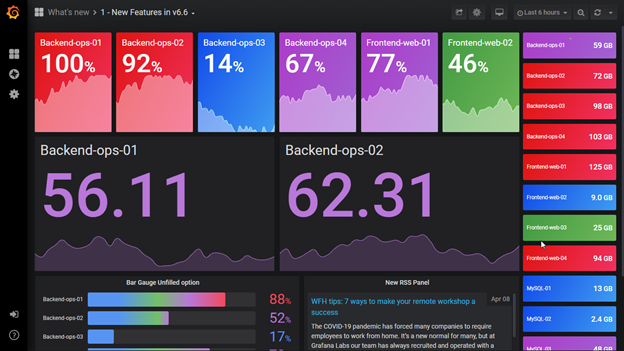
The power of Grafana lies in its state-of-the-art interactive dashboards. These dashboards and their easy-to-customize features are the reasons why most of the dev-ops community stick to Grafana as their primary monitoring tool. Grafana doesn't come with any pre-built dashboards. It must be customized from the start.
Each dashboard consists of one or more panels arranged and organized into rows. Each row may contain any number and type of panels ranging from simple charts to geo-maps or heatmaps, flow charts, etc. There are no restrictions on having multiple panels of the same type on a single row or on a dashboard. Each panel must be separately configured with an input query resulting in an accepted output format.
Grafana comes out of the box with a wide range of essential plugins, and users can choose to also install more from the official and community-built plugin page. Grafana allows you to define organizations within the tool, which acts like a role-based access. You can also separate dashboards between teams.
Grafana also lets you create dynamic dashboards with the help of template variables. These dashboards display tons of data using the same template which increases reusability. To know more about using templates in Grafana, check out Our Favorite Grafana Dashboards here.
Alerting is a great feature in Grafana to notify users of any threshold violations for their data points. Lots of Grafana panels allow setting visual thresholds, so it will notify users of value degradation by changing colors dynamically on the graph. These panels evaluate metrics continuously against pre-defined threshold ranges and modify colors accordingly. Some panels also send notifications over different channels like email, Slack, PagerDuty, VictorOps, etc.
Sign up for the MetricFire free trial here and try the dashboards out right now!
What is SolarWinds?
SolarWinds is a suite of software products designed for managing and monitoring networks, servers, applications, databases, and other Information Technology related systems.
Initially starting with web-based network performance, SolarWinds now consists of dozens of tools to manage different systems, hardware, security, compliances, etc. Each of these tools oversees different areas and is licensed individually.
SolarWinds is suited for companies of all sizes wanting to manage networks, infrastructure, incidents, compliance, etc., using a proprietary tool. SolarWinds Orion platform represents a unified IT monitoring solution and sits at the core of the SolarWinds IT Operations management portfolio. It provides features like data collection, processing, storage, alerting, and reporting. Due to its rapidly growing acquisitions, SolarWinds has become one of the fastest-growing companies today.
Features of SolarWinds
- Network Performance Management (NPM) tool provides multi-vendor network monitoring, wi-fi monitoring, critical path visualization, in-depth insights, and easy scaling for large environments. They provide visibility to your logical and physical networks.
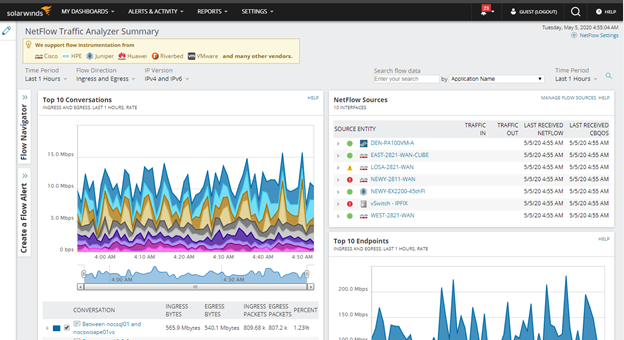
- The network analyzer pack provides enhanced features to the NPM by monitoring and visualizing bandwidth and traffic patterns - making it easier to detect and troubleshoot network performance issues.
- The Server and Application monitor provides numerous KPIs related to your applications, server health, and storage. These make it simple to plan and manage capacities across on-prem or cloud-based solutions.
- Database performance analyzers help manage databases supporting cross-platform tuning and performance optimization. They provide real-time and historical data over an intuitive GUI.
- Service Desk is a service management tool featuring ITSM processes by helping manage incidents and assets.
- Most of the tools come with Advanced alerts to easily notify users of any issues or threshold violations.
Take a look at this story of one company that was using SolarWinds, but was looking to move off of SolarWinds to a more flexible solution.
Try MetricFire now!
Interested to see how MetricFire can help you? Now's the time! Try a free trial or book a demo.
Dashboarding in SolarWinds
SolarWinds Dashboards provide great detail about the metrics and KPIs it collects. Although creating and editing dashboards in SolarWinds is not as flexible and easy-going as Grafana, it still offers a lot of information on a single pane.
SolarWinds provides pre-built dashboards that auto-populate data after the discovery of nodes and networks. These dashboards have pre-defined templates that users can customize by adding and removing panels or resources.
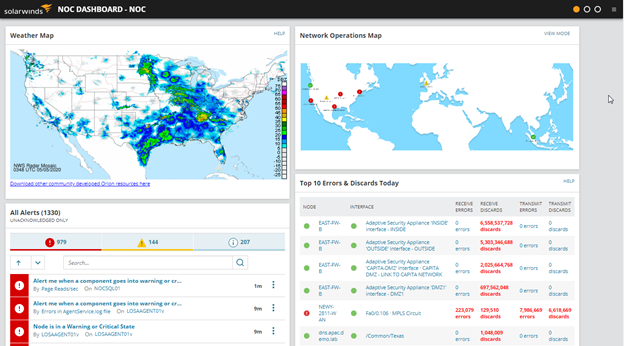
The summary page provides a quick real-time overview of all nodes, applications, alerts, and recent events on a single screen. It can be edited to include new custom tabs that can show additional information as per users' choice. Each tab can contain up to a maximum of 6 columns. Existing resources can be added to these columns from a long list of monitors collected by the agents.
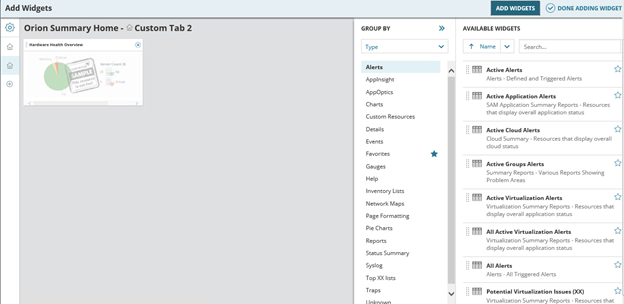
SolarWinds allows users to add widgets to custom tabs. Simply select from a list of available widgets and display them using charts, pie charts, alerts lists, network maps, gauges, and many more.
Users can also generate custom charts for different object resources. Users can easily create new charts by defining object types and selecting a KPI from an auto-populated list of metrics. They can select the time frame, sampling frequency and click on submit to add their chart to a view or dashboard. SolarWinds allows creating views for different teams, and admins can choose to restrict views only to specific teams.
Unlike Grafana, Alerting in SolarWinds is a separate entity and not linked to any panel or dashboard. Users can easily define conditions and choose between numerous ways of notifications.
SolarWinds provides a long list of notification types, including emails, syslogs, running external scripts, creating ServiceNow incidents, sending GET or POST events, and similar.
The Orion platform is adding new features all the time, so users can expect more visualization types and increased flexibility in dashboard creation and panel selection in the future.
What's the Difference?
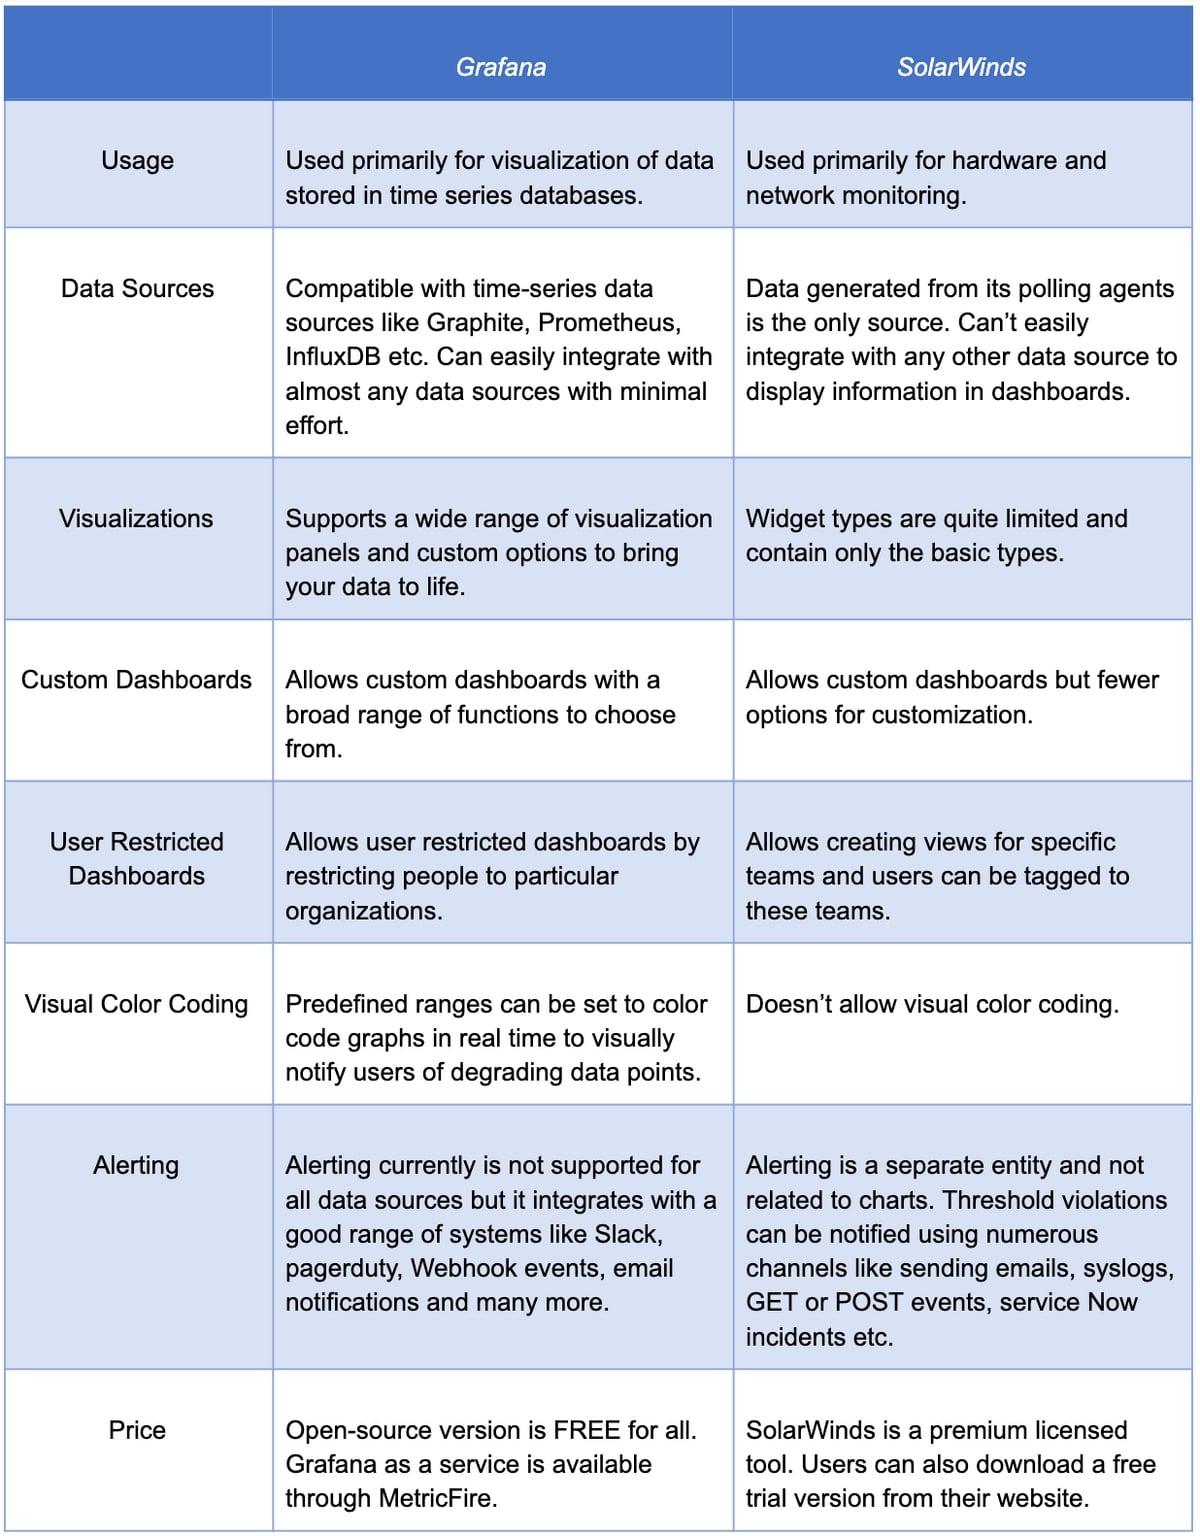
Summary and Conclusion
To conclude, Grafana and SolarWinds are tools belonging to different stacks. SolarWinds is not a visualization tool - they only provide basic options to graph the data collected using their polling agents and then display it using their dashboards.
If you need a purely graphing tool that can integrate with all of your data sources, and provide deep insights over colorful dashboards, then Grafana is the right choice. You can also integrate your SolarWinds data with Integrate.io, a low-code data integration platform, to create powerful ETL and ELT pipelines, and then use Grafana dashboards to amplify your monitoring abilities. You don't have to settle for just one tool.
Sign up for the MetricFire free trial and build Grafana dashboards now. You can also book a demo and talk to the MetricFire team about how you can best set up your monitoring stack.


