
Table of Contents
Great systems are not just built. They are monitored.
MetricFire runs Graphite and Grafana as a fully managed service for growing engineering teams, taking care of storage, scaling, and version updates so your team doesn't have to. Plans start at $19/month, billed per metric namespace rather than per host, and include engineer-staffed support. Integrations work natively with Heroku, AWS, Azure, and GCP, and data is stored with 3× redundancy in SOC2- and ISO:27001-certified data centres.
Introduction
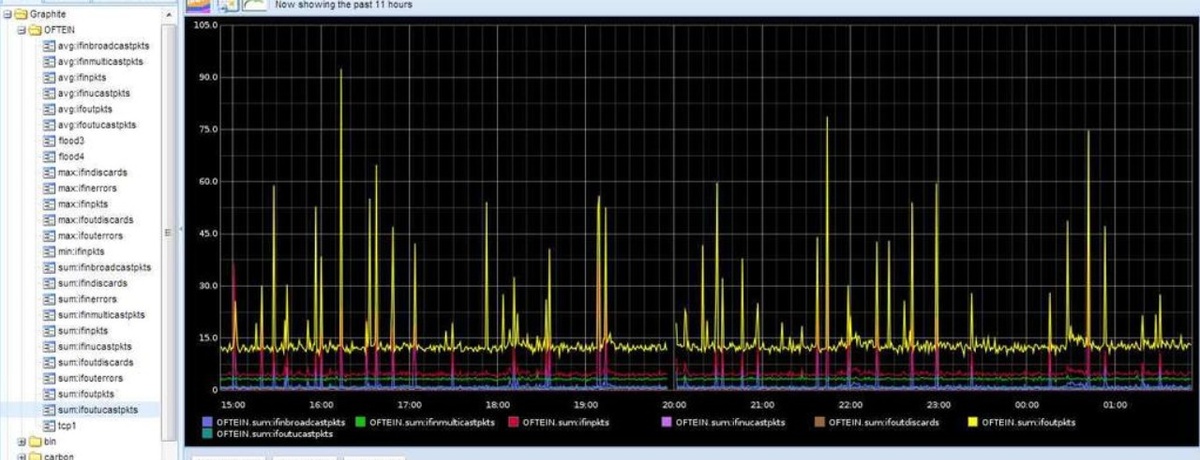
Graphite is a powerful open-source time series database used for storing, retrieving, and visualizing changing numeric data points over time. With its robust monitoring system, Graphite can efficiently handle large data loads without compromising performance.
In this article, we delve into the basics of Graphite, focusing on its primary component, Carbon.
Key Takeaways
-
Graphite is an open-source time series database for storing and visualizing numeric data points that change over time.
-
It efficiently handles large loads without performance issues and is ideal for monitoring diverse data sources.
-
Carbon is Graphite's primary backend daemon, consisting of listener, cache, aggregator, and relay services.
-
Graphite supports various data ingestion methods, including plaintext, pickle, and AMQP.
What is Graphite?
Graphite is an open-source time series database that lets you easily store, retrieve, share, and visualize all your numeric data points that change over time. It is a production-ready monitoring system that can efficiently handle large loads without any performance deterioration.
Anything that generates a numeric data point, be it a website, application, server health, sensor data, or weather data, can be easily sent to and stored in Graphite. These data points can then be fed to a visualization system like Grafana to generate insightful analysis.
Carbon is the primary backend daemon of Graphite and can be divided into multiple components depending on their functionalities.
If you’re having a hard time standing up your Graphite, you should consider checking out Hosted Graphite by MetricFire. MetricFire does all of the work related to Graphite, so developers can focus on what matters most - their business. Book a demo with the MetricFire team, or sign on to a free trial and check out the platform for yourself!
Now, let's understand Graphite data format and the different ways to feed data to Graphite. For teams managing complex data pipelines, tools like Integrate.io can help orchestrate data flows from multiple sources into your monitoring infrastructure through low-code ETL and data integration capabilities.
Graphite Data Format
Graphite has a very simple way of ingesting data. It understands messages in the format:
metric_path value timestamp\n
Here, ‘metric_path’ represents a unique dot-separated identifier composed of a metric name and a set of paths. Each component of the path should have a clear and well-defined purpose in order to avoid confusion between similar performance data coming from different systems. ‘value’ represents the numeric value to be assigned to the metric and ‘timestamp’ is the time in the epoch.
There are 3 main ways of sending data into Graphite:
1. Plaintext – The Plaintext protocol is the easiest way to send data to Carbon. Users can simply send data in the format
<metric path> <metric value> <metric timestamp>
The Protocol continuously listens at port 2003 (default) for any incoming data and stores it on receipt.
2. Pickle - The Pickle protocol is more efficient than the plaintext protocol and allows sending batches of metrics together. The format is similar to multi-level tuples. The default port for this protocol is 2004.
[(path, (timestamp, value)), … ]
3. AMQP – Using the Advanced Message Queuing Protocol (AMQP), when the value of AMQP_METRIC_NAME_IN_BODY is set to TRUE in carbon.conf file, the data format remains the same as the plaintext protocol. But if it's set to FALSE, the metric_path is omitted.
The easiest way to send your data to Graphite is through the plaintext protocol. To test sending dummy data to your Graphite backend at port 2003 (default) using the netcat(nc) program, simply modify the hostname below and enter the following command in unix.
The below command will create a new hierarchical metric named CPU and will enter the value 20 for your current timestamp. You can see the new metric created in your Whisper directory or through the Graphite Web interface.
echo "mydata.dummy.cpu 20 `date +%s`" | nc <your-host-name> 2003
Do you want to send Nagios data to Graphite directly and seamlessly? Read more in our article Graphios – Connecting Graphite and Nagios.
Hosted Graphite by MetricFire makes it even easier to get your data into your Graphite time-series database. Just install the Hosted Graphite Agent, and data will automatically get sent to your MetricFire account.
What is Carbon?
As we said, Carbon is the primary backend daemon of Graphite. Its primary work is to listen for time-series data sent over the common set of allowed protocols. Technically speaking, any data that is sent to Graphite is actually sent to its carbon and carbon-Relay daemons, which are entitled to receive and manage the data. This data is then passed through various components of carbon that are specialized to carry out certain activities before storing the data in its Whisper database.
Components of Carbon and its configurations
All carbon config files are present in the default location /opt/graphite/conf/. For fresh installations, none of the .conf files exists, rather there will be files with .conf.example for each of them. To create your own settings, simply copy the .conf.example files and remove the .example extension.
Carbon usually is divided into four components:
Carbon-cache
Carbon-cache – carbon-cache.py accepts metrics sent through various protocols and writes them to the Whisper database. It also caches the metric values in RAM and pushes all the data according to the intervals defined in Whisper’s storage-schemas.conf file. The cache also provides support to Graphite webapp by returning recently queried data points from memory and helps improve performance. The cache daemon looks at two basic config files to fetch the necessary information needed to handle and store the metrics:
- Carbon.conf – This file is the main config file and primarily defines the ports and protocols to listen for under the [cache] section.
- Storage-schemas.conf – This file defines the retention policies for various metrics and also defines their aggregation timelines (if any). This file is mainly used by Whisper while creating new metrics.
Graphite allows spinning up multiple carbon-cache.py instances to handle the I/O load. Users can run carbon-cache.py instances behind a carbon-aggregator.py and carbon-relay.py.
Carbon-relay
Carbon-relay – carbon-relay.py is primarily used for replication and sharding. The basic config files for carbon-relay.py are:
- Carbon.conf – Listener hosts and ports are defined here along with the RELAY_METHOD. The RELAY_METHOD could either be set to ‘rules’ or ‘consistent-hashing’.
When RELAY_METHOD = rules, the carbon-relay.py instance can run at the forefront and forward all the incoming data to multiple carbon-cache.py backends. These carbon-cache.py instances could then be running on different servers and ports. Users can also choose to define regex patterns to filter their choice of metrics being sent to specific hosts. The patterns would have to be defined in the relay-rules.conf file.
When RELAY_METHOD = consistent-hashing, a DESTINATIONS setting defines the sharding strategy across multiple carbon-cache.py backends. Users can also provide the same hashing list to Graphite webapp using CARBONLINK_HOSTS to spread the queries across multiple backends. - Relay-rules.conf – If RELAY_METHOD is set to rules in the above carbon.conf file, users can define regex patterns or server tuples here and Graphite will forward the metrics to specific hosts or ports based on successful matches.
Carbon-aggregator
Carbon-aggregator – carbon-aggregator.py is primarily used to buffer metrics over time by running it before carbon-cache.py. These metrics can be aggregated before sending them to Whisper which reduces the granularity of data and provides better I/O performance. However, aggregation is a metric-based choice and may not be applied as a blanket over all metrics.
The aggregation-rules.conf allows users to define time intervals, aggregation functions, and regex patterns for metric names. The carbon-aggregator.py listens to buffered metrics over time and after the defined time interval, it aggregates the values as per the defined function (average or sum) and returns a single value to carbon-cache.py which is then saved to Whisper. The carbon.conf contains a [aggregator] section where users can define the listener and destination hosts/ports.
Carbon-aggregator-cache
Carbon-aggregator-cache – carbon-aggrgegator-cache.py was created by combining carbon-aggregator.py and carbon-cache.py. It reduces the overhead caused by running two separate daemons. The [aggregator-cache] section in the carbon.conf file defines the listener and destination ports/hosts. The other changes remain as per the carbon-relay.py and carbon-aggregator.py mentioned above.
Conclusion
To conclude, Carbon is the backbone of Graphite and most of its functionalities are handled by its component daemons. There is a lot that Carbon offers but it depends upon the users and how they want to use it. Aggregation, retention, and storage policies differ from company to company and even metric to metric.
Do you want a simpler solution and don't want to go through the hassles of installation and configurations? Talk to our experts at MetricFire and explore our SaaS product Hosted Graphite.
Hosted Graphite is a cloud-based scalable solution provided by the MetricFire team to capture all your data needs so you don’t have to handle the complexities of storage and configurations. Hosted Graphite is integrated with Grafana and is capable of displaying billions of real-time data points using beautiful graphs and dashboards. Try the Hosted Graphite free trial now.