
Table of Contents
Great systems are not just built. They are monitored.
MetricFire runs Graphite and Grafana as a fully managed service for growing engineering teams, taking care of storage, scaling, and version updates so your team doesn't have to. Plans start at $19/month, billed per metric namespace rather than per host, and include engineer-staffed support. Integrations work natively with Heroku, AWS, Azure, and GCP, and data is stored with 3× redundancy in SOC2- and ISO:27001-certified data centres.
Introduction
Graphios simplifies the process of sending Nagios performance data to backend systems like Graphite. With Graphios, users can easily integrate Nagios with Graphite, eliminating the need for complex scripts. This article explores Graphios' functionality, configuration, and installation process, empowering users to efficiently transfer Nagios data for monitoring and analysis.
Key Takeaways
- Graphios simplifies Nagios integration with Graphite, removing the need for complex scripts.
- Nagios monitors infrastructure and applications, while Graphite stores time-series data and generates graphs.
- Hosted Graphite by MetricFire offers scalable cloud-based storage and integrated Grafana for real-time data visualization.
- Graphios offers easy configuration and installation methods for seamless data transfer from Nagios to Graphite.
- Benefit from streamlined monitoring and analysis by leveraging Graphios' capabilities.
What is Graphios?
Graphios is a program or script written to send Nagios data to various backend systems or time series databases like Graphite. It’s an easier way to send your time series Nagios performance data to your Graphite servers, so you don’t have to worry about writing complex scripts to do it.
Nagios is a powerful IT Management Software suite designed to monitor infrastructure and application components including services, operating systems, network protocols, and network infrastructure. Nagios has the ability to capture the data, and after integration with Graphios, it can easily send it to backend systems like Carbon, and StatsD, or to time series DBs like Graphite. Nagios provides both open-source and enterprise options to suit the needs of all its customers.
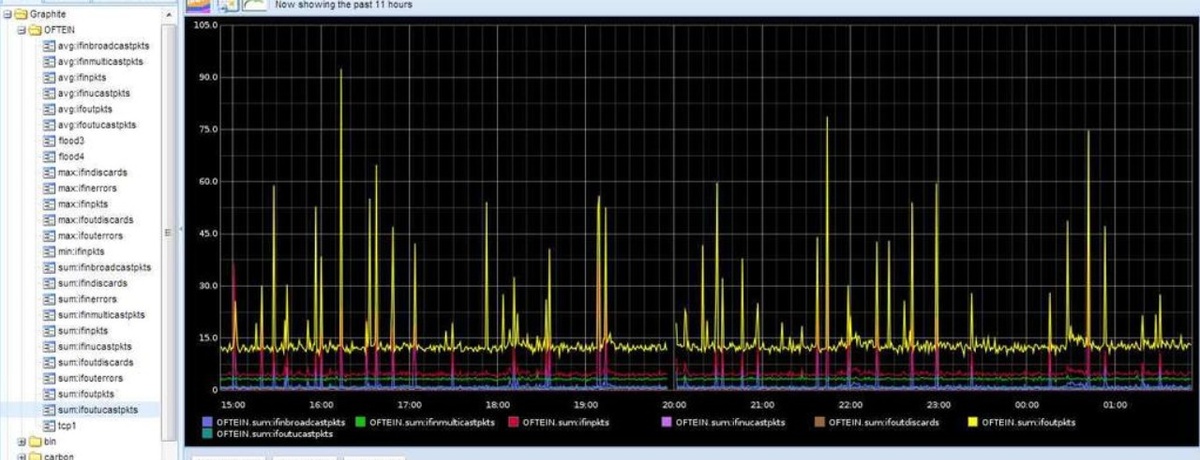
Graphite is an open-source monitoring tool that stores numeric time-series data and renders graphs for the same data. Graphite is easy to configure and works flawlessly even with very large amounts of metrics.
Hosted Graphite is a cloud-based scalable solution provided by the MetricFire team to capture all your data needs so you don’t have to handle the complexities of storage and configurations. Hosted Graphite is integrated with Grafana and is capable of displaying billions of real-time data points using beautiful graphs and dashboards.
To start monitoring with Graphite, you should sign up for the MetricFire free trial here, and monitor with Hosted Graphite now.
How Does Graphios Work?
Graphite understands messages in the format:
metric_path value timestamp\n
where metric_path is the namespace to be populated. The metric_path is a unique identifier for each metric composed of a metric name and a set of paths. Each path component should have a clear and well-defined purpose to avoid confusion between similar performance data coming from different systems.
For example, metrics like cpu, load, rta, etc. are generic metrics. Unless they specify from which system or application tier they belong, it could get very difficult for users to differentiate between hundreds of similar metrics.
Metric paths resolve the confusion by adding some extra dot-delimited details to the performance metric. Sending metric paths like stats.application1.server1.cpu and stats.application1.server1.memory will generate the below hierarchy in Graphite - each metric can be easily distinguished by its hierarchy that states further details about their origin.
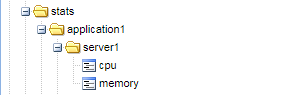
Graphios uses the same format and provides a simple and transparent way to convert Nagios’ monolithic service names into a meaningful hierarchical format. Then metrics can be directly fed into Graphite right from your Nagios checks. Users only have to define a partial dot-delimited metric name for each of these checks.
Graphios then combines the user-defined value along with performance metrics received from Nagios to generate the entire metric path. The overall dot-delimited metric path represents the hierarchy of how the data should be stored in Graphite. For enterprises managing complex data integrations across multiple sources, solutions like Integrate.io can further enhance these workflows by providing low-code ETL and data transformation capabilities to power analytics and operational insights beyond monitoring.
The metric path can be created in Graphios in two different ways:
- By defining values of prefix and postfix variables – Users can enter a prefix value_graphiteprefix or a postfix value_graphitepostfix for every host and service check they configure. Graphios will then append the hostname and performance metric to the value and this will serve as the metric path when the data is sent to Graphite or any other backend system. It’s optional to choose between any or both prefix and suffix values.
Using this approach, only checks that have either or both variables defined will be sent to Graphite. Checks with no prefix or postfix values will not be sent.
The metric path generated by Graphios and sent to Graphite would be in the following format:
_graphiteprefix.hostname._graphitepostfix.perfdata
- By using the service description: Unlike the above way, using this method users will not need to manually define prefix and suffix variables for each check. Instead, Graphios does it automatically for them by directly fetching the value of the service description from the checks they have configured, and adding it with hostname and performance data to create the metric path. The metric path sent to Graphite would then look like this:
hostname.service-description.perfdata
This method can be turned on by changing the below config in graphios.cfg file:
use_service_desc = False
to
to use_service_desc = True
However, this can be unfavorable because it sends every service’s data to Graphite. Also, service descriptions can often be lengthy and descriptive and it’s not a great idea to store them as metric paths.
Examples
Consider a Nagios check that was set up as below:
define service {
use                                         generic-service
hostname                                    server1
service_description                         check_SSH
check_command                               check_ssh
}
The output for the above check would look like this:
SSH OK - OpenSSH_5.3 (protocol 2.0) | time=0.013028s;;;0.000000;10.000000
Now, let's see how Graphios will generate the metric paths and what will be sent to Graphite:
- If only _graphiteprefix is used, the service definition would look like this:
define service {
use                           generic-service
hostname                      server1
service_description           check_SSH
check_command                 check_ssh
_graphiteprefix               stats.nagios.app1
}
Graphios then appends the hostname and perf data to the prefix value to generate the output format as:
Graphiteprefix.hostname.perfdata
The output data sent to Graphite would look like this:
stats.nagios.app1.server1.time 0.013028 nagios_timet
- If both _graphiteprefix and _graphitepostfix are used, the service definition would look like this:
define service {
use                            generic-service
hostname                       server1
service_description            check_SSH
check_command                  check_ssh
_graphiteprefix                stats.nagios.app1
_graphitepostfix               store01
}
Graphios then appends hostname and perf data to the prefix and postfix value to generate the format:
graphiteprefix.hostname.graphitepostfix.perfdata
The output data sent to Graphite would look like this:
stats.nagios.app1.server1.store01.time 0.013028 nagios_timet
- If an automatic service description is used, there will be no change to Nagios checks. Graphios generates the metric path by itself.
Graphios then appends hostname and perf data to the service description received from the Nagios checks to generate the format:
hostname.service_description.perfdata
The output data sent to Graphite would look like this:
server1.check_SSH.time 0.013028 nagios_timet
How To Install Graphios
There are some pre-requisites before Graphios can be successfully installed on your system:
- A working Nagios server
- A working Carbon Daemon (Graphite) and,
- Python 2.6 or later
Graphios can be quickly installed and set up on your Nagios servers using any of the methods mentioned below:
- Using Pythons pip module: Run the pip command on your terminal and let Python take care of the rest. This is by far the easiest way to have a quick install.
pip install Graphios
If you receive an error “Could not find a version that satisfies your requirement Graphios” use the below command instead.
pip install –pre graphios
- By cloning it from the git repository: Run the commands to clone the project from git to your system.
git clone https://github.com/shawn-sterling/graphios.git
cd graphios
Once cloning is complete, use any of the below methods for installation.
A. Set up using Python:
python setup.py install
B. Create an RPM package and install using yum:
python setup.py bdist_rpm
yum localinstall bdist/graphios-$version.rpm
C. Simply copy the files to a folder of your choice.
cp graphios*.py /my/dir
cp graphios.cfg /my/dir
How To Configure Graphios
After the installation is complete, a few other changes need to be made before Graphios can start transporting your data smoothly from Nagios to Graphite.
- Modifying Graphios.cfg: The default location for the file is /etc/graphios/graphios.cfg. It can reside anywhere, but the init script should be correctly pointed to its new location. The file also checks for graphios.py in the same location. The file is well-structured and enlists basic settings. To enable these settings, they must be uncommented, as necessary.
To enable sending data to Graphite backend, change
enable_carbon = False
to
enable_carbon = True
To modify Graphite host and port details, change
carbon_servers = 127.0.0.1:2004
to
carbon_servers = <your-graphite-server-hostname>:<port>
By default, the value is set to localhost address (127.0.0.1) on port 2004 which is carbon’s default port for pickle protocol.
Users can also choose to enable multiple backends (like StatsD and Librato) at the same time.
- Modifying Nagios.cfg: Depending on how you installed Graphios, this step can vary a bit. Users who installed using pip or setup.py may see a block of configuration like below, already appended at the end of their config file. All they have to do is uncomment it to make it work. However, it’s important to reverify the configuration before uncommenting.
The new configuration block at nagios.cfg adds prefix and postfix variables to the output template of each host and service performance data and allows Nagios to send its performance data to a log file in a Graphios understandable format. The config block is as below:
service_perfdata_file=/var/spool/nagios/graphios/service-perfdata
service_perfdata_file_template=DATATYPE::SERVICEPERFDATA\tTIMET::$TIMET$\tHOSTNAME::$HOSTNAME$\tSERVICEDESC::$SERVICEDESC$\tSERVICEPERFDATA::$SERVICEPERFDATA$\tSERVICECHECKCOMMAND::$SERVICECHECKCOMMAND$\tHOSTSTATE::$HOSTSTATE$\tHOSTSTATETYPE::$HOSTSTATETYPE$\tSERVICESTATE::$SERVICESTATE$\tSERVICESTATETYPE::$SERVICESTATETYPE$\tGRAPHITEPREFIX::$_SERVICEGRAPHITEPREFIX$\tGRAPHITEPOSTFIX::$_SERVICEGRAPHITEPOSTFIX$
service_perfdata_file_mode=a
service_perfdata_file_processing_interval=15
service_perfdata_file_processing_command=graphite_perf_service

host_perfdata_file=/var/spool/nagios/graphios/host-perfdata
host_perfdata_file_template=DATATYPE::HOSTPERFDATA\tTIMET::$TIMET$\tHOSTNAME::$HOSTNAME$\tHOSTPERFDATA::$HOSTPERFDATA$\tHOSTCHECKCOMMAND::$HOSTCHECKCOMMAND$\tHOSTSTATE::$HOSTSTATE$\tHOSTSTATETYPE::$HOSTSTATETYPE$\tGRAPHITEPREFIX::$_HOSTGRAPHITEPREFIX$\tGRAPHITEPOSTFIX::$_HOSTGRAPHITEPOSTFIX$
host_perfdata_file_mode=a
host_perfdata_file_processing_interval=15
host_perfdata_file_processing_command=graphite_perf_host
- Defining the Nagios commands: Both the commands graphite_perf_host and graphite_perf_service, which were set up in the above point, must be defined for them to work. Add the below code block to any of your command definition files in Nagios, and restart Nagios.
define command {
       command_name            graphite_perf_host
       command_line            /bin/mv
       /var/spool/nagios/graphios/host-perfdata
       /var/spool/nagios/graphios/host-perfdata.$TIMET$
}
define command {
       command_name            graphite_perf_service
       command_line            /bin/mv
       /var/spool/nagios/graphios/service-perfdata
       /var/spool/nagios/graphios/service-perfdata.$TIMET$
}
- Make a test run for Graphios.py directly from your console to ensure proper working. Use the below commands to see if Graphios is working as expected before we can add them to our Nagios checks.
Add -verbose to the below command to see more details of execution.
./graphios.py --spool-directory /var/spool/nagios/graphios \
--log-file /tmp/graphios.log \
--backend carbon \
--server 127.0.0.1:2004 \
--test
- init script for Graphios: This step is optional and users who installed using pip or setup.py or rpm package, will see this done for them.
The init/ folder in the Graphios directory contains multiple sub-folders, one for each operating system. They contain values for GRAPHIOS_USER and location for graphios.py. Modify the values accordingly, only if needed.
For users who did not install via pip or rpm or setup.py, choose your OS version and run the following commands to copy over the init files.
- For Debian/ubuntu:
cp init/debian/graphios /etc/init.d/
cp init/debian/graphios.conf /etc/init
chmod 755 /etc/init.d/graphios
- For rhel/centos/sl version:
cp init/rhel/graphios /etc/init.d
chmod 755 /etc/init.d/graphios
- For systems with systemd:
cp init/systemd/graphios.service /usr/lib/systemd/system
- Entering host and service configs: After the above configuration is complete, all you have to do is to add the _graphiteprefix and/or _graphitepostfix values for the checks that you want Graphios to send to your Graphite database. See the Example section above to see how the checks should be defined to work correctly.
Conclusion
Graphios is easy to set up and sends all your Nagios performance data to Graphite effortlessly. Graphios can also send data to other backends like StatsD or Librato. Furthermore, it allows sending data to multiple backends of similar types at the same time. Users can easily send the same data to multiple Graphite nodes. This often makes it easier to manage redundancy and reduces the need to separately copy over the same data again to a DR server.
Combining open-source technologies like Nagios, Graphite, Graphios, and Grafana unleashes a powerful and robust monitoring solution. You will be able to capture, ship, store, and display millions of data points as live and colorful visualizations.
Find out how to create great dashboards from our article on Grafana Dashboards.
Talk to our team at MetricFire to hand over all your stressful monitoring needs. Also, see our SaaS solution Hosted Graphite that can effortlessly scale your monitoring based on your needs, without you spending a fortune on infrastructure.
You should sign up for the free trial here, or book a demo and talk to the team directly about your monitoring needs.