
Table of Contents
Great systems are not just built. They are monitored.
MetricFire runs Graphite and Grafana as a fully managed service for small engineering teams, taking care of storage, scaling, and version updates so your team doesn't have to. Plans start at $19/month, billed per metric namespace rather than per host, and include engineer-staffed support. Integrations work natively with Heroku, AWS, Azure, and GCP, and data is stored with 3× redundancy in SOC2- and ISO:27001-certified data centres.
What is Graphite?
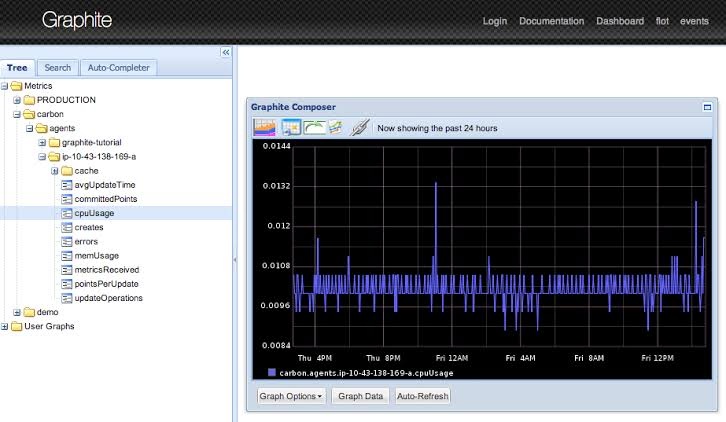
Graphite is an open-source time-series monitoring software that was first released in 2008. It’s a push-based monitoring software, which means that it collects metrics by taking information that is already being expressed, then recording and visualizing it. Graphite usually works together with StatsD or collectd to pull the time-series metrics from an infrastructure. The metrics are then aggregated and stored in Graphite’s database, Whisper. Graphite provides companies with the ability to monitor, store, and visualize data, as well as alert on specific events. Hosted Graphite is available through MetricFire, with Hosted Grafana included in the package.
Get our free trial and start using MetricFire in minutes. You can see if MetricFire is the right fit for you. If you have any questions, you can always book a demo and talk to us directly.
What is Nagios?
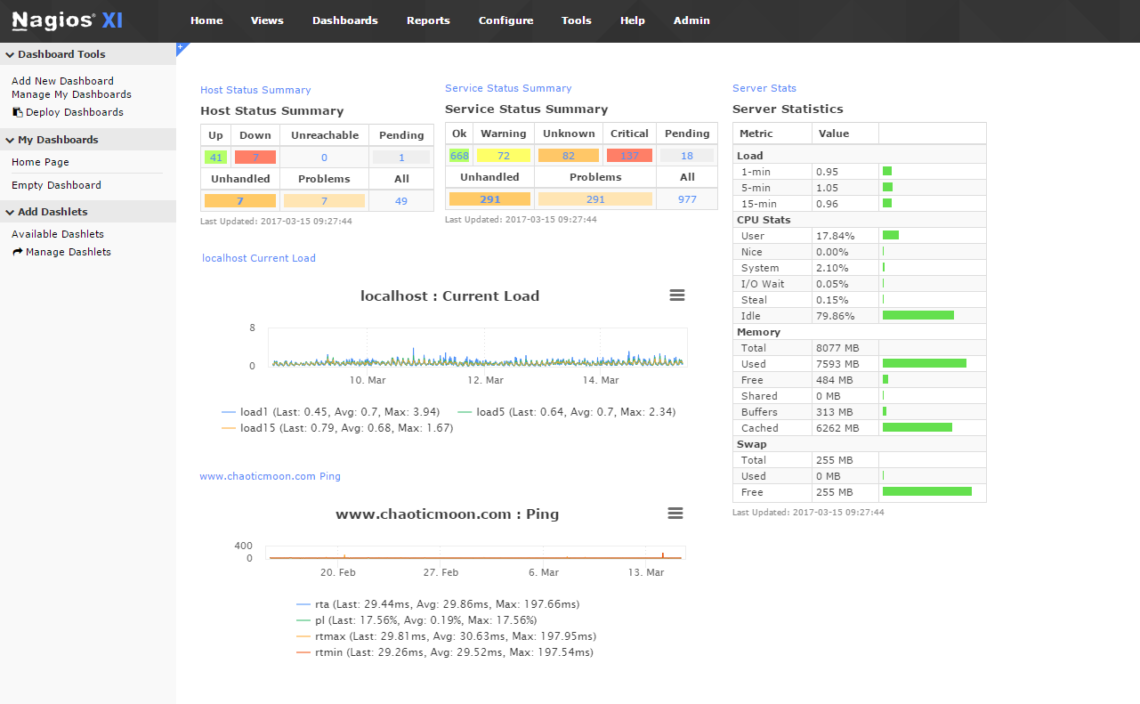
Nagios is proprietary software for server, network, and log monitoring. Nagios can monitor all parts of infrastructure such as applications, services, operating systems, network protocols, systems metrics, and network infrastructure. Nagios can integrate with hundreds of 3rd party plugins. Nagios also has really powerful server performance, allowing Nagios to process limitless scalability of metrics, with high uptime. Nagios has a web interface and advanced dashboarding for visualization. Nagios also allows users to do capacity planning, snapshot configurations so they can be saved and reused, and infrastructure management. Different products are required if you want to monitor network infrastructure or logs, and a third product called Nagios Fusion ties them both together.
When to use MetricFire?
Use MetricFire when you …
- need time-series monitoring for infrastructure.
- need to visualize data from multiple different sources.
- need alerting on key events.
- need a hosted service because your infrastructure is too large to do it by yourself.
When to use Nagios?
Use Nagios when you …
- want to monitor servers.
- want to monitor networks.
- want to monitor applications.
- need Windows or Linux monitoring.
- need log monitoring.
Pricing comparison
- Graphite is open source, and free.
- Business-ready Graphite as a Service by MetricFire, including Hosted Graphite AND Grafana, starts at 99 USD a month.
- Nagios Enterprise starts at 3495 USD per year.
Key takeaways
- Graphite can monitor, store, alert and visualize time-series data of all kinds.
- Graphite is open source, and free.
- Nagios is a legacy IT infrastructure monitoring tool with a focus on server, network, and application monitoring.
Get to know our MetricFire better, and check out how MetricFire can fit into your monitoring environment! Get a free trial and start using MetricFire now. Feel free to book a demo and see what MetricFire can do for you.


