
Table of Contents
Great systems are not just built. They are monitored.
MetricFire runs Graphite and Grafana as a fully managed service for growing engineering teams, taking care of storage, scaling, and version updates so your team doesn't have to. Plans start at $19/month, billed per metric namespace rather than per host, and include engineer-staffed support. Integrations work natively with Heroku, AWS, Azure, and GCP, and data is stored with 3× redundancy in SOC2- and ISO:27001-certified data centres.
Introduction
Part 1: Architecture and Concepts
This article is the second in a two-part series. Read the first article about the concepts and architecture of Graphite here. This section outlines how to install and set up Hosted Graphite independently. MetricFire's product, Hosted Graphite, runs Graphite for you so you can have the reliability and ease-of-use that is hard to get while doing it in-house. You can sign up for a MetricFire free trial here and start sending us metrics today. To get a look at what it would take to do it on your own, check out this guide to installing Graphite.
Key Takeaways
- Learn to install MetricFire's Hosted Graphite for reliable time-series monitoring, with Docker as the preferred installation method.
- Follow the steps to run a Docker container with Graphite, accessing its web interface at http://127.0.0.1:9080/.
- Explore two scenarios for pushing metrics: shell script for single metrics and Python for bulk ingestion using pickle.
Installation and Initial Setup of Graphite
This section assumes that we’re running a Linux machine, in my case it’s Ubuntu 18.04 x86_64 LTS. The easiest way to install Graphite is to use the Docker image distribution. That’s the approach discussed here, though some readers may consider other installation options (e.g. using source code or Python packages) described in Graphite’s installation guide.
First, we’ll need to have Docker installed. On Ubuntu, Docker can be installed as follows:
$ sudo apt install -y docker.io
$ # The step is required to be able to run Docker command
$ # Reload a new terminal once the command has been executed successfully
$ sudo usermod -G docker $USER
The location of the official Graphite’s Docker image is graphiteapp/graphite-statsd, which can be instanced as follows:
$ docker run -d \
         --name graphite \
         --restart=always \
         --volume $(pwd)/graphite/conf:/opt/graphite/conf \
         --volume $(pwd)/graphite/storage:/opt/graphite/storage \
         -p 2003-2004:2003-2004 \
         -p 2023-2024:2023-2024 \
         -p 9080:80 \
         graphiteapp/graphite-statsd
In case of conflicts on port bindings on the Docker machine (see options -p), please switch to other ports. Once you’re successful, the command shall start a container with the following settings:
- carbon-cache bound on ports 2003 for single plaintext metrics, and 2004 for pickle data.
- carbon-aggregator bound on ports 2023 for single plaintext metrics, and 2024 for pickle data.
- Graphite-Web bound behind an NGINX reverse proxy on port 9080, making the web interface available at http://127.0.0.1:9080/.
- Graphite Whisper’s base storage directory (/opt/graphite/storage) is mounted on $PWD/graphite/storage.
- Graphite’s configuration directory (/opt/graphite/conf) is mounted on $PWD/graphite/conf.
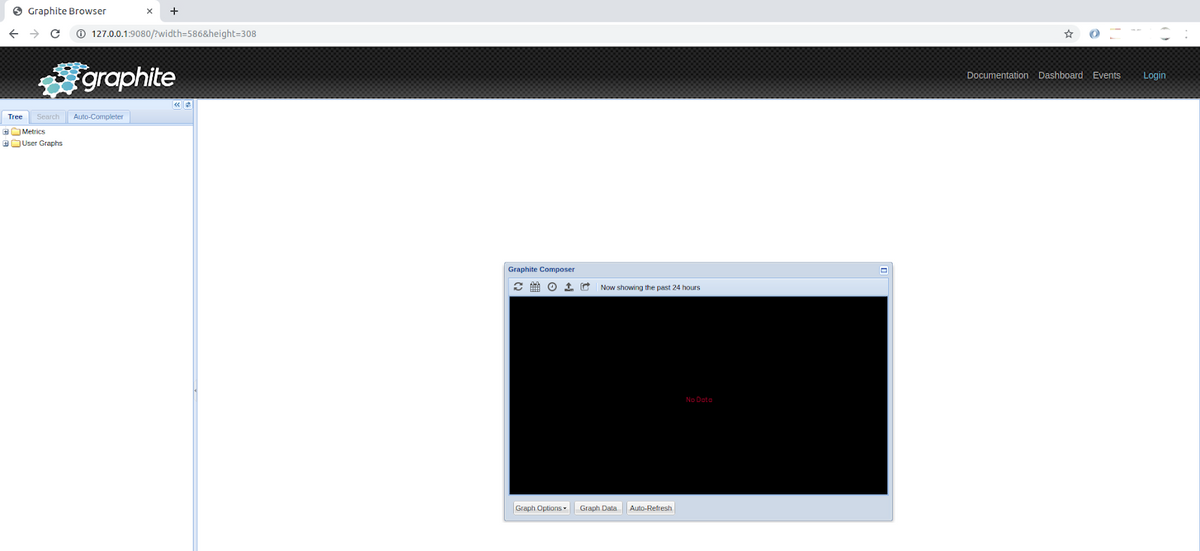
To access the web interface, launch a browser and point it at http://127.0.0.1:9080/. In case of problems, check that the container is running and does not experience any issues:
$ docker ps
$ docker logs -f graphite        # remark that  “graphite” is the name set to the container
If everything is working well, the interface will be loaded as follows. Here is the graphite interface after a fresh installation -- no data is available to display.
Samples of Graphite Clients
Here, two scenarios of Graphite clients will be demonstrated. The first one will show a SHELL script client. It will generate metrics and push them to the server one at a time using the plaintext format. The second one will be a Python program demonstrating bulk ingestion using the pickle protocol.
Pushing Single Metrics
This example demonstrates a Graphite client which uses the sar utility to monitor the IO performance of disk devices on a Linux system. Metrics are pushed to Graphite one at a time as plaintext with the following structure:
<METRICNAME> <VALUE><TIMESTAMP><LINE_DELIMITER>
Where <METRICNAME>, <VALUE>, and <TIMESTAMP> are defined as discussed earlier in part 1, and <LINE_DELIMITER> (the end-of-end character by default) shall match the delimiter set in Graphite listeners' configuration.
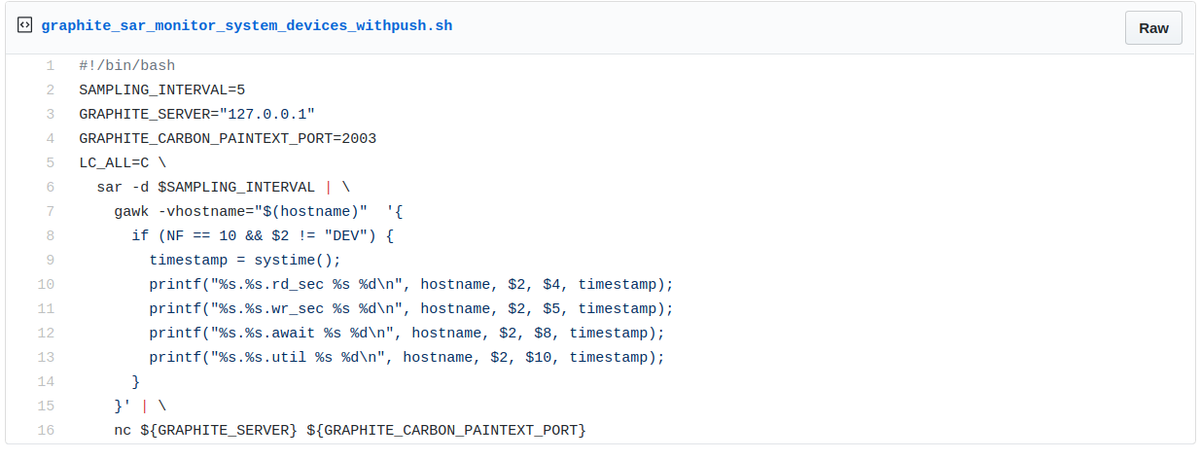
The program looks as below (source gist), consisting of the following main processing steps:
- Retrieve counters for all devices every 5 seconds (line 6).
- Output Graphite metrics samples for:
- the number of sectors read (line 10)
- the number of sectors written (line 11)
- the average time for I/O requests issued to the device still pending (line 12)
- the Percentage of CPU time during which I/O requests were issued to the device (line 13).
- Each metrics name has the following structure: hostname.device_id.counter_name.
- Push each sample individually to Graphite (line 16).
Sample of Graphite client feeding the server with the storage device’s performance metrics.
Assuming that the script has been downloaded in the current folder, it can be executed as seen below. Please note that the script requires that gawk package is installed (on Ubuntu, $ sudo apt install -y gawk).
$ ./graphite_sar_monitor_system_devices_withpush.sh
We should also remark that the script produces 4 metrics for each device. This means that, if the system has N devices, then at each run (every 5 seconds in the above example) the script makes N x 4 calls to carbon-cache to feed in data. On my Ubuntu system with 12 devices, this implies 48 network calls every 5 seconds. If we imagine an infrastructure with many clients doing similar processing, then that will quickly lead to a saturation of the Graphite server. That’s where it would be helpful to use bulk ingestion, or to use a more sophisticated data integration solution like Integrate.io to aggregate and transform metrics across multiple sources before sending them to Graphite.
Pushing Metrics in Bulk
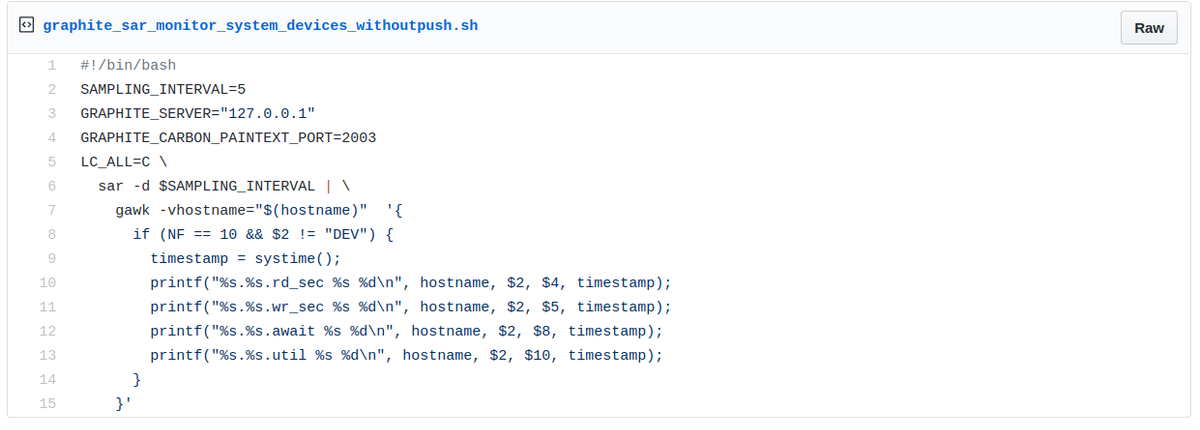
In this part, we reconsider the previous example with a slight change on the monitor script. Indeed, instead of pushing each sample towards Graphite once collected, the script just outputs the entry on stdin as below.
Sample of script outputting system for device performance metrics on stdin.
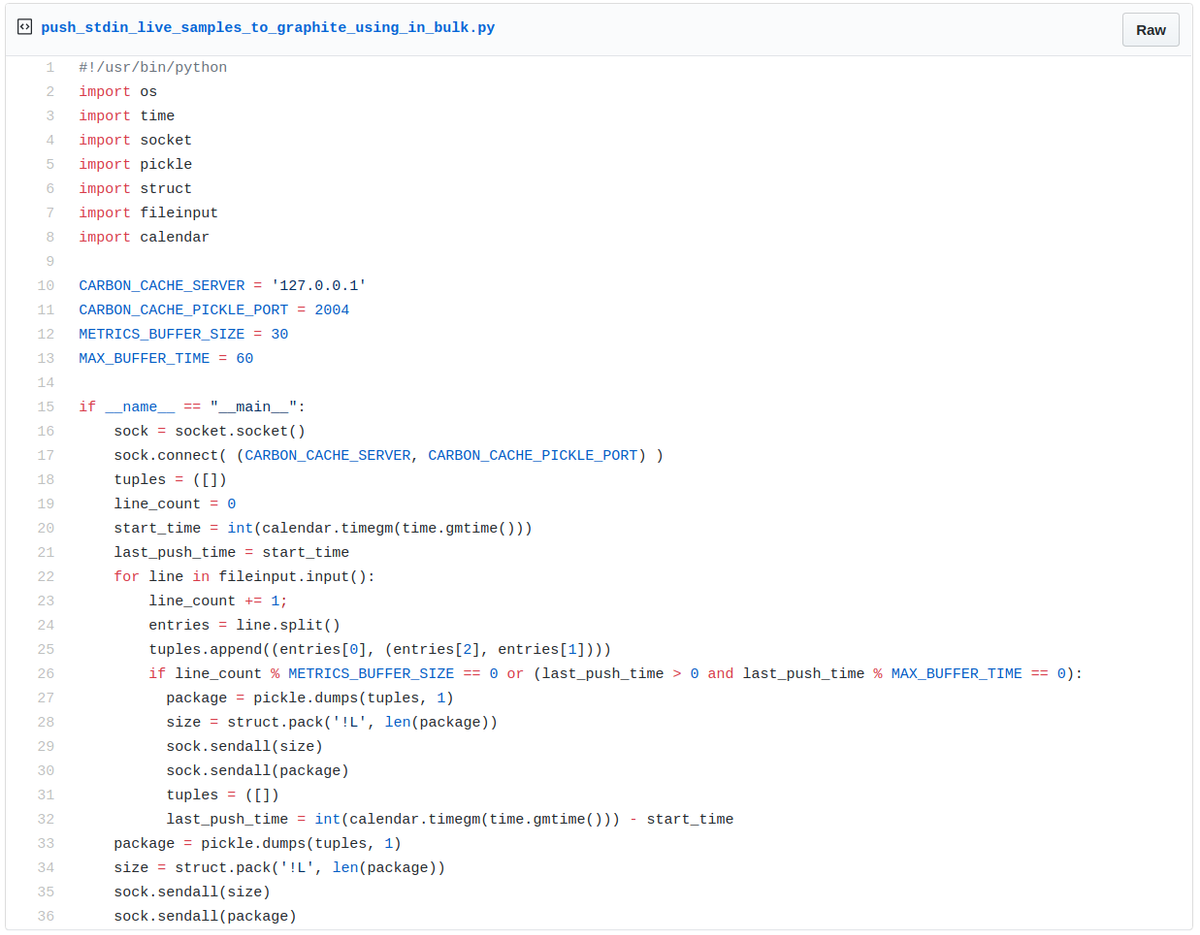
We then have a second Python program (source gist), which expects samples from stdin (line 20) and pushes them to carbon-cache in bulk using the pickle protocol. Data are pushed once a certain number of samples (METRICS_BUFFER_SIZE) are buffered or upon a defined period of time (MAX_BUFFER _TIME) (see line 26).
Sample of Graphite client that gets samples from stdin to feed the server in bulk
Assuming that the two scripts have been downloaded in the current folder, the two programs can be piped together as below. Therefore the outputs of the first script are continuously taken over by the second script to feed into Graphite in bulk.
$ ./graphite_sar_monitor_system_devices_withpush.sh | \
       ./push_stdin_live_samples_to_graphite_using_in_bulk.py
Visualization
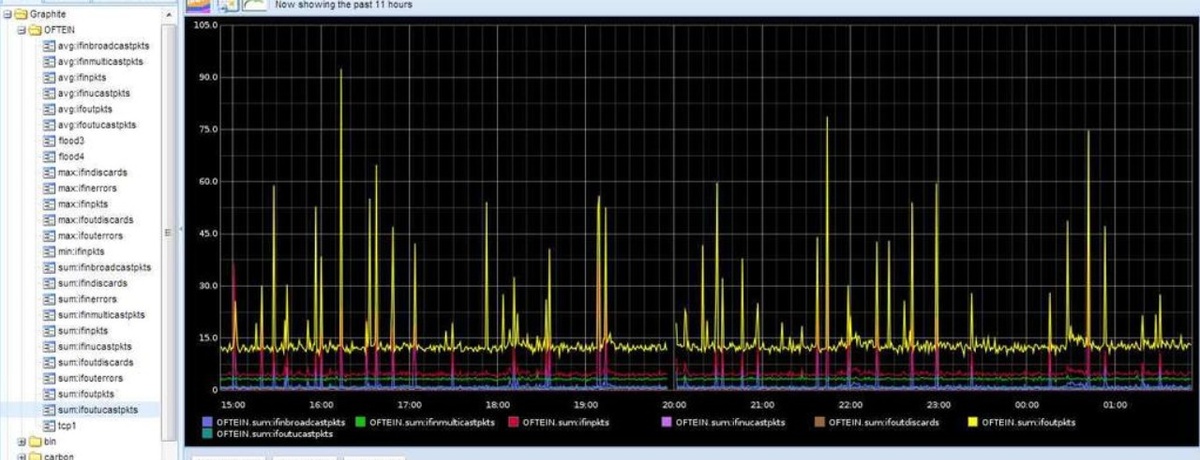
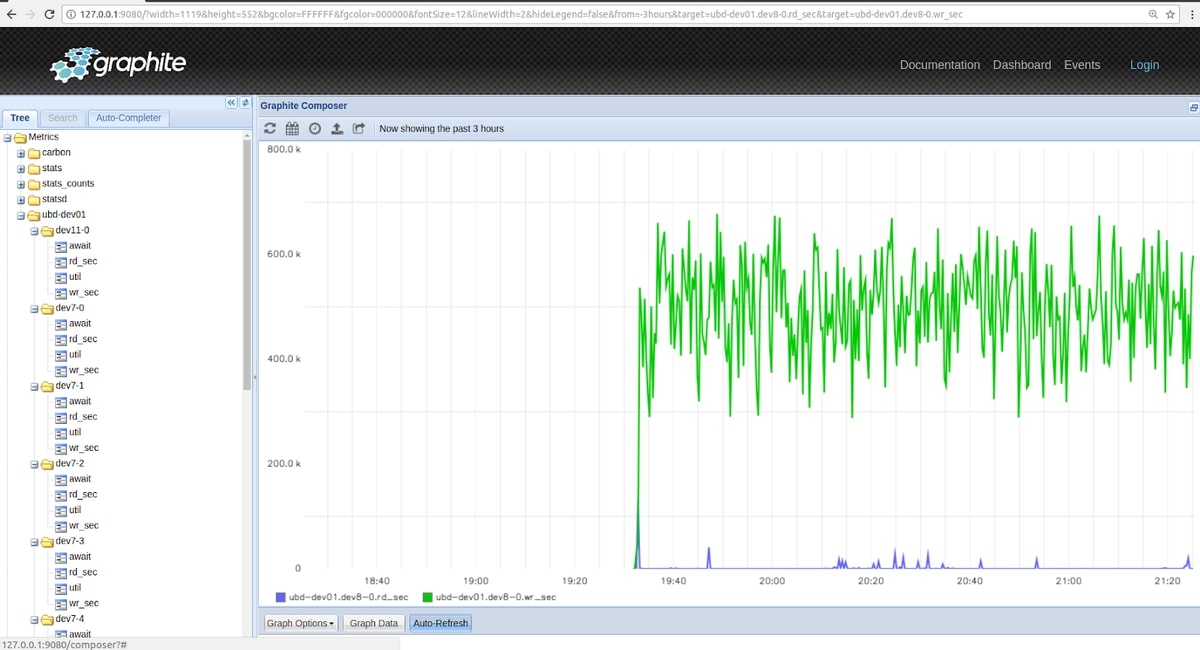
For this demonstration, I used stress-ng to submit loads on the client machine and I waited a couple of hours to have a significant number of metrics fed into Graphite. I then went again to the web interface to confirm that those injected metrics are available at the left side under the “metrics” item. From this point, we can start exploring those metrics and select those we want to display, as you can see in the following screenshot.
Screenshot of Graphite Web displaying some metrics.
Conclusion
In the first article, we introduced the basic concepts and architecture of Graphite, and then in this article, we went through an installation using the official Docker image. We further demonstrated two step-by-step examples showing how to generate metrics and push them to Graphite. The first example demonstrated how to feed single metrics into Graphite, while the second one uses a pickle to feed data in bulk. We finally demonstrated the visualization of ingested metrics via Graphite Web, the native web interface provided by the Graphite project.
Before ending this article, here are some takeaways:
- Graphite is simple to master, yet it's a powerful and scalable time-series monitoring system.
- Each user needs to carefully think of their specific needs and dimensions, and design a Graphite architecture that addresses those needs (single server, multi servers, with or without aggregators, etc.)
- Consider using bulk ingestion when many samples have to be pushed to Graphite at a time.
- For an advanced and more flexible visualization, typically for operations environments, it would be likely preferable to opt for Grafana instead of the default web interface.
Don't hesitate to go through the Graphite documentation website for additional resources. Also, Check out more MetricFire blog posts below, and our hosted Graphite service! Get a free trial and start using MetricFire now.
Feel free to book a demo if you have questions about what MetricFire can do for you.