
Table of Contents
Great systems are not just built. They are monitored.
MetricFire runs Graphite and Grafana as a fully managed service for growing engineering teams, taking care of storage, scaling, and version updates so your team doesn't have to. Plans start at $19/month, billed per metric namespace rather than per host, and include engineer-staffed support. Integrations work natively with Heroku, AWS, Azure, and GCP, and data is stored with 3× redundancy in SOC2- and ISO:27001-certified data centres.
Introduction
NOTE: This article is the first of a two-part series. To continue your learning, see the next blog- Part 2: Installation and Setup
In this article, we provide a concise guide to help you get started with Graphite quickly and efficiently. We cover the basic concepts, architectural considerations, and metrics aggregation of Graphite. We also explain the data feeding methods, metrics format, and storage using Graphite's file-based database. Additionally, we discuss visualization options, including Graphite-Web and Grafana.
Key Takeaways
- Graphite revolutionized monitoring with its network-based approach for handling metrics data.
- It offers single-instance and multi-instance architectures for scalability in different environments.
- Metrics aggregation optimizes storage and retrieval of time-series data.
- Graphite supports TCP and UDP data feeding modes, balancing reliability and speed.
- Data storage is file-based with hierarchical organization, and visualization options include Graphite-Web and Grafana.
What Is Graphite?
Graphite is a leading open-source time-series metrics monitoring system. First released in 2008, Graphite modernized the way organizations monitored time-series data by introducing an original network-based approach to ingest and handle metrics data coming from external systems, without requiring painful protocols such as SNMP. MetricFire runs a Hosted Graphite service - you can try our free trial today and skip the setup and management of your Graphite installation. This article is part 1 in a two-part series. Take a look at this series to see what exactly Hosted Graphite does behind the scenes. Check out the second article about Graphite installation and setup here.
Basic Concepts
This section describes how Graphite works and highlights important concepts.
Architecture
The first architecture described below consists of a single server instance aiming to cover the needs of small and medium environments. The second one -- consisting of several Graphite instances -- addresses the needs for large and/or distributed environments.
Single-instance Architecture and Constraints
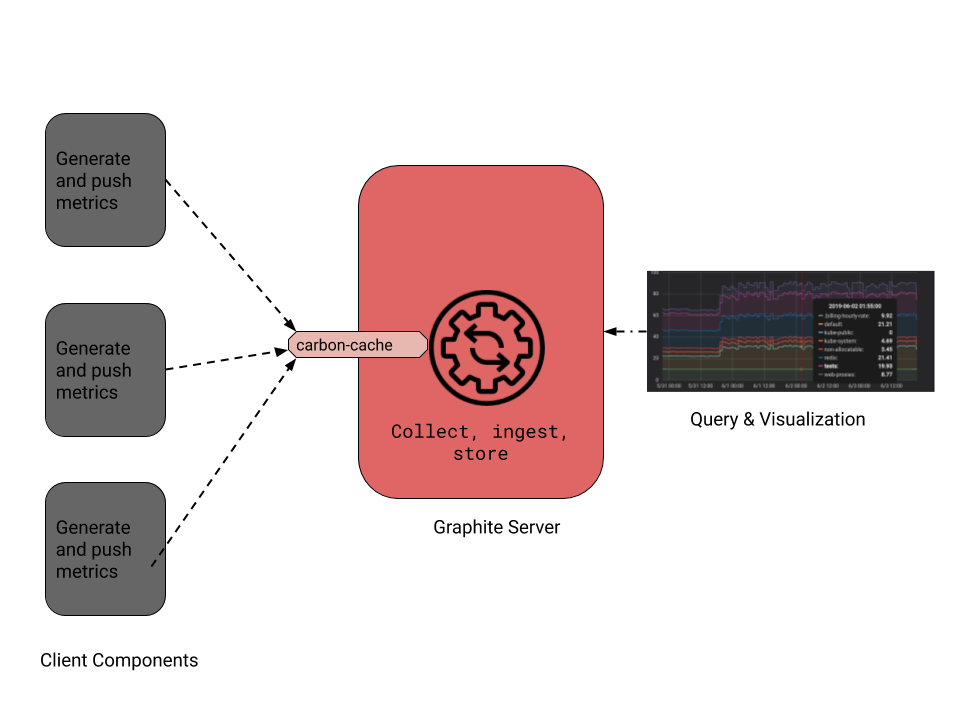
The basic architecture of a Graphite monitoring environment looks like the following diagram. There is a central server providing a handler (namely carbon-cache) where clients feed data through the network. Graphite uses a push approach to data collection, meaning that each client decides when to push data to the server. This can be seen contrary to a pull approach where it’s the server that decides when to collect data from clients. This push approach has its benefits and its drawbacks as already discussed here. We’ll not dive in again in full detail, but we should consider the following aspects regarding Graphite:
- Each client should be aware of and be able to handle cases where the server can’t receive and ingest the data sent to it.
- A Graphite client can be any piece of software, no matter the language selected, as long as it’s able to feed the server via the network using a protocol and data format supported by Graphite. These protocols and data formats will be discussed later in this section.
- Having each client decide when to push data to the server implies especially that the server is able to ingest high-frequency data coming from many clients at a time (especially in large environments). Otherwise, the monitoring would not scale. Considering this aspect, Graphite leverages various features and deployment strategies allowing it to cover, small, medium, and large monitoring environments. We’ll discuss some of those capabilities next. When possible, we’ll provide additional links to help readers go further on concepts that will not be discussed.
A basic Graphite architecture with a server and three clients. The server enables a carbon-cache handler to collect and ingest metrics data pushed to it by those clients.
Multi-instances Architecture
Graphite provides efficient ingesting capabilities such as using in-memory caching of metrics before storage. However, in an environment with a huge number of clients and/or an environment that requires a high frequency of data ingestion, a single server instance may not be enough to support the load. Graphite has advanced deployment capabilities to cope with these situations.
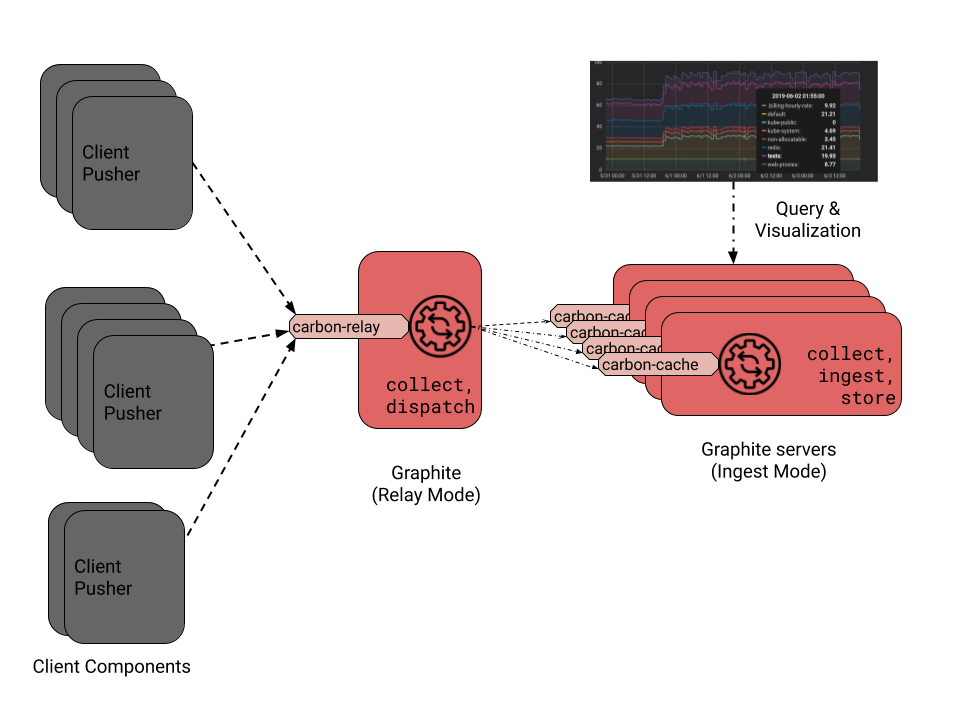
A classical distributed deployment scenario is sketched in the next diagram. In such a scenario, there is a special Graphite instance acting as a load-balancing front end for a set of other Graphite instances. This front-end instance enables a special handler called carbon-relay, whose role is to collect data from clients and dispatch them to other instances without any additional processing. It hence acts as a load balancer that forwards the incoming data to other instances according to rules predefined in its configuration. Each of the backend instances enables a carbon-cache handler to collect, ingest and store the metrics it receives. Since the carbon-relay handler does not do complex processing compared to a carbon cache, this architecture allows us to easily scale a Graphite environment to support a huge number of clients, even with a high frequency of data feeding.
A Graphite architecture with load-balancing -- There is a front-end Graphite server enabling a carbon-relay handler, which collects metrics and dispatches them to other Graphite servers with carbon-cache daemons enabled to collect, ingest and store those metrics.
Metrics Aggregation
Graphite handles metrics where the most detailed resolution for time sampling is a second. This means that if several samples of metrics are collected with the same timestamp (in seconds), those samples cannot be stored separately in Graphite. To cope with those kinds of situations, Graphite provides a special handler (namely Carbon Aggregator) that can be configured to collect all samples received in a configured period of time. It aggregates them using functions such as sum and average, to generate single metrics, that can be stored. It's also common in those cases to have StatsD in front of Graphite to aggregate any data with less than a second resolution.
The capabilities of Graphite's aggregators also cover various other use cases, such as:
- When the accuracy needed for metrics is less than the frequency with which samples are received. For example, imagine a scenario where metrics are received every couple of seconds, but we want analytics that just provide average metrics every 5 minutes.
- The aggregation may then be enabled in order to minimize the storage capacity.
- When users would just want to get the sum of samples received in a given interval. As an example, consider a metrics collector that pushes the number of requests received by a certain service every second, but we just want analytics that shows the number of metrics received every five minutes.
TCP/UDP Data Feeding
Graphite network handlers can be enabled in TCP or UDP modes. When enabled in TCP mode, data exchanges between each client and the server leverage the reliability of the TCP protocol and guarantee no loss of data. But this implies that each data exchange induces latency overheads due to the synchronization that the TCP protocol requires to be reliable. Such reliability can be required for certain use cases, but in some use cases, a little data loss may be tolerated. Imagine for example a metrics monitoring environment where a lot of data are generated every couple of seconds and where analytics require less resolution. In those cases, Graphite enables the ability to set up network listeners in UDP mode. This makes the data feeding faster, and would hence be really useful in large environments.
Metrics Management
Metrics Format
Each metrics sample pushed to a Graphite server shall have the following entries:
- A metric name should be a free ASCII string identifying the metric.
- A value shall be an integer or a float point number corresponding to the value of the metrics sample.
- A timestamp, expressed as a number of seconds since the epoch.
Metrics Path
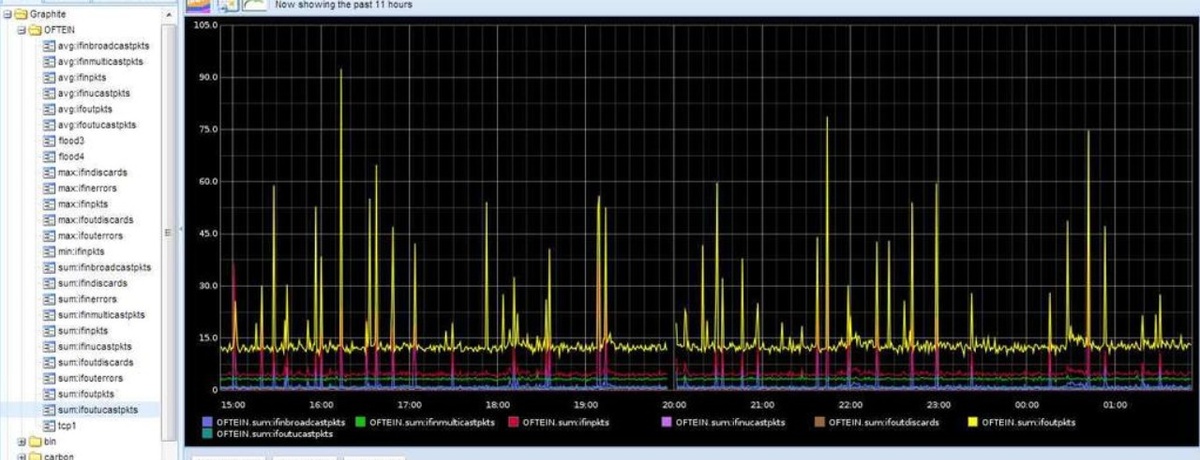
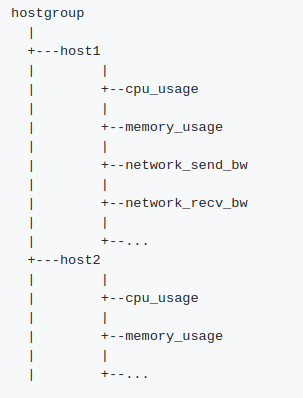
Metrics names may contain one or more dots (e.g. server1.application1.request_count), and they’re commonly referred to as a metrics path. This dot-based metric name is internally used by Graphite to organize data storage in a way that optimizes the access and retrieval of metrics. Further, as illustrated in the below figure, it can be also used as a hint for a tree-based data exploration and visualization of metrics.
Illustration of a Graphite metrics tree -- Here metrics paths include at the first level, host groups, at the second level, hostnames, and at the third and last level, actual metrics names.
Pushing Metrics to the Server
There are two ways to feed metrics in Graphite, either as a single plaintext metric or as a binary set of metrics using pickle protocol. This latter approach unlocks the benefits of pushing data in bulk, while limiting the size of data transiting across the network, using a compact binary data serialization. For each of these approaches, the Graphite server needs to enable appropriate listeners, either on carbon cache or on carbon relay, to handle those data. For example, a default installation of Graphite enables carbon-cache listening on port 2003 for single metrics, and on port 2004 for pickle data.
Metrics received through each listener are processed and stored as described in the following section.
Data Storage
Internally Graphite stores metrics in a file-based database (Whisper by default). This database has some essential characteristics:
- There is a base directory from where metrics are stored, each in a separate file. If the metric name is expressed as a path as discussed above, i.e. including one or more dots, those dots are handled as subdirectories from the base location. E.g. A metric named server1.application1.request_count would be stored in a file located at server1/application1/request count.wsp from the base metrics directory.
- A metrics file has a fixed size, meaning that it can not grow indefinitely. To guarantee that, metrics are defined with two important properties: a retention period and data resolution over time. As an example, we can set it so that metrics will be stored for one year (retention), with a resolution of 1 second for the last two weeks, 5 minutes for the last 2 months, and 1-hour resolution the rest of the time.
- The retention period and the resolution allow us to determine the size of each file.
Visualization
Once metrics have been ingested, there are various means to visualize them. The first one is to use Graphite-Web, the native visualization tool provided by the Graphite project. However, it may not be flexible enough for operations visualization. That's why users often opt to use Grafana, which provides better visualization features combined with the fact that it can handle many Graphite instances simultaneously. For organizations that need to integrate metrics data with other systems and workflows, Integrate.io offers a low-code data integration platform that can help pipeline Graphite metrics alongside other data sources for comprehensive analytics and reporting. Finally, in some rarer cases, users may also opt for custom-made visualization systems that retrieve metrics in Graphite through Graphite Web or Graphite API.
Conclusion
To keep reading about Graphite, go to the second article in this series about installing and setting up Graphite. If you're interested in using Graphite, but the setup and management of the Graphite installation would be too much, try our Hosted Graphite free trial. Also, feel free to book a demo and talk to us in person about monitoring your infrastructure.