

Table of Contents
Great systems are not just built. They are monitored.
MetricFire runs Graphite and Grafana as a fully managed service for growing engineering teams, taking care of storage, scaling, and version updates so your team doesn't have to. Plans start at $19/month, billed per metric namespace rather than per host, and include engineer-staffed support. Integrations work natively with Heroku, AWS, Azure, and GCP, and data is stored with 3× redundancy in SOC2- and ISO:27001-certified data centres.
What is Hosted Graphite?
Hosted Graphite by MetricFire is a time-series metric storage and observability tool used for application, systems, infrastructure and network monitoring. Hosted Graphite is a service that offers the full capabilities and benefits of Graphite, without any of the hassle of trying to set up your own open-source Graphite installation.
Monitoring your Heroku stack is crucial for gaining insights into your application's performance and infrastructure. By identifying bottlenecks, slow queries, or resource-intensive processes, you can optimize your system for better efficiency. Real-time monitoring enables you to promptly detect issues or anomalies while setting up alerts based on predefined thresholds ensures timely notification of any problems. While Heroku offers a platform-as-a-service (PaaS) environment, monitoring your app's resource usage is essential to ensure your application can handle user traffic effectively.
What are the benefits of using Hosted Graphite?
Hosted Graphite allows you to:
- Get up and running quickly with a one click monitoring solution that requires minimal setup.
- Create custom dashboards and alerts around the metrics that matter most to your Heroku application and services.
- Identify performance issues early and respond faster by tracking system and application metrics in one place.
- Understand performance at a per service level, making it easier to plan capacity, reliability, and ongoing improvements.
- Maintain long term metric history to spot trends, measure changes over time, and guide future decisions.
- Share clear, easy to understand dashboards with teammates, managers, and non technical stakeholders.
- Scale your monitoring as your app grows, handling large volumes of custom metrics at a competitive price.
Hosted Graphite on Heroku
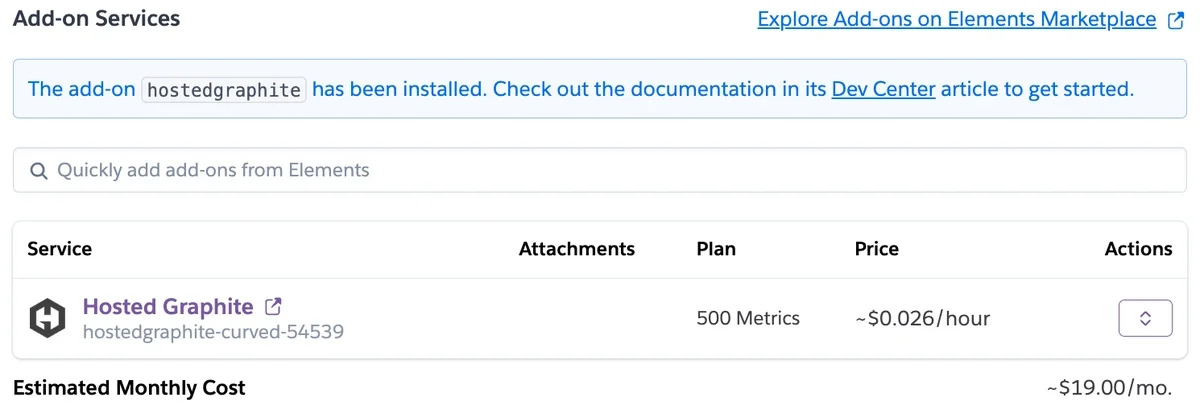
Provisioning the Hosted Graphite add on for Heroku is quick and straightforward. You can add it to your app directly from the Heroku UI with a single click, or provision it from the command line using the Heroku CLI: heroku addons:create hostedgraphite -a <app-name>
Once enabled, your app metrics start flowing automatically, so you can begin monitoring right away without additional setup or infrastructure.
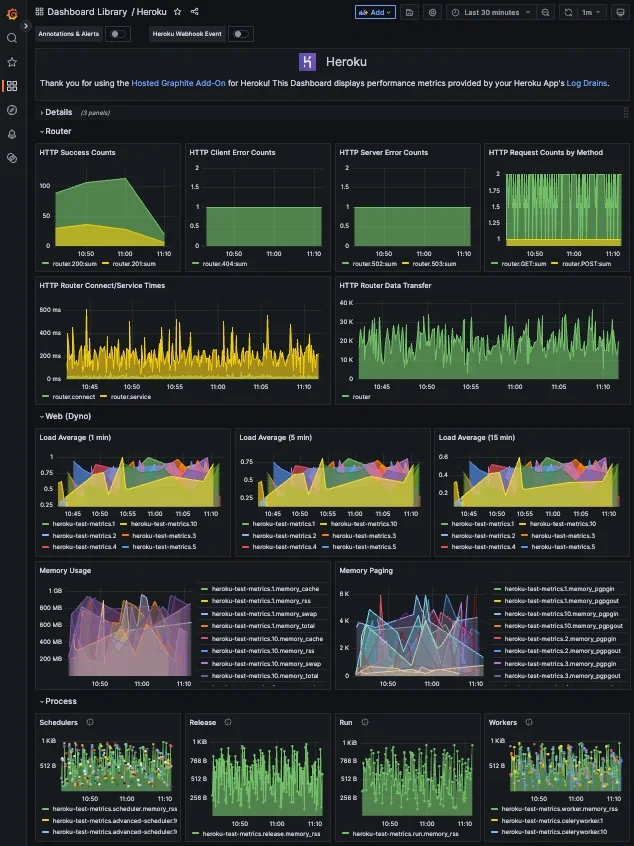
The Heroku Hosted Graphite add-on comes standard with Hosted Grafana and dashboards that display your Heroku app metrics. This makes it easy and fast to set up your Heroku monitoring so you can get back to what you do best: building your business.
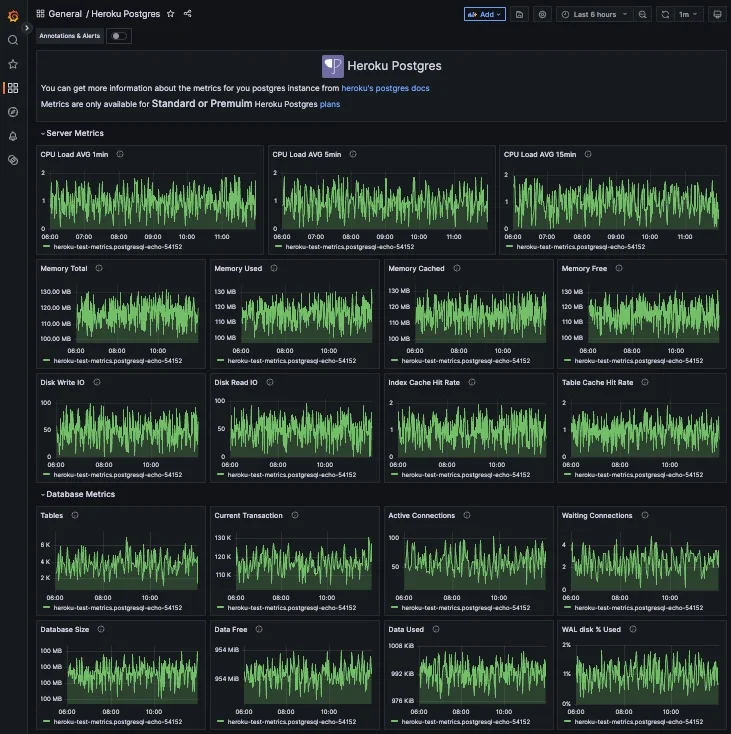
The automatically generated dashboards provide visualizations for dyno metrics (CPU load, memory), HTTP router metrics (connection timings, success/error/request/status counts), process metrics (scheduler, release, run, worker), and add-on metrics (Postgres, Redis, Kafka. You can also easily build your own dashboards and integrate with other platforms and tools, like AWS, New Relic, Sentry, GitHub, and many more.
Key Features of Hosted Graphite
Hosted Graphite provides a complete monitoring environment for infrastructure, systems, and applications, built on top of open source Graphite and extended to handle real world production needs. It brings together metric collection, storage, visualization, and alerting into a single hosted platform, so teams can focus on using their data rather than managing the tooling behind it.
At its core, Hosted Graphite is based on Graphite, an open source system designed for storing numeric time series data and rendering graphs from that data. Metrics are sent to Graphite’s Carbon endpoint, timestamped, stored in a time series database, and queried using Graphite’s flexible query language. Hosted Graphite manages all of this for you, including aggregation, storage, backups, and scaling, removing the operational burden of running Graphite yourself.
To make Graphite practical in modern environments, HG includes built in support for common metric collectors and integrations. This includes tools like Hosted StatsD and agents like Telegraf, as well as integrations with platforms such as Heroku, AWS, Azure, GCP, and Kubernetes. You can send server metrics, application level metrics, and integration metrics into a single monitoring system without stitching together multiple tools.
Hosted Graphite also extends standard Graphite with features that are essential for teams:
- One click setup through platforms like the Heroku add on, with no infrastructure to manage
- Built in metric aggregation and data views for easier organization and querying
- Custom dashboards that let you visualize infrastructure, application, and business metrics side by side
- Alerting on any metric, with notifications sent through channels like Email, Slack, PagerDuty, Microsoft Teams, OpsGenie, webhooks, and more
- Team accounts with granular permissions, making it easy to share dashboards while controlling access
- APIs for automating configuration and managing your monitoring environment programmatically
Under the hood, Hosted Graphite improves on the traditional Whisper storage model with a cluster native storage system designed to handle large datasets and high cardinality metrics more reliably. This helps avoid common issues seen in self hosted Graphite setups, such as query timeouts, scaling limits, and long term storage challenges.
By combining the strengths of open source Graphite with managed infrastructure, integrations, alerting, and collaboration features, Hosted Graphite provides a practical and flexible monitoring solution for teams running production workloads on Heroku and beyond. Hosted Graphite’s Heroku add-on takes care of all metric processing for you, without you having to worry about anything.
Hosted Grafana Dashboards
Hosted Graphite includes fully managed Grafana dashboards for visualizing your metrics in a flexible and intuitive way. Grafana makes it easy to explore time series data, build custom dashboards, and dig into trends without needing to write complex queries or manage additional infrastructure. Everything is hosted and maintained for you, so dashboards are available as soon as your metrics start flowing in.
You can create dashboards that match how your team thinks about the system, whether that means high level overviews or detailed views of specific services. Panels, rows, and filters can be customized to focus on what matters most, and time range controls and zooming make it easy to investigate changes or incidents as they happen.
With Hosted Graphite’s Grafana integration, you get:
- Pre built dashboards tailored to common Heroku add ons and services
- Managed Grafana instances, with no setup or maintenance required
- Any current version of Grafana that you require (default v9.5)
Grafana dashboards are included with every Hosted Graphite plan, regardless of size, making powerful visualization and alerting available whether you are just getting started or running at scale.
Custom Alerts and Notifications
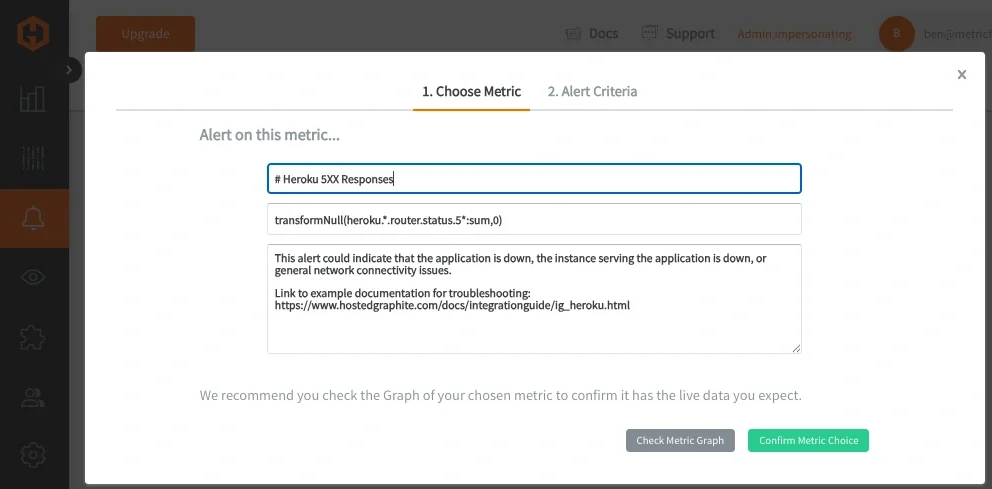
Hosted Graphite’s alerting system lets you set up automated notifications from your metrics when they are exceeding thresholds, falling below a limit, or failing to report at all. Alerts are defined by selecting a stored metric or metric pattern and specifying criteria that determine when an alert should trigger. You can control how often notifications are sent, whether only on state changes or at regular intervals, helping you avoid excessive noise while still staying informed about important events. Hosted Graphite’s internal alerting triggers on metric ingestion, which often gives faster response times compared to external dashboard-based alerting tools.
Once an alert is created, it appears in the Alerts Overview with a status indicating whether it is healthy, triggered, muted, or inactive. You can edit, mute, or delete alerts through the user interface, and view recent activity and history directly from the alert panel. Alerts can be delivered through a variety of notification channels including email, Slack, PagerDuty, Microsoft Teams, OpsGenie, VictorOps, or custom webhooks, so teams receive alerts where they are most likely to see them.
Hosted Graphite also supports programmatic alert management through its Alerts API, enabling automated creation, updating, and querying of alerts as part of deployment or monitoring workflows.
Hosted Graphite Use Cases
Hosted Graphite is commonly used to monitor systems, infrastructure, and applications, giving teams a clear picture of how their software is behaving in production. Because it can accept any time series data, it is easy to bring together metrics from your Heroku app, underlying services, and supporting infrastructure in one place.
Teams also use Hosted Graphite to track business and product metrics alongside technical data. Viewing things like request volume, feature usage, or customer activity next to performance metrics makes it easier to understand how system behavior affects real users. With everything on a single set of dashboards, teams can quickly identify where issues are happening and which customers or services are impacted, helping them respond more effectively and with better context.
Check out the HG customer profiles here, and see how our customers are using the product.
Conclusion
Monitoring your Heroku infrastructure and add-ons is crucial for optimizing performance, ensuring resource efficiency, and proactively addressing issues. It allows you to detect and resolve bottlenecks, anomalies, and security incidents in real-time, contributing to a better user experience. Additionally, effective monitoring aids in cost optimization by identifying unused resources and ensuring compliance with industry standards and regulations. Hosted Graphite integrates seamlessly with Heroku, and offers a monitoring environment for much less than other platforms, like Data Dog.
Tools like dashboards and alerts will complement your data by providing real-time visualization, proactive identification of issues, historical trend analysis, and facilitating informed decision-making, all of which are essential for maintaining a robust and efficient infrastructure.
Sign up for the free trial, and experiment with monitoring your Heroku stack today. You can also book a demo and talk to the MetricFire team directly about your monitoring needs.

