
Table of Contents
Great systems are not just built. They are monitored.
MetricFire runs Graphite and Grafana as a fully managed service for growing engineering teams, taking care of storage, scaling, and version updates so your team doesn't have to. Plans start at $19/month, billed per metric namespace rather than per host, and include engineer-staffed support. Integrations work natively with Heroku, AWS, Azure, and GCP, and data is stored with 3× redundancy in SOC2- and ISO:27001-certified data centres.
Introduction
Grafana is a tool that helps users identify and fix performance issues by allowing them to monitor and analyze their database. Grafana is famous for making great graphs and visualizations, with tons of different functionalities.
This Grafana tutorial is about one of these functionalities: Annotations. Grafana annotations are for users who want to make notes directly onto the graphs in their dashboards.
There are various reasons a user might want to do this. For example, if a specific event happened that affected the data, it makes sense to leave a note describing the event directly on the graph. This can be done using Grafana Annotations.
In MetricFire’s Hosted Grafana, users can use Grafana directly in the web app without installing or setting up Grafana on their own machines. You can use all of the features of Grafana in the MetricFire platform, including Annotations. In some cases, you can even have annotations set up for you automatically through our add-ons. Check out our automatic Github annotations feature here.
To follow along with this Grafana tutorial, you should sign up for the MetricFire free trial. You can get your MetricFire Grafana dashboard set up in minutes and start making annotations right away.
Key Takeaways
This Grafana tutorial will take you through the following concepts:
- Annotations
- Built-in querying
- Querying by tag
- Querying other data sources
- Annotations automations
Annotations
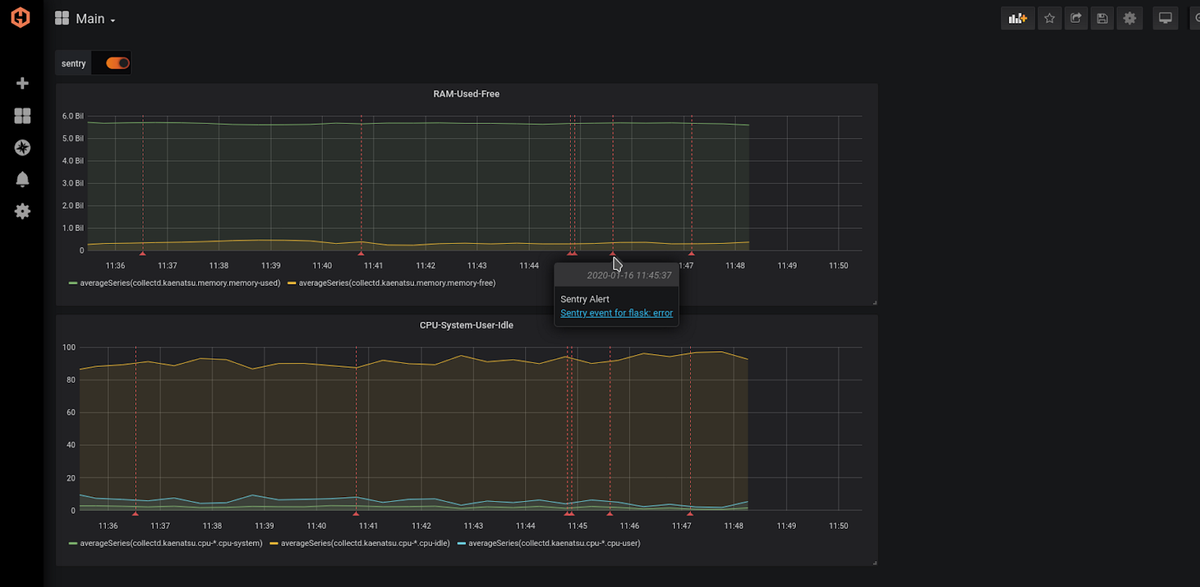
Annotations are useful for pinpointing rich events on a graph. When you have an annotation set up, it will enable you to simply hover over an annotation on the screen to see the important details.
Each annotation has the time, the date, tags, and a text field where you can fill in key information. Often, the text field is used to include links to relevant other systems that were involved in the event, such as Github or CircleCI.
Here is an example of an annotation made automatically from Sentry:
Adding annotations manually from the graph panel is quite seamless. You simply hold down Ctrl/Cmd and then click on the place you want to annotate. A window will pop up and you can fill in the blanks to make your annotation.
If you fill in a few tags, it will make your annotation searchable from your entire Grafana interface, even other dashboards. This helps bring together all relevant information when necessary.
You don’t have to annotate on just a single point, you can also annotate over an entire area of your graph. This is called a Region Annotation. To make a region annotation, just hold down Ctrl/Cmd, but instead of clicking, drag your cursor to highlight the area you want to annotate.
Built-In Querying
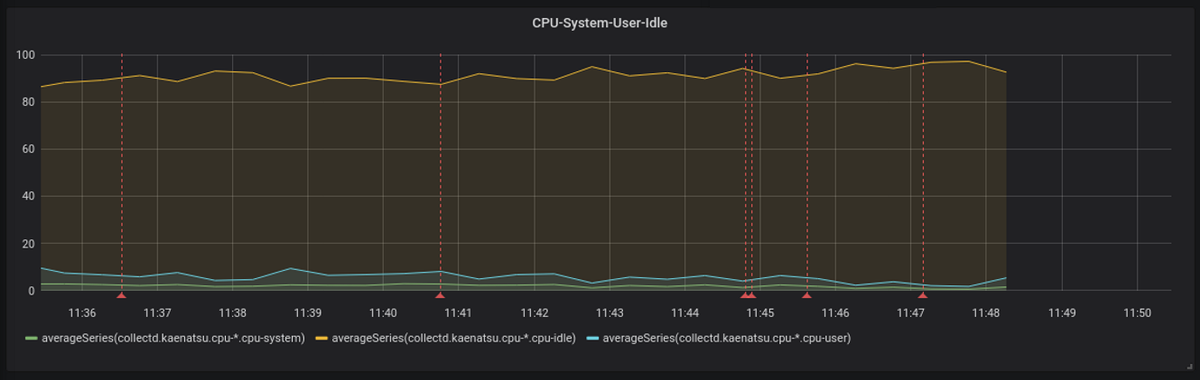
After you have added the annotation, it will stay visible. This is because there is a built-in query function that automatically searches and displays all annotations for the dashboard being viewed. This is one of the ways you can query and view your annotations.
The annotations are visible in the picture below as the orange vertical dotted lines with small arrows at their base:
It is possible to stop the annotations from being shown by opening the annotations settings. You can find it in the cogs menu on your dashboard. All you need to do is turn off the built-in annotations and alerts query in that menu, and your annotations will become invisible. At that point, to retrieve annotations you will have to search them by tag or by other details.
One note about copying dashboards - you can use the “save as” feature to copy a dashboard. Keep in mind that when you do this, the annotations will not be automatically copied over. The annotations will remain on the source dashboard only.
There is one workaround to get the same annotations to show on the new copied dashboard. This is done by adding an annotation query to your new dashboard with a “filter by tags”. It is important to know that this will work only if the annotations on the original source dashboard have tags that allow you to filter.
Querying by Tag
You can create new annotation queries that retrieve annotations from anywhere in your Grafana UI, this unified storage of annotations across dashboards is known as the “Grafana native annotation store”. Start your query, then indicate the “data source”, and set the “Filter by” option to “Tags”. Then you simply specify at least one tag. Here's an example:
- Create an annotation query name “holidays” and specify a tag named “holiday”.
- This query will show all annotations you create (from any dashboard or via API) that have the “holiday” tag.
By default, if you add more than one tag to an annotation query, Grafana will only display annotations that contain all of the tags that you have specified. You can make it so that Grafana will show any annotations that have any of the tags you specified. Just go to the annotations settings menu and specify “Match” as your filter method. This will make it so that Grafana will show annotations that have at least one of the annotations you queried.
Querying Other Data Sources
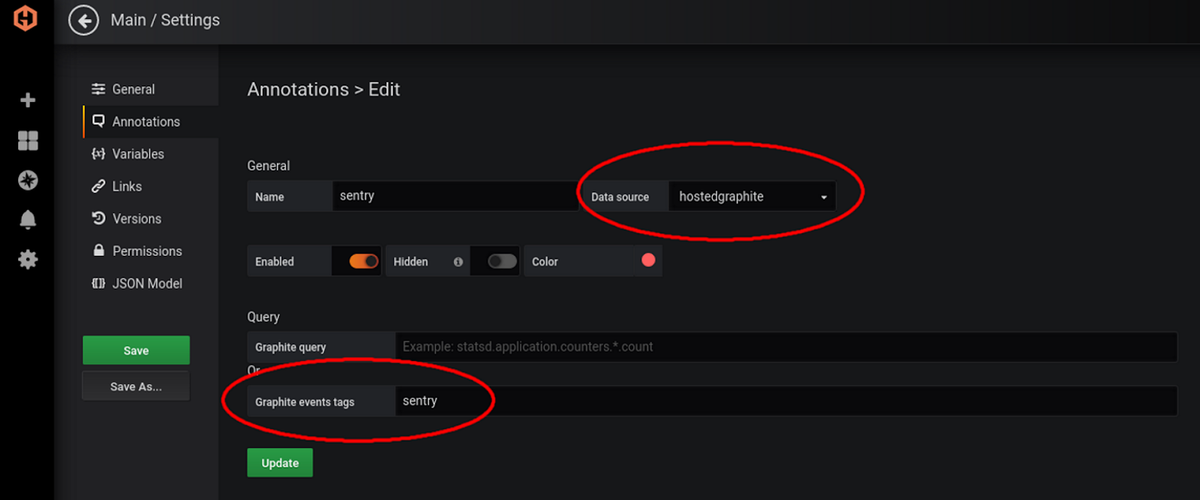
You can also query other data sources by opening the dashboard settings menu and selecting the annotations menu. On this menu viewer, you will be able to make new Annotations queries. You can set the name, the data source, and the tags for each annotation.
Here is an example of the annotations edit menu on MetricFire’s Hosted Grafana platform:
Automating Grafana Annotations
You can get various tools in your development environment to automatically publish annotations to your Grafana panels. Some of the most useful automation is for GitHub, CircleCI, and Sentry. Of course, there are many more plugins available for other automatic annotations.
In MetricFire, these plugins are already set up for you, so all you need to do is copy and paste your webhook into the appropriate text field of your account with the tool you’re using.
For example, to get GitHub to automatically publish annotations to your Grafana dashboards on the MetricFire platform, all you need to do is copy and paste your MetricFire webhook into this GitHub payload URL:
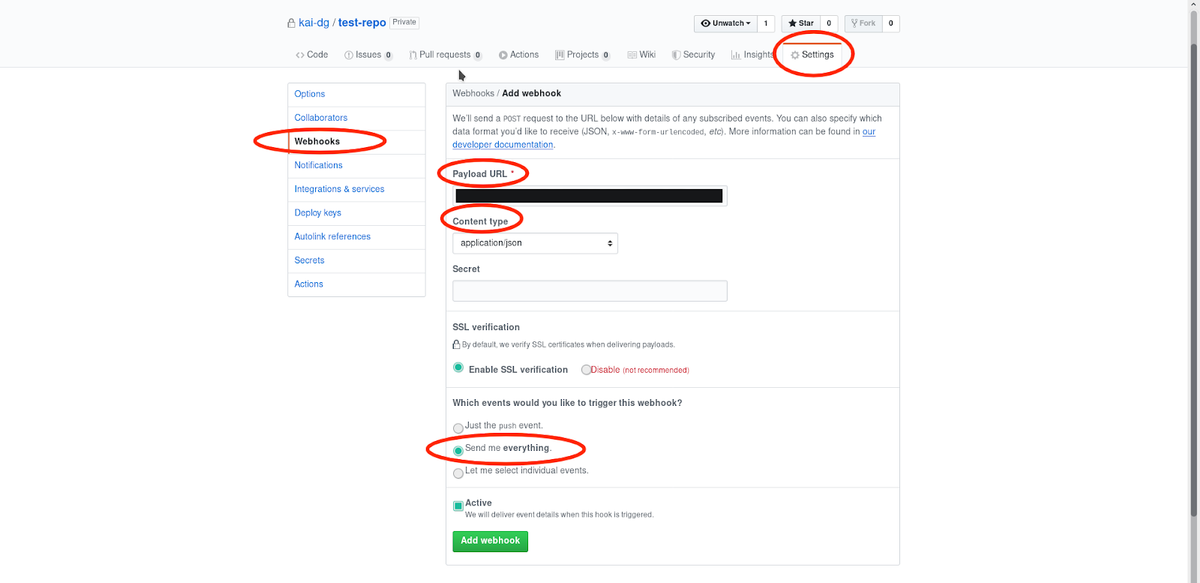
Then, whenever GitHub gets an update, such as a push or a merge, your related Grafana panels will be automatically populated with an annotation.
To read more about automating Grafana annotations, take a look at our articles here:
Summary and Conclusion
Annotations are pivotal for being able to navigate your monitoring stack. Sign up for the MetricFire free trial and build Grafana dashboards now. You can set up annotations within minutes, and integrate your dashboards with other tools. You can also book a demo and talk to the MetricFire team about how you can best monitor your traffic.
For more information on Grafana Tutorials, check out the MetricFire blog and our dedicated Grafana page.


