
Table of Contents
Great systems are not just built. They are monitored.
MetricFire runs Graphite and Grafana as a fully managed service for small engineering teams, taking care of storage, scaling, and version updates so your team doesn't have to. Plans start at $19/month, billed per metric namespace rather than per host, and include engineer-staffed support. Integrations work natively with Heroku, AWS, Azure, and GCP, and data is stored with 3× redundancy in SOC2- and ISO:27001-certified data centres.

Introduction
Using Prometheus and Grafana together is a great combination of tools for monitoring an infrastructure. In this article, we will discuss how Prometheus can be connected with Grafana and what makes Prometheus different from the rest of the tools in the market.
MetricFire's product, Hosted Graphite, runs Graphite (a Prometheus alternative) with Grafana dashboards for you so you can have the reliability and ease of use that is hard to get while doing it in-house. You can sign up for a MetricFire free trial here and start sending metrics to Graphite and Grafana.
Key Takeaways
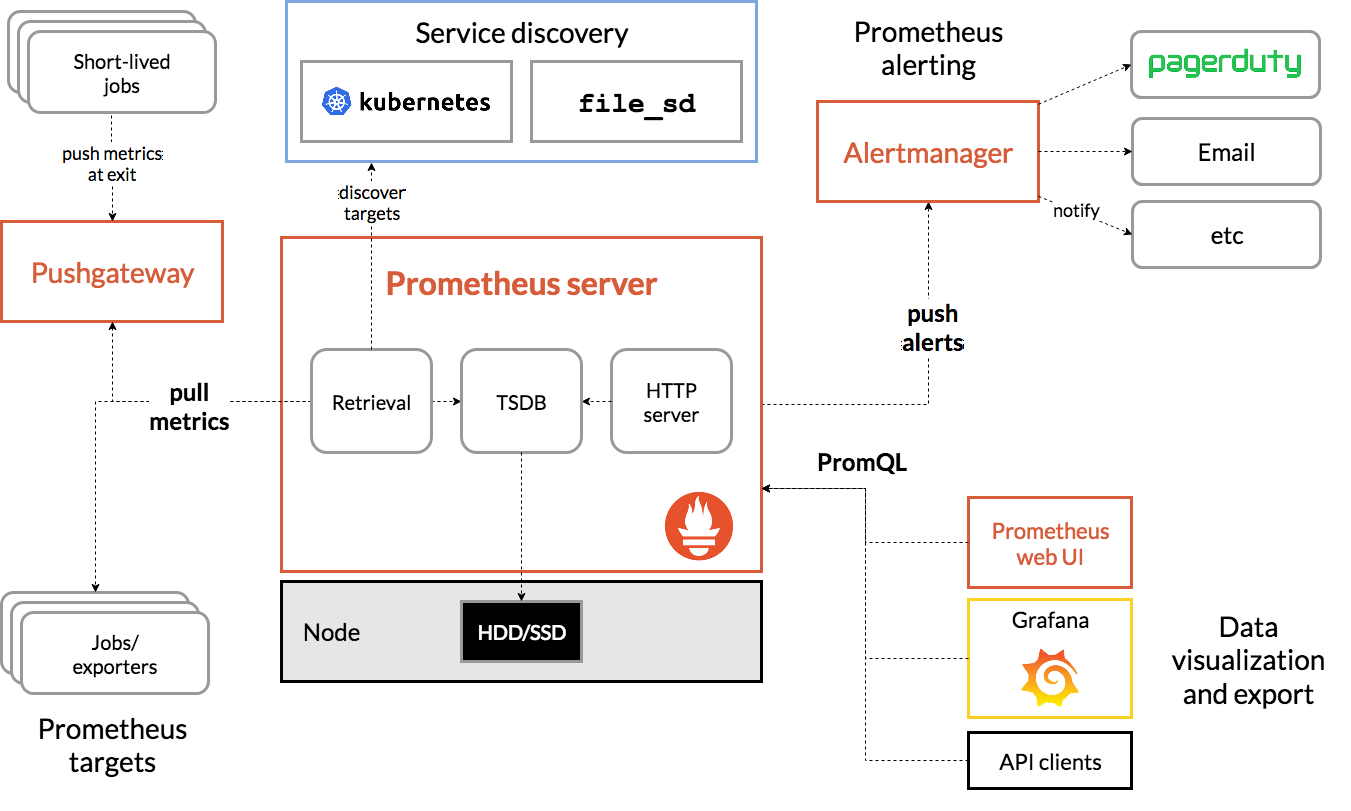
- Prometheus is an open-source monitoring tool with components like the Prometheus server, Push Gateway, Exporters, and Alertmanager.
- Grafana is a versatile visualization tool that can read data from various sources and offers multiple visualization options.
- This article demonstrates how to connect Prometheus with Grafana to visualize data from cAdvisor and Redis containers using Docker.
- Grafana is connected to Prometheus as a data source to visualize collected metrics, and a sample dashboard is created to display Redis container memory usage.
- The combination of Prometheus and Grafana provides a powerful solution for monitoring and visualizing infrastructure metrics.
Prometheus
Prometheus is an open-source alerting and monitoring tool developed by SoundCloud in 2012. Various components of Prometheus are:
- Prometheus server
- Push Gateway
- Exporters
- Alertmanager
The diagram below shows the architecture of Prometheus:
If you're interested in a more detailed introduction to Prometheus, we have great articles that explain Prometheus architecture and how to set up here:
Grafana
Grafana is a very versatile visualization tool. It is able to read data from a variety of data sources and plot with versatile visualization options such as graphs, gauges, world maps, heatmaps, etc. Start from the beginning in our article called Getting Started with Grafana.
Setup
In this section, we will visualize information from cAdvisor and Redis by processing the data using Prometheus, and then visualize it on Grafana. We will use docker to set up a test environment for Grafana and Prometheus. We will use the official docker images for Grafana and Prometheus available on Docker Hub. We will also need to use the docker images for cAdvisor and Redis. cAdvisor is a tool by Google that collects metrics about running containers and exposes the metrics in various formats, including Prometheus formatting. We will configure cAdvisor to collect metrics from the Redis container and visualize them in Grafana.
version: '3.2'
services:
 prometheus:
   image: prom/prometheus
   ports:
     - "9090:9090"
   volumes:
     - ./prometheus.yml:/etc/prometheus/prometheus.yml

 grafana:
   image: grafana/grafana
   ports:
   - "3000:3000"

 cadvisor:
   image: google/cadvisor:latest
   container_name: cadvisor
   ports:
   - 8080:8080
   volumes:
   - /:/rootfs:ro
   - /var/run:/var/run:rw
   - /sys:/sys:ro
   - /var/lib/docker/:/var/lib/docker:ro
   depends_on:
   - redis

 redis:
   image: redis:latest
   container_name: redis
   ports:
   - 6379:6379
We will also create a default prometheus.yml file along with docker-compose.yml. This configuration file contains all the configurations related to Prometheus. The config below is the default configuration that comes with Prometheus.
# my global config
global:
 scrape_interval:     15s # Set the scrape interval to every 15 seconds. Default is every 1 minute.
 evaluation_interval: 15s # Evaluate rules every 15 seconds. The default is every 1 minute.
 # scrape_timeout is set to the global default (10s).

# Alertmanager configuration
alerting:
 alertmanagers:
 - static_configs:
   - targets:
     # - alertmanager:9093

# Load rules once and periodically evaluate them according to the global 'evaluation_interval'.
rule_files:
 # - "first_rules.yml"
 # - "second_rules.yml"

# A scrape configuration containing exactly one endpoint to scrape:
# Here it's Prometheus itself.
scrape_configs:
 # The job name is added as a label `job=<job_name>` to any timeseries scraped from this config.
 - job_name: 'prometheus'

   # metrics_path defaults to '/metrics'
   # scheme defaults to 'http'.

   static_configs:
   - targets: ['localhost:9090']
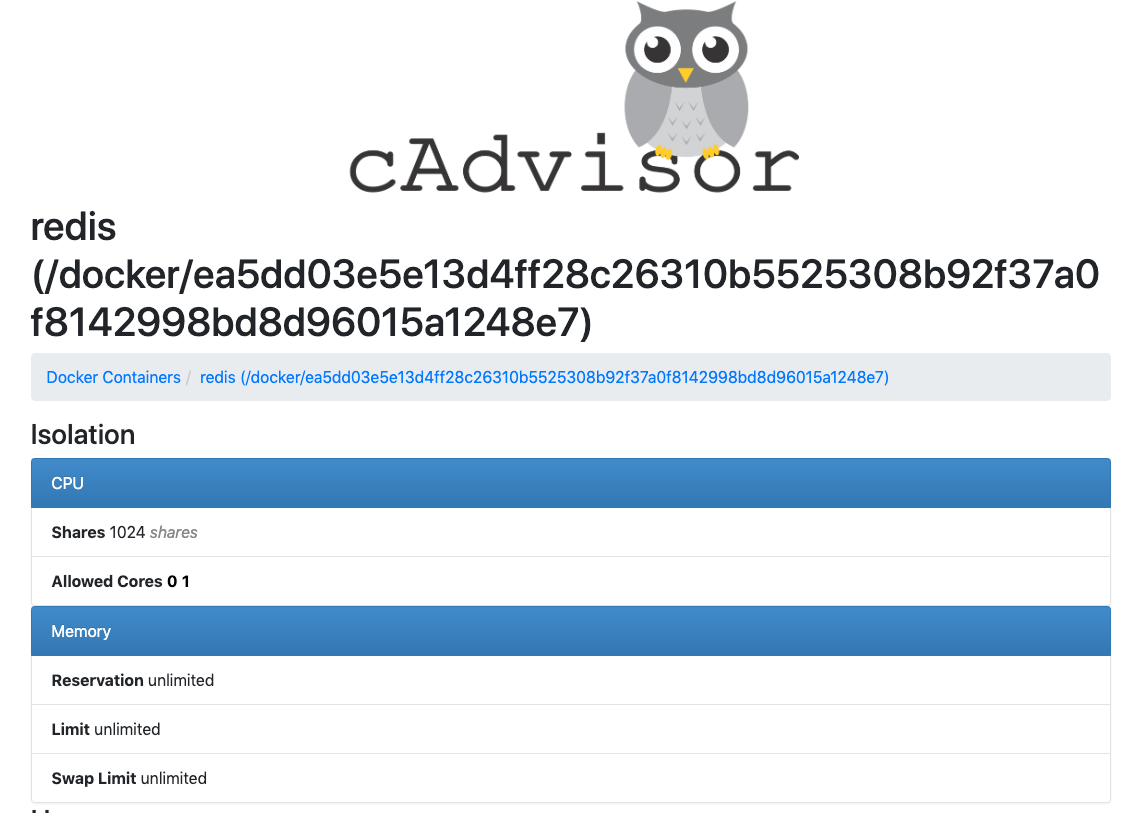
We can see the metrics of the Redis container by going to http://localhost:8080/docker/redis
The screenshot below shows the information that cAdvisor is able to collect from Redis.
Now these metrics from cAdvisor need to be fed into Prometheus. To do this we will modify the prometheus.yml as below:
global:
 scrape_interval:     15s # Set the scrape interval to every 15 seconds. Default is every 1 minute.
 evaluation_interval: 15s # Evaluate rules every 15 seconds. The default is every 1 minute.
 # scrape_timeout is set to the global default (10s).

# Alertmanager configuration
alerting:
 alertmanagers:
 - static_configs:
   - targets:
     # - alertmanager:9093

# Load rules once and periodically evaluate them according to the global 'evaluation_interval'.
rule_files:
 # - "first_rules.yml"
 # - "second_rules.yml"

# A scrape configuration containing exactly one endpoint to scrape:
# Here it's Prometheus itself.
scrape_configs:
 # The job name is added as a label `job=<job_name>` to any timeseries scraped from this config.
 - job_name: 'prometheus'

   # metrics_path defaults to '/metrics'
   # scheme defaults to 'http'.

   static_configs:
   - targets: ['localhost:9090']
  - job_name: 'cadvisor'
   static_configs:
   - targets: ['cadvisor:8080']
     labels:
       alias: 'cadvisor'
Note that we have added a new job called cAdvisor. Prometheus will now periodically pull the metrics from the cAdvisor. To reflect the changes in the Prometheus configuration file, we need to restart it with "docker-compose restart prometheus".
We should be able to see two jobs in Prometheus web UI at http://localhost:9090/targets. The screenshot below shows the two jobs, one for cAdvisor and the other for Prometheus itself.

Connecting to Grafana
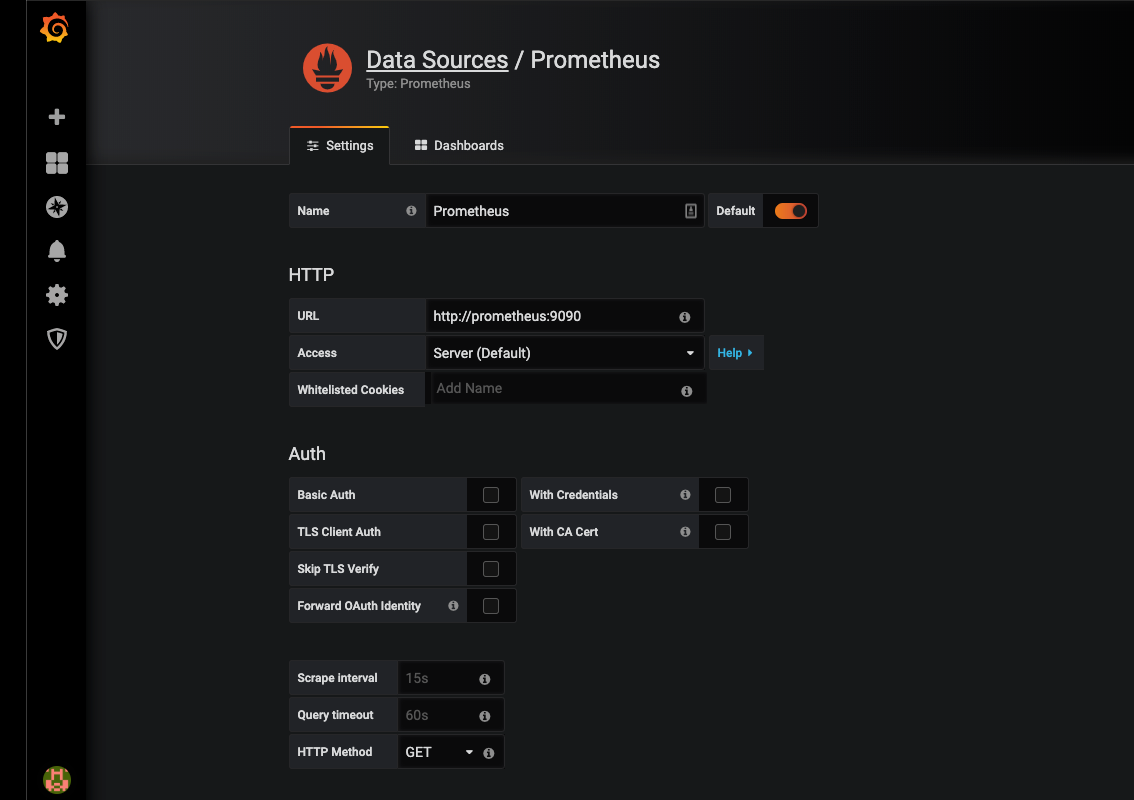
Now that we are able to feed our container metrics into Prometheus, it's time to visualize it in Grafana. Browse to http://localhost:3000 and log in using admin/admin and add the data source for Prometheus as shown below:
Note: the URL will be http://prometheus:9090 if you are using docker as described in this article. This is because we want Grafana to connect to Prometheus from the backend (where it says Access: Server) rather than the browser frontend. For the Grafana container, the location of Prometheus is http://prometheus:9090 and not http://127.0.0.1:9090 as you might expect.
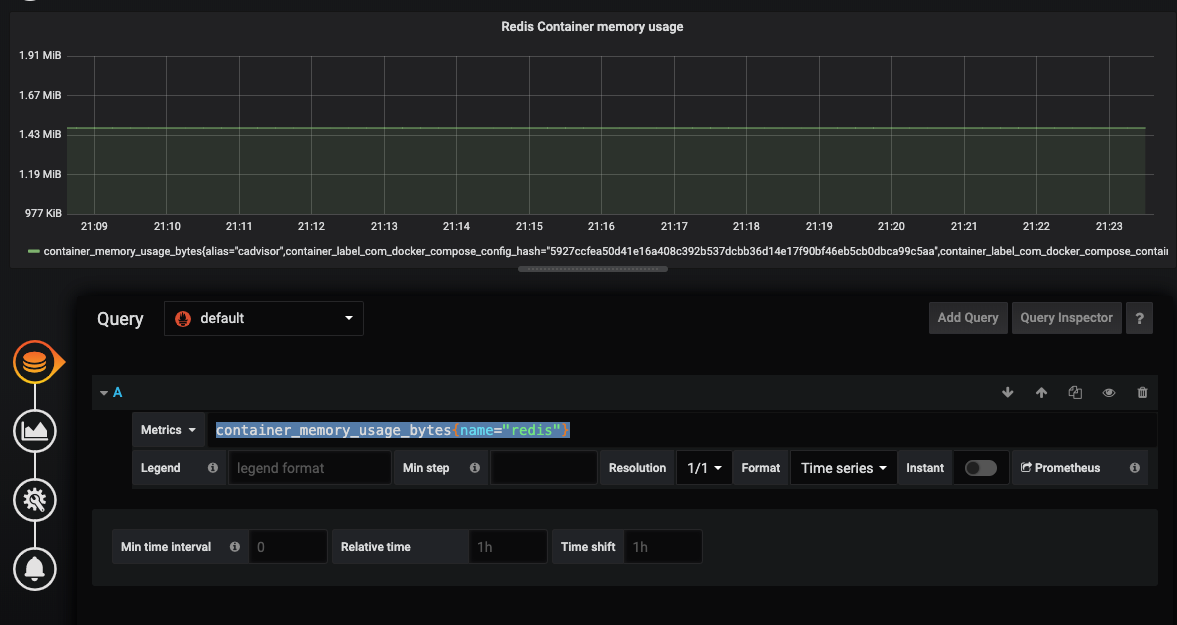
Now let’s create a simple Grafana dashboard and add a simple graph. This is fairly straightforward. The tricky part is configuring the data source and providing the query.
We will make a visualization of the Redis container memory usage from the Prometheus data source. In the query dropdown box, choose Prometheus as the data source and we will use container_memory_usage_bytes{name="redis"} as the metric as shown below:
Conclusion
We have seen that Grafana provides a seamless way to connect to the Prometheus data source and it provides great visualization through queries. If you aren't sure if Prometheus is the best option, try the MetricFire free trial, where you can use Graphite and Grafana right on our web platform. Also, book a demo and talk to us directly. We're always happy to talk about your company's monitoring needs.
This article was written by our guest blogger, Madhur Ahuja. If you're interested in his work, check out his Twitter for more!


