
Table of Contents
Great systems are not just built. They are monitored.
MetricFire runs Graphite and Grafana as a fully managed service for growing engineering teams, taking care of storage, scaling, and version updates so your team doesn't have to. Plans start at $19/month, billed per metric namespace rather than per host, and include engineer-staffed support. Integrations work natively with Heroku, AWS, Azure, and GCP, and data is stored with 3× redundancy in SOC2- and ISO:27001-certified data centres.
Introduction
Grafana is an open-source platform for monitoring and observability. It allows you to query, visualize, alert, and understand your metrics no matter where they are stored. Create, explore, and share dashboards with your team and foster a data-driven culture. This article will outline how to install Grafana on your own. If you're looking to try it out without much setup, or if you're looking for industrial-level service, start our free trial and get your dashboards up and running in minutes.
Key Takeaways
- Grafana is an open-source platform for monitoring and observability that allows you to query, visualize, alert, and understand metrics from various data sources.
- Grafana can be used to visualize machine resource utilization, monitor web application requests, track the health of platform components, and much more.
- You can install Grafana on various platforms, and the article demonstrates how to set it up using Docker with configuration options.
- Grafana introduces fundamental concepts like Data Sources (integrating data from third-party sources), Dashboards (combinations of visualization widgets), Alerts (notifying users about critical metrics), Plugins (extending Grafana's functionality), and User Management.
- Grafana provides an HTTP API for managing dashboards, importing pre-built dashboards for various tools, and ensuring easy administration.
But what do I use it for?
Grafana helps you visualize metrics, send alerts, and understand the metrics from various data sources with its plugin architecture. Let’s look at a few use cases. You can ...
- Visualize the machine’s CPU, memory, network, and other resource utilization with Prometheus and Grafana.
- Visualize and alert for a high number of incoming web requests in your web app.
- Monitor the health of the components of your platform like APIs, frontend apps, databases, etc.
And many more …
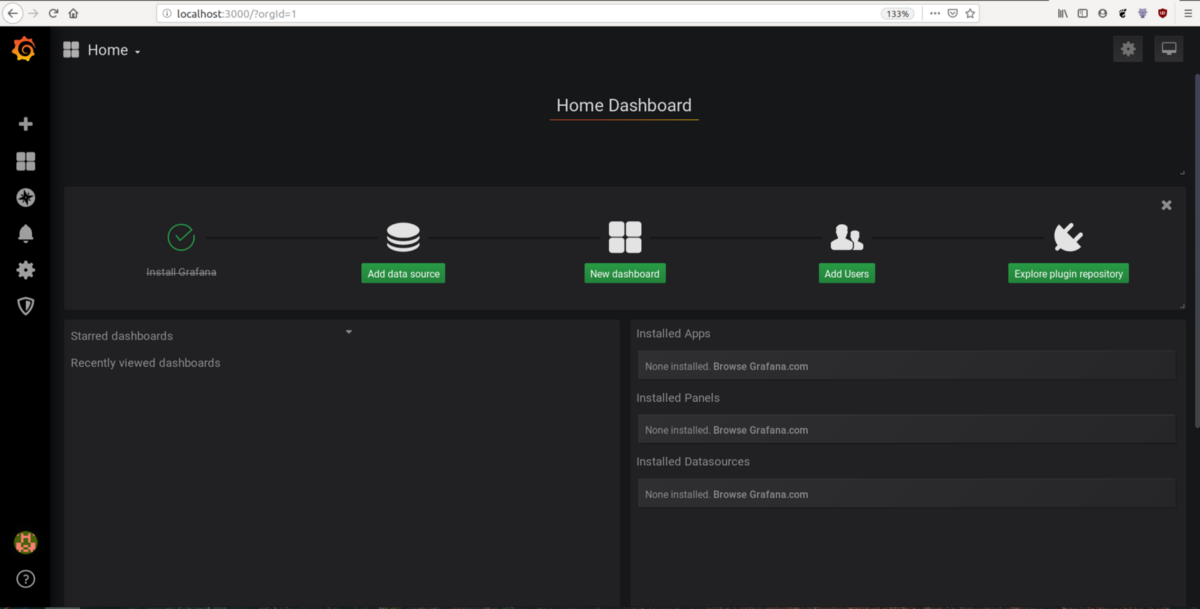
Get Grafana up and running
Grafana can be installed on various platforms using native packages. Here we will install it using Docker. Put GF_SECURITY_ADMIN_PASSWORD as the admin password you want to set at the time of installation (Don’t worry you can change it after the installation). Set GF_SERVER_ROOT_URL appropriately depending upon your reverse proxy or ingress configuration. A full configuration example can be found here.
docker run \
-d \
-p 3000:3000 \
--name=grafana \
-e "GF_SERVER_ROOT_URL=http://localhost:3000" \
-e "GF_SECURITY_ADMIN_PASSWORD=secret" \
grafana/grafana
For simplicity, we are setting it to localhost. After running the command above you can open http://localhost:3000 in your browser and log in with the username admin and password set above.
Understanding Grafana
Now that we have things up and running, let's understand the basic concepts of Grafana.
Data Sources
This is the most fundamental and important component responsible for pulling the data out of third parties like Prometheus, Elasticsearch, Cloudwatch, Graphite, InfluxDB, etc.
Dashboards and Widgets
A widget is a simple visualization panel for a single set of multiple metrics. There are many widgets like graphs, logs lists, tables, heatmaps, singlestat, and much more available through plugins.
A dashboard is a group of widgets, but it provides a lot more features like folders, variables (for changing visualizations throughout widgets), time ranges, and auto refresh of widgets.
Alerts
Grafana supports alerting on individual widgets based on rules defined by the user. Alerts can be sent to different channels, including Microsoft Teams, Slack, email, Webhooks, and PagerDuty.
Plugins
Plugins can be used to extend Grafana’s existing functionality or add new data sources and widget types, which makes Grafana really extensible. Check out the official plugin repository and instructions on how to install it.
Users
Grafana provides user management with user permissions like editor, viewer, or admin.
Creating your first dashboard on Grafana
Now that we know a bit about Grafana let’s create a dashboard on Grafana. For simplicity of not setting up more infrastructure, we will use TestData data source from Grafana.
Go to the plus icon on the left side of the homepage and create a dashboard with the name Test Data Dashboard. Add a new panel and add a query.
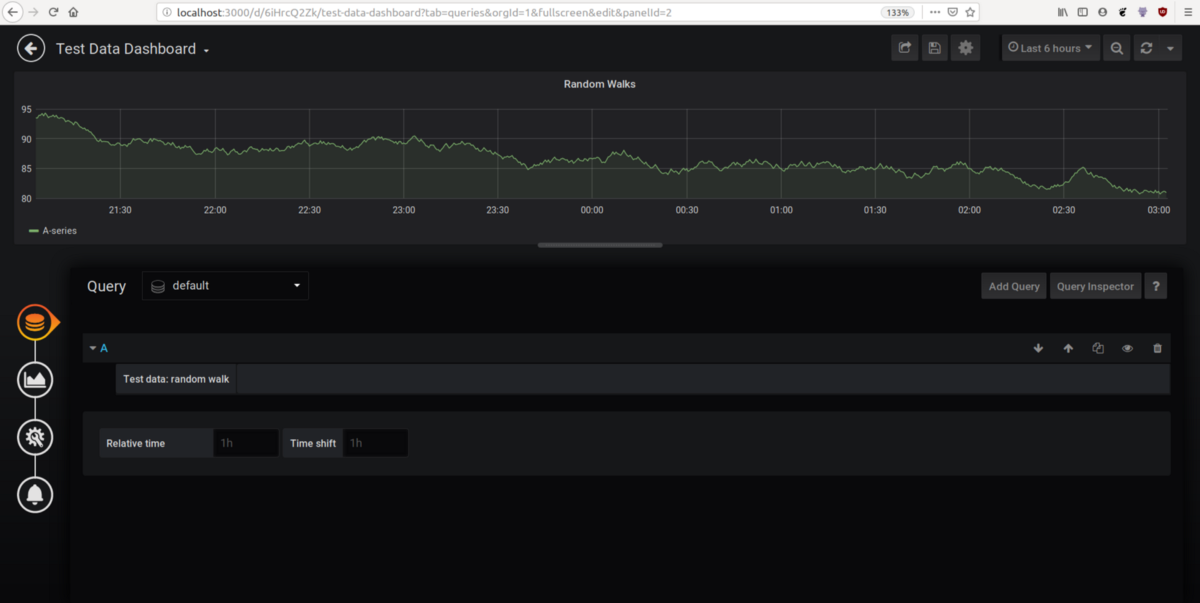
Click on the query icon on the left and add a default source (which is Grafana), it will add a random walk graph.
To customize the visualization click on the visualization icon and select graph type. There are several other options like line width, color, stacking etc. There are other types of visualizations such as Tables, Single Stats, Gauge etc.
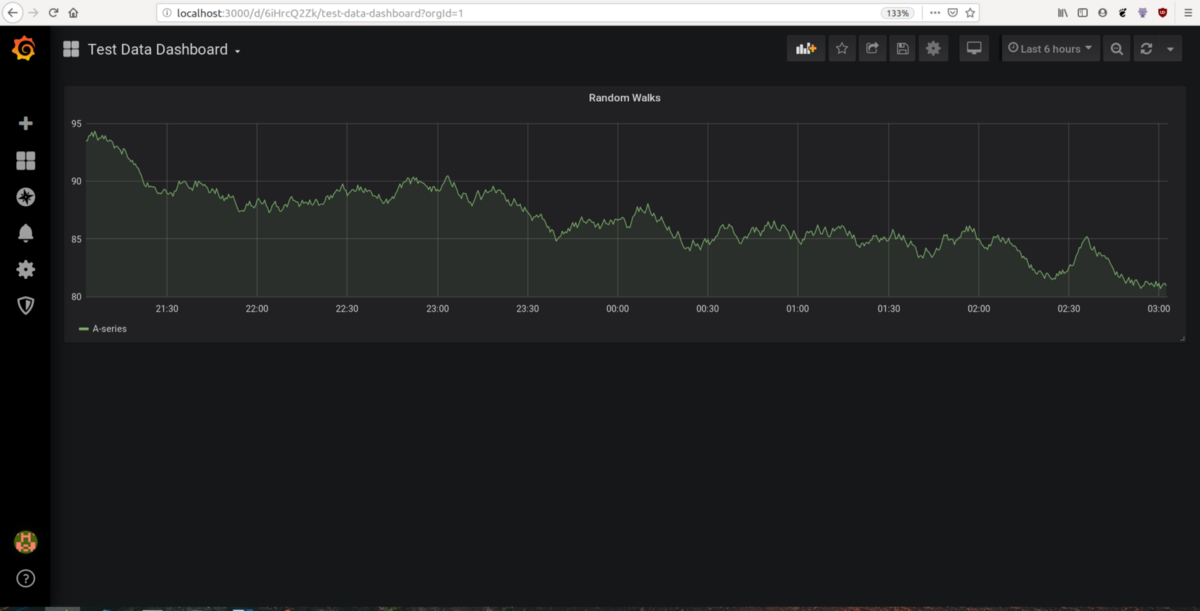
Save the graph. It should look something like below.
Setting up alerts
Visualizing metrics is really useful but nobody will be able to sit at a computer watching a dashboard 24/7!!! Alerts help to inform about critical metrics such as high memory usage.
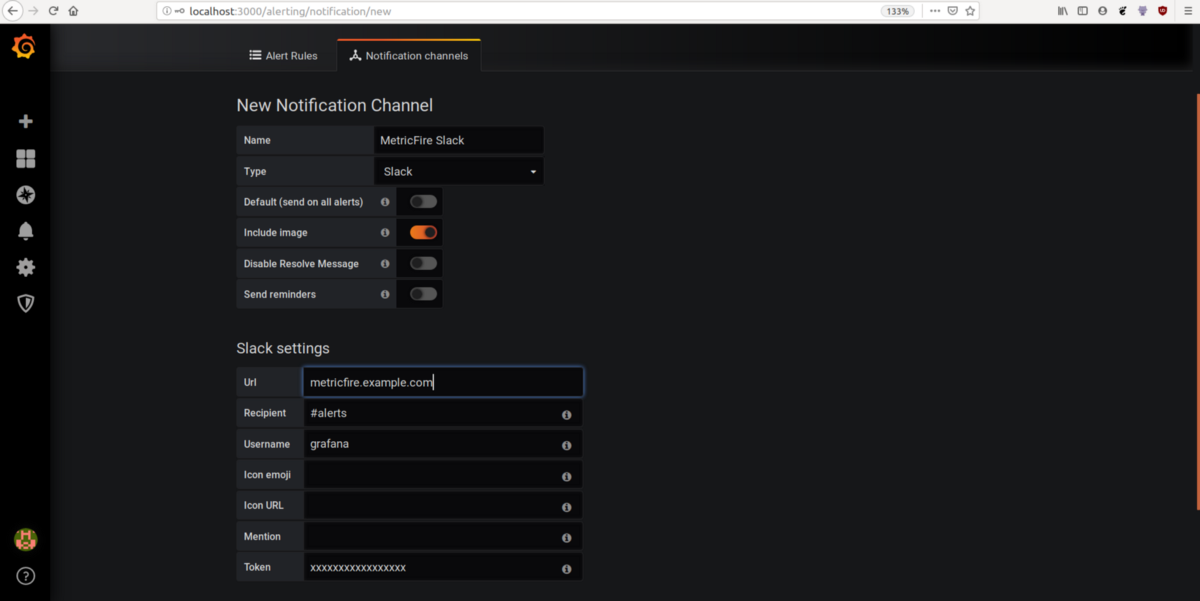
Let’s set up a Slack alert on the dashboard we just built. Click on Alerting on the homepage and go to notification channels and add a new notification channel for Slack, it requires credentials, a slack channel name, and a username.
PS: The Test Data Source of Grafana does not support alerting.
After setting up an alert destination we will go to the widget’s alert icon to setup the alerts.
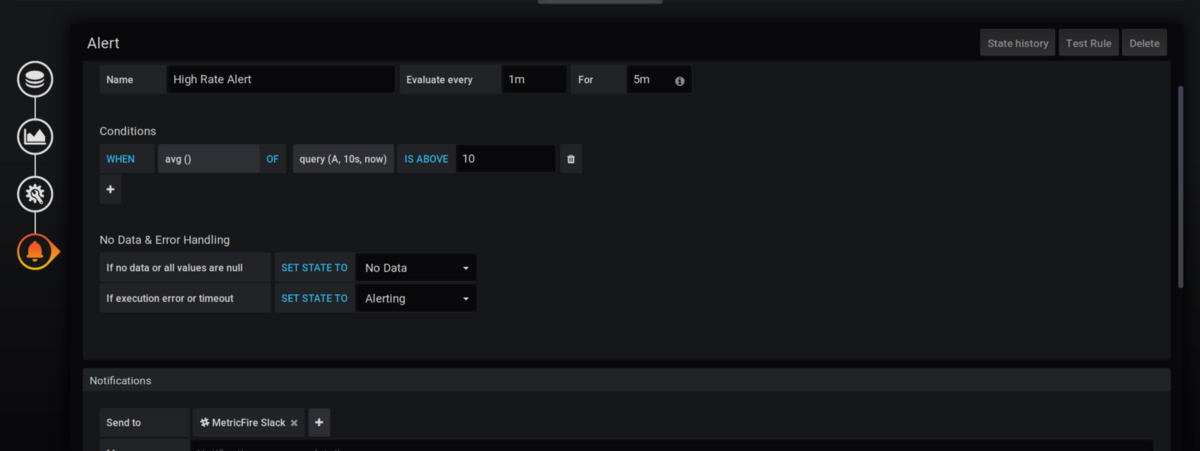
We will set up the condition, i.e. if the average value in a 1 min time range is greater than 10 it will fire the alert. We also select where these alerts should be sent to, in this case, it’s being sent to the Metricfire slack that we just added. There is a text field available to add any text that is related to these alerts, which can be added as a template.
Where to go from here
Congratulations!!! You have your first monitoring dashboard with Alerting set up. Now, there are lots of things we can explore further about Grafana!
Production setup
General production setup is done with either k8s or docker swarm for high availability since this is critical to monitoring.
A k8s deployment can be done via prometheus operator’s helm chart. This deploys a complete prometheus + Grafana stack with pre-built k8s monitoring dashboards and alerts.
Common Patterns
Grafana + Prometheus = ❤️. This is the most common combination for metrics reporting and alerting. Grafana is a great visualization tool but it doesn’t do data persistence, so Prometheus is generally used to collect metrics and Grafana operates on Prometheus. Prometheus is built for making a vast variety of metrics reports for different sources, and for collecting and storing metrics. Read more on our Prometheus Monitoring 101 page.
One general pattern for monitoring stacks is monitoring k8s clusters with the prometheus operator stack and monitoring AWS resources with the Cloudwatch data source.
Plugins
Plugins are one of the most powerful features of Grafana. It has a huge repository of community-built data sources and widgets which extends Grafana in a great way.
Administration
Grafana provides an HTTP API to get the dashboards in JSON format. These dashboards can be created again by supplying the payload stored as backup. These dashboards can also be imported through Grafana web UI. Many third-party pre-built dashboards for tools like Elasticsearch, Airflow, and k8s are available which can be imported this way as well.
Get to know our Grafana as a Service better, and check out how MetricFire can fit into your monitoring environment. Get a free trial and start making Grafana dashboards now. Feel free to book a demo if you have questions about what Grafana can do for you.


