

Table of Contents
- Introduction
- Why is Heroku Postgres monitoring important?
- Benefits of using Hosted Graphite for Heroku Postgres monitoring
- Setting up Hosted Graphite with Heroku Postgres
- Key metrics to monitor in Heroku Postgres
- Optimizing Heroku Postgres performance using Hosted Graphite
- Best practices for Heroku Postgres monitoring
- Conclusion
Great systems are not just built. They are monitored.
MetricFire runs Graphite and Grafana as a fully managed service for growing engineering teams, taking care of storage, scaling, and version updates so your team doesn't have to. Plans start at $19/month, billed per metric namespace rather than per host, and include engineer-staffed support. Integrations work natively with Heroku, AWS, Azure, and GCP, and data is stored with 3× redundancy in SOC2- and ISO:27001-certified data centres.
Introduction
When it comes to managing your database, monitoring is crucial for maintaining data integrity, optimizing performance, and ensuring efficient resource allocation. In today's fast-paced technological landscape, having real-time insights into your database's health is more important than ever. This is where Heroku Postgres and Hosted Graphite come into the picture.
With Heroku Postgres, you can say goodbye to the complexities of setting up and maintaining your own database infrastructure. It provides a fully managed, secure, and highly available environment, allowing you to focus on building your applications instead of worrying about database management. Whether you are running a small startup or managing enterprise-level applications, Heroku Postgres offers a range of plans to suit your needs. However, simply deploying your database on Heroku Postgres is not enough. To harness the full potential of this service, you need to closely monitor its performance, detect any issues proactively, and make data-driven decisions to optimize its usage. This is where Hosted Graphite steps in as a game-changer.
Hosted Graphite allows you to gather and visualize important metrics from your Heroku Postgres instance, providing you with invaluable insights into its performance. But it doesn't stop at visualization. Hosted Graphite takes monitoring a step further by offering alerts and notifications. Set up thresholds for critical metrics, and receive instant notifications via email, SMS, or integrations with popular collaboration tools like Slack. This proactive approach enables you to address potential issues before they escalate, ensuring smooth operations for your applications. For teams managing complex data pipelines alongside their databases, Integrate.io offers complementary capabilities, providing low-code ETL and ELT data integration to ensure your data flows seamlessly across databases, APIs, and data warehouses. Historical data analysis is another powerful feature provided by Hosted Graphite. By storing historical metrics data, you can identify trends, track performance over time, and make informed decisions based on historical patterns. This long-term perspective allows you to fine-tune your database configuration, optimize queries, and allocate resources more efficiently.
Why is Heroku Postgres monitoring important?
Heroku Postgres is a powerful database service provided by Heroku for application developers. It offers a range of benefits such as scalability, easy integration, and data durability. However, to fully harness the potential of Heroku Postgres, it is crucial to monitor its performance and ensure its smooth operation. This is where Heroku Postgres monitoring becomes important.
Data integrity is one of the key reasons why monitoring Heroku Postgres is essential. As applications interact with the database, it is crucial to ensure that data is being stored, retrieved, and modified accurately. Monitoring allows you to detect any discrepancies or inconsistencies in the data, helping you maintain the integrity of your application's information. Performance optimization is another significant aspect that can be achieved through effective monitoring. By tracking key metrics like query response time and connection count, you can identify bottlenecks and optimize your database's performance. This ensures that your application runs smoothly and provides a seamless user experience.
Issue detection is yet another critical benefit of monitoring Heroku Postgres. With a proactive monitoring system in place, you can identify and address potential issues before they escalate into major problems. This helps in preventing application downtime or data loss, saving both time and resources.
Resource allocation is optimized through monitoring as well. By monitoring disk usage and cache hit ratios, you can identify areas where resources are underutilized or overburdened. This enables you to make informed decisions about scaling up or down, ensuring efficient resource allocation and cost optimization.
Benefits of using Hosted Graphite for Heroku Postgres monitoring
Hosted Graphite offers a range of benefits that make it an ideal choice for monitoring your Heroku Postgres database. With its powerful features and user-friendly interface, Hosted Graphite empowers you to take control of your monitoring process and gain valuable insights into the performance of your database.
One of the key advantages of using Hosted Graphite is its real-time visualization capabilities. This feature allows you to view your data in real time, providing instant access to critical metrics and enabling you to identify any anomalies or issues as they occur. By visually representing your Heroku Postgres data, Hosted Graphite helps you quickly understand the health and performance of your database, making it easier to make informed decisions and take proactive measures to optimize its performance.
Another standout feature of Hosted Graphite is its customizable dashboards. With this functionality, you can create tailored dashboards that display the specific metrics and data points that matter most to you. Whether you want to monitor query response times, disk usage, or cache hit ratios, Hosted Graphite allows you to design personalized dashboards that provide you with the exact information you need at a glance. This level of customization ensures that you can focus on the metrics that are most relevant to your business and easily track the performance of your Heroku Postgres database.
Collaboration is also made easy with Hosted Graphite. Multiple team members can access the monitoring platform simultaneously, enabling effective collaboration and fostering a culture of shared responsibility. Whether your team consists of developers, database administrators, or operations personnel, Hosted Graphite provides a central hub where everyone can access and analyze the same monitoring data. This collaborative environment promotes efficient problem-solving and facilitates cross-functional communication, leading to faster issue resolution and improved overall performance.
Setting up Hosted Graphite with Heroku Postgres
When it comes to monitoring Heroku Postgres, integrating with a reliable and efficient tool like Hosted Graphite is crucial. In this section, we will delve into the installation process, configuration steps, and integration guidelines to help you seamlessly set up Hosted Graphite with your Heroku Postgres database.
To get started with Hosted Graphite, you can just install the hostedgraphite add-on in your Heroku application. This will create a new HG account for you, provide you with a unique API key, and pull data directly from your Heroku Log Drains:
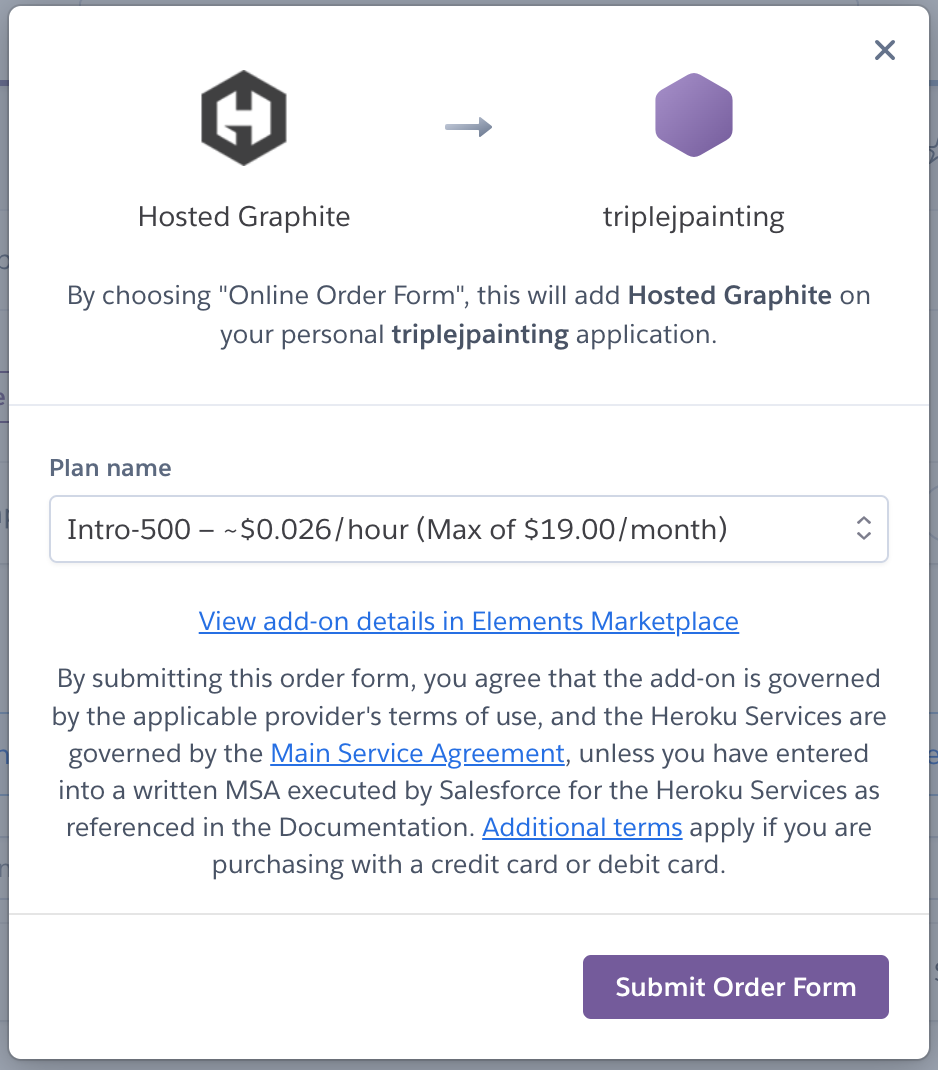
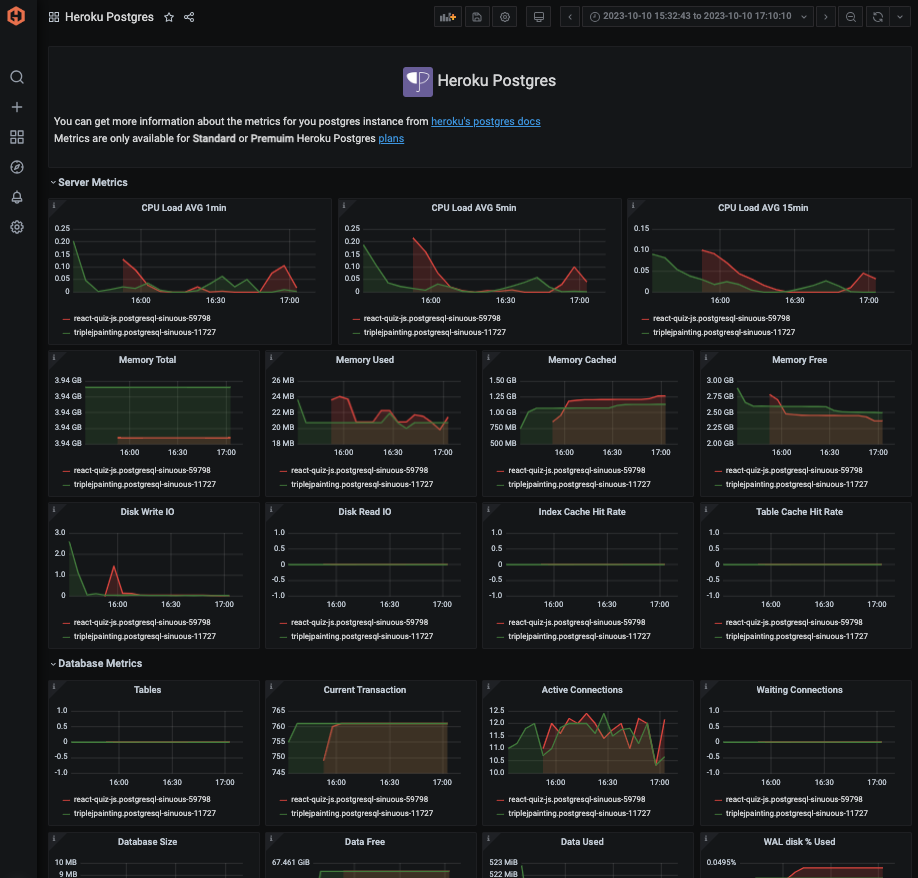
If you use a Heroku Postgres add-on at the Standard/Premium plan level or above, DB metrics will automatically be forwarded to your Hosted Graphite account. You can then use the Graphite metrics stored with HG to create custom dashboards and alerts. We also provide a convenient Heroku Postgres dashboard in our Dashboard Library:
To achieve a smooth integration between Hosted Graphite and Heroku Postgres, follow these guidelines:
-
Define your monitoring goals: Clearly identify the key performance indicators (KPIs) and metrics that are critical to your application's success. This will help you focus on monitoring the right aspects of your Heroku Postgres database.
- Add the Hosted Graphite Heroku Add-On and use your Hosted Graphite API Key to send metric data to the service. If you use the Postgres add-on in your Heroku app (at the Standard or Premium plan level), these metrics will automatically be sent to your Hosted Graphite account. They are prefixed with heroku.<name-of-app>.heroku-postgres and also report dyno statistics for load and memory. Additionally, you will receive more specific database metrics such as db_size, tables, active/waiting connections, tmp-disk-available/used, read/write-iops, and more!
-
Use the collected Graphite metrics to build custom dashboards: we provide a Hosted Grafana environment for your visualizations, and there is no limit to the number of dashboards you can build.
-
Set up alerts and notifications: Configure alerts and notifications within Hosted Graphite to receive immediate notifications when specific thresholds are breached. This allows you to take proactive actions and address potential issues before they escalate.
-
Collaborate effectively: Leverage Hosted Graphite's collaboration features to involve your team members in the monitoring process. Assign responsibilities, share dashboards, and encourage collaboration to ensure everyone stays informed and can contribute to maintaining the health of your Heroku Postgres database.
By following these installation steps, configuration guidelines, and integration best practices, you can maximize the benefits of using Hosted Graphite for monitoring your Heroku Postgres database. With real-time visualization, customizable dashboards, and a comprehensive set of metrics, you will gain valuable insights into the performance and health of your database system, empowering you to make data-driven decisions to optimize your application's performance.
Key metrics to monitor in Heroku Postgres
When it comes to monitoring your Heroku Postgres database, keeping an eye on key metrics is crucial for ensuring optimal performance and identifying any potential issues. By regularly tracking these metrics, you can gain valuable insights into the health and efficiency of your database. In this article, we will explore five key metrics that you should monitor in Heroku Postgres and understand their significance.
- Connection Count: Monitoring the number of active connections to your Heroku Postgres database is essential for maintaining performance and preventing resource bottlenecks. High connection counts can indicate a heavy workload or inefficient connection pooling, while low counts may suggest potential issues with connecting to the database.
For example, if you notice a sudden spike in connection count during peak hours, it could be an indication that your application is experiencing increased traffic and you might need to scale up your resources accordingly.
- Batch Queries: Batch queries refer to executing multiple SQL queries together as a single batch. Monitoring the frequency and performance of batch queries can help optimize database operations by reducing the number of round trips made between the application and the database server.
By analyzing the execution time and the number of batch queries, you can identify opportunities to optimize your code and improve overall query performance. For instance, if you observe long execution times for batch queries, it might be worth considering rewriting or optimizing those queries for better efficiency.
- Cache Hit Ratio: The cache hit ratio measures the effectiveness of your database's caching mechanism. It represents the percentage of queries that are served from the cache instead of hitting the disk storage. A higher cache hit ratio indicates efficient cache utilization and can significantly improve the performance of read-heavy applications.
By monitoring the cache hit ratio, you can identify if your database is properly configured and whether adjustments are needed. For example, a low cache hit ratio may suggest that certain tables or indexes should be added to the cache configuration to improve performance.
- Disk Usage: Monitoring the disk usage of your Heroku Postgres database is crucial for ensuring sufficient storage capacity and preventing unexpected downtime. Regularly tracking disk usage allows you to identify trends, predict future growth, and take necessary actions to ensure uninterrupted operation.
By setting up proper alerts based on predefined thresholds, you can receive notifications when disk usage reaches critical levels. This proactive approach enables you to allocate additional storage or optimize data storage strategies in a timely manner.
- Query Response Time: Monitoring the response time of your queries provides insights into the overall performance of your Heroku Postgres database. By measuring the time taken for queries to execute and return results, you can identify slow-performing queries and take steps to optimize them.
Tracking query response time allows you to detect any bottlenecks that may be affecting your application's performance. For instance, if a specific query consistently shows high response times, you can investigate further and optimize the query by adding appropriate indexes or rewriting it to improve efficiency.
Optimizing Heroku Postgres performance using Hosted Graphite
Heroku Postgres is a powerful database service that offers scalability, reliability, and ease of use for developers. However, like any database, it requires careful monitoring and optimization to ensure optimal performance. In this article, we will explore how you can leverage the capabilities of Hosted Graphite to optimize the performance of your Heroku Postgres database.
One of the first steps in optimizing your Heroku Postgres performance is identifying bottlenecks. Bottlenecks are areas where the performance of your database is being hindered, and they can occur in various aspects of your application. With Hosted Graphite, you can track key metrics such as connection count, batch queries, cache hit ratio, disk usage, and query response time. By monitoring these metrics, you can pinpoint the specific areas that are causing performance issues and take appropriate action.
Once you have identified the bottlenecks, the next step is tuning queries. Query optimization plays a crucial role in improving the overall performance of your Heroku Postgres database. With Hosted Graphite, you can analyze query execution times, identify slow-running queries, and optimize them for better performance. By fine-tuning your queries, you can significantly reduce response times and improve the efficiency of your application.
Query optimization is an ongoing process, and with Hosted Graphite, you can continuously monitor and optimize your queries. By regularly analyzing query performance and making necessary adjustments, you can keep your Heroku Postgres database running smoothly and efficiently.
Best practices for Heroku Postgres monitoring
Regular monitoring schedules, setting realistic thresholds, continuous improvement, and monitoring security are essential best practices for effectively monitoring Heroku Postgres. By following these practices, you can ensure the optimal performance and stability of your database, as well as identify and resolve any potential issues in a timely manner.
Setting realistic thresholds is another crucial aspect of effective monitoring. It involves defining acceptable ranges or limits for various metrics based on your application's requirements and performance expectations. By establishing these thresholds, you can receive alerts or notifications whenever a metric exceeds or falls below the defined limits. For instance, you can set thresholds for the cache hit ratio or batch queries to ensure efficient utilization of resources and optimal performance.
Monitoring security is of utmost importance when it comes to Heroku Postgres. Safeguarding sensitive data and ensuring compliance with relevant regulations should be a top priority. Monitoring security involves tracking access patterns, analyzing query logs, and implementing robust security measures such as encryption and authentication protocols. By closely monitoring security-related metrics, you can quickly detect any unauthorized access attempts or suspicious activities and take appropriate actions to mitigate potential risks.
Conclusion
When it comes to monitoring your Heroku Postgres database, Hosted Graphite emerges as a powerful tool that enables you to make data-driven decisions with confidence. By leveraging the capabilities of Hosted Graphite, you can gain valuable insights into your database's performance, identify potential issues, and optimize its overall efficiency.
By analyzing key metrics such as connection count, batch queries, cache hit ratio, disk usage, and query response time, you can gain a deep understanding of how your database is performing. This knowledge empowers you to make informed decisions regarding resource allocation, query optimization, and scaling measures.
In conclusion, Heroku Postgres monitoring using Hosted Graphite offers an invaluable opportunity to gain insights into your database's performance, optimize its efficiency, and make data-driven decisions. By leveraging the power of real-time visualization, customizable dashboards, alerts, collaboration features, and historical data analysis, you can ensure the smooth operation of your application and deliver an exceptional user experience. Trust in Hosted Graphite to monitor your Heroku Postgres database and unlock its full potential. The monitoring of Heroku Postgres using Hosted Graphite offers a range of benefits that are essential for maintaining data integrity, optimizing performance, and detecting any potential issues. By leveraging real-time visualization, customizable dashboards, and alerts, Heroku users can gain valuable insights into their database environment. Collaborative features and historical data analysis further enhance the monitoring experience.

