
Table of Contents
Great systems are not just built. They are monitored.
MetricFire runs Graphite and Grafana as a fully managed service for growing engineering teams, taking care of storage, scaling, and version updates so your team doesn't have to. Plans start at $19/month, billed per metric namespace rather than per host, and include engineer-staffed support. Integrations work natively with Heroku, AWS, Azure, and GCP, and data is stored with 3× redundancy in SOC2- and ISO:27001-certified data centres.
What is Graphite?
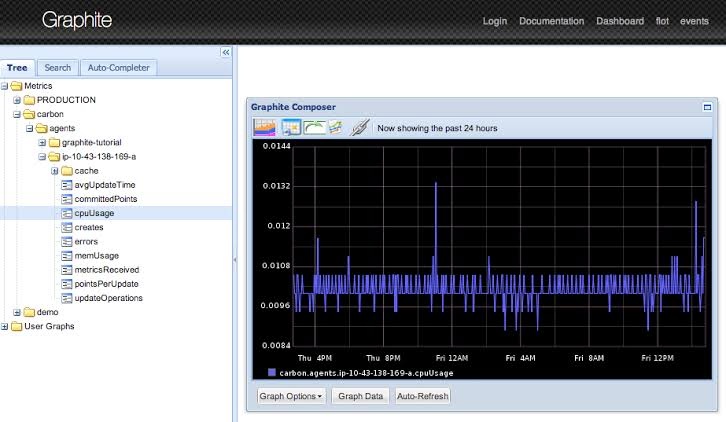
Graphite is an open-source time-series monitoring software that was first released in 2008. It’s a push-based monitoring software, which means that it collects metrics by taking information that is already being expressed, then recording and visualizing it. Graphite usually works together with StatsD or collectd to pull the time-series metrics from an infrastructure. The metrics are then aggregated and stored in Graphite’s database, Whisper. Graphite provides companies with the ability to monitor, store, and visualize data, as well as alert on specific events. Hosted Graphite is available through MetricFire, with Hosted Grafana included in the package.
Get our free trial and start using Hosted Graphite in minutes. You can see if MetricFire is the right fit for you. If you have any questions, you can always book a demo and talk to us directly.
What is Zabbix?
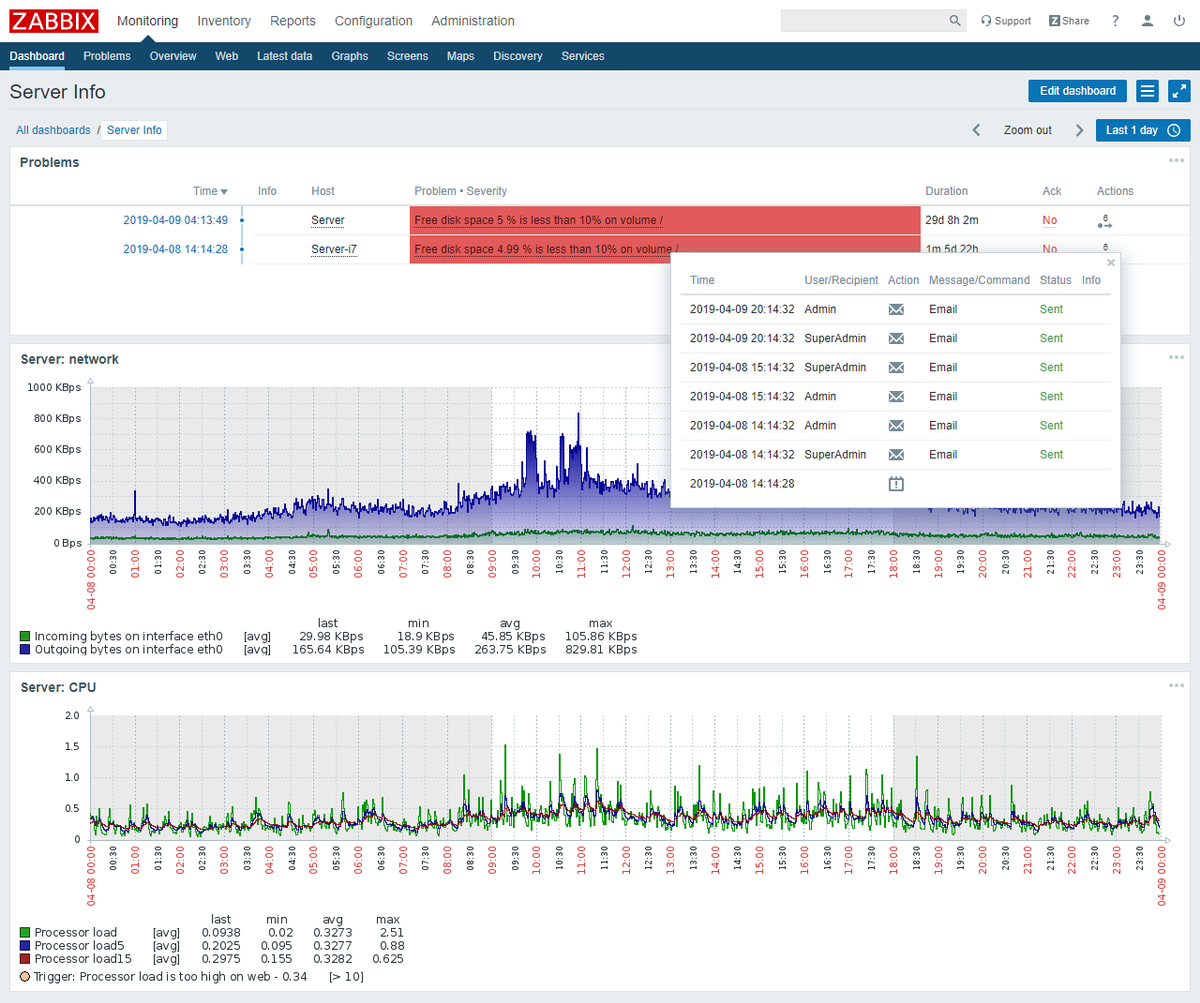
Zabbix is an open-source monitoring tool for IT systems such as networks, servers, virtual machines, and cloud services. Zabbix can collect metrics, detect problems, visualize, notify, and send notifications. There is also functionality for app monitoring. Zabbix is designed for small-scale environments, from anywhere from a few devices to a thousand. Zabbix also allows for easy distributed monitoring, where you can keep the connection and open port count low. Some large-scale installations have been made, but they require a lot of optimization. Zabbix doesn’t store data itself, but it can use a broad range of databases, and for organizations that need to integrate this monitoring data with other systems, solutions like Integrate.io provide low-code ETL and data transformation capabilities to connect monitoring data across databases, APIs, and data warehouses. Zabbix’s backend is written in C and the web frontend is in PHP. Zabbix as a Service is available through the Zabbix website, and there are 5 stages for pricing.
When to use Hosted Graphite by MetricFire?
Use MetricFire when you …
- need time-series monitoring for infrastructure.
- need to visualize data from multiple different sources.
- need alerting on key events.
- need a hosted service because your infrastructure is too large to do it by yourself.
When to use Zabbix?
Use Zabbix when you …
- need an open-source software with a C backend, and PHP front end.
- you want to use MySQL, MariaDB, PostgreSQL, SQLite, Oracle, or IBM DB2 to store data.
- you have a small-scale business, with less than 1000 devices.
- need monitoring, but not necessarily great visualization/support documentation.
Pricing comparison
- Graphite is open source, and free.
- Business-ready Graphite as a Service by MetricFire, including Hosted Prometheus and Grafana, starts at 99 USD a month.
- Zabbix is open source and free.
- Zabbix Enterprise is available through Zabbix.
Key takeaways
- Graphite can monitor, store, alert and visualize time-series data of all kinds.
- Graphite is open source, and free.
- Zabbix is open source and free.
- Zabbix Enterprise proprietary products do not offer the dashboarding capabilities of Grafana.
Get to know our MetricFire better, and check out how MetricFire can fit into your monitoring environment! Get a free trial and start using Graphite now. Feel free to book a demo and see what MetricFire can do for you.


