
Table of Contents
Great systems are not just built. They are monitored.
MetricFire runs Graphite and Grafana as a fully managed service for growing engineering teams, taking care of storage, scaling, and version updates so your team doesn't have to. Plans start at $19/month, billed per metric namespace rather than per host, and include engineer-staffed support. Integrations work natively with Heroku, AWS, Azure, and GCP, and data is stored with 3× redundancy in SOC2- and ISO:27001-certified data centres.

Introduction
Flask is a widely used Python framework for building simple web applications, as well as being popular for REST APIs. If your Flask application has a lot of requests and is sensitive to request delays, it is essential to keep track of its metrics. Monitoring Flask with Prometheus is the perfect tool for this. When used in combination with Grafana, it can help make your app’s metrics easier to understand.
In this article, we are going to create a simple demo application to show you how to monitor Flask apps and give you an idea of how a third-party Python library simplifies the process.
MetricFire also offers a 14 day free trial of Hosted Graphite, you can even book a demo with us and get started on your monitoring needs!
Key Takeaways
- Flask is a popular Python framework for web applications and REST APIs, and it's essential to monitor its metrics if your application receives many requests and is sensitive to delays.
- Monitoring Flask applications with Prometheus, when combined with Grafana, makes it easier to understand your app's metrics.
- Prometheus actively extracts metrics from the observed application by sending requests, making it different from systems like Graphite, which wait for data to be sent.
- If an application cannot provide Prometheus metrics on its own, you can use special tools called exporters to extract and issue metrics in Prometheus format.
- You can integrate monitoring into your Flask app using the Prometheus Client, which is the official Python client library for Prometheus.
Overview
Prometheus, unlike Graphite, does not wait until the data is sent to it. Instead, it actively extracts metrics, sending requests to the observed application. The application should respond to it with a set of metrics in text format. Prometheus uses its query language to deal with these metrics.
If an application can not provide Prometheus metrics on its own due to third-party systems, there is a list of special tools called exporters. They extract metrics from the application and issue them on request in the Prometheus format.
The application and the exporter are separated in this case, and changes within the application do not affect the issuance of metrics. If we create our own application, we can use any of these options. But if we run someone else’s application, we may not be able to change its code.
If we want our application to generate metrics on its own, we can add tools for this in our code using a special tool - the client library. They can be officially from the creators of Prometheus or written by other people. Prometheus Client is the official Python client library.
We will be using Flask Prometheus Metrics, which is another library based on the official client and adapted specifically as a metrics exporter for monitoring Flask apps. It provides some essential metrics from a web application that any host wants to have.
Example
We will start by creating a directory for this project. Let’s name the folder “monitoring_flask_app”. We’ll be creating all subsequent files and subfolders in this main folder.
Prometheus
We need Prometheus running to use this app. The easiest way to use Prometheus is through the Docker image. All you need to have installed for this tutorial is Docker and Docker Compose.
Let’s create a Docker Compose config for our Prometheus as shown below.
version: "3"
services:
 prometheus:
      image: prom/prometheus:latest
      ports:
      -9090:9090
As a side note, we don’t necessarily need Docker Compose for this step. We have only one container and not many rules, so we could simply run the command in the terminal for Docker itself. However, as we are going to expand our configs through this article, this first step is necessary.
At the moment, we only use the official Prometheus image and open port 9090 for the container with Prometheus. We can run this container with the following command:
docker-compose up
By default, Prometheus listens to itself. We can go to the URL http://localhost:9090/targets and see that http://localhost:9090/metrics is the only target/endpoint.
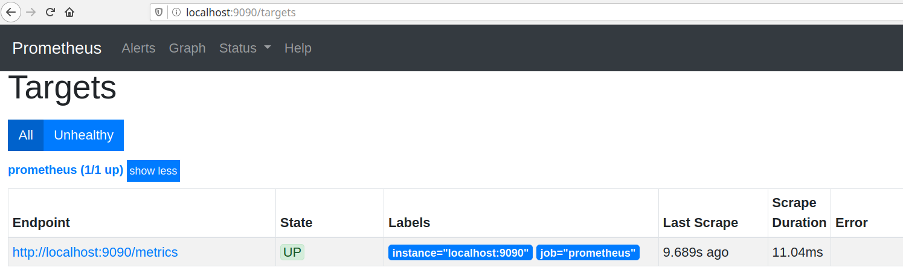
We also see a list of available metrics at http://localhost:9090/graph in the drop-down menu.
Prometheus is looking for a config file at “etc/prometheus/prometheus.yml”.
By default, it’s config looks something like this:
global:
 scrape_interval:     15s
 evaluation_interval:  15s

scrape_configs:
 -job_name: prometheus
  static_configs:
   - targets:['localhost:9090']
That's why we see how it looks for its own metrics.
Let’s get control over it by changing this config. First, we create the “prometheus.yml” file in the same directory as our Docker compose configuration. For now, we can copy the above default content here.
Secondly, we’ll change our Docker-compose file and add volume for the Prometheus config pointing to the “/etc/prometheus” folder.
version: "3"
services:
  prometheus:
       image: prom/prometheus:latest
       ports:
       -9090:9090
       volumes:
       -"./prometheus.yml:/etc/prometheus/prometheus.yml"
If we rerun the container now using the command “docker-compose up”, we won’t see any changes which are to be expected.
Running an app
It’s now time to run our Flask app to be monitored by Prometheus. Let’s put it in the second container.
We need to create a directory for it within the “monitoring_flask_app” directory. For example, you can name the folder “my_flask_app”. Next, we also need to add two files to it: Dockerfile (because we are not going to use an image this time) and app.py.
Right now, our project structure will look like this:
monitoring_flask_app
  -   docker-compose.yml
  -   prometheus.yml
  -   my_flask_app
        -    Dockerfile
        -    app.py
Dockerfile should contain the following:
FROM python:3.8.2-alpine

RUN pip3 install --upgrade pip && pip3 install --no-cache-dir Flask flask_prometheus_metrics

EXPOSE 5000

CMD ["python", "app.py"]
This gives instructions to install Flask and flask_prometheus_metrics libraries on Python and gives instructions to run our app.
Into app.py we are going to copy the code found in the flask_prometheus_metrics library description. But we need to change the hostname from “localhost” to “0.0.0.0” because localhost points inside a container at the moment.
You can copy/paste the below example:
from flask import Flask
from prometheus_client import make_wsgi_app
from werkzeug.middleware.dispatcher import DispatcherMiddleware
from werkzeug.serving import run_simple
from flask_prometheus_metrics import register_metrics

app = Flask(__name__)

@app.route("/")
def index():
  return "Test"

# provide app's version and deploy environment/config name to set a gauge metric
register_metrics(app, app_version="v0.1.2", app_config="staging")

# Plug metrics WSGI app to your main app with dispatcher
dispatcher = DispatcherMiddleware(app.wsgi_app, {"/metrics": make_wsgi_app()})

run_simple(hostname="0.0.0.0", port=5000, application=dispatcher)
It’s time to configure docker-compose again by adding “app”:
version: "3"
services:
 prometheus:
      image: prom/prometheus:latest
      ports:
      -9090:9090
      volumes:
      -"./prometheus.yml:/etc/prometheus/prometheus.yml"

 app:
      container_name: app
      build: ./my_flask_app/.
      ports:
      -"5000:5000"
      volumes:
      -"./my_flask_app/app.py:/app.py"
We can now rerun Compose and go to http://localhost:5000 and http://localhost:5000/metrics and see results.
You may want to use the “docker-compose build” command first to build your app image from Dockerfile. “Localhost” will work from a browser outside Docker.
Prometheus does not scrape our app’s metrics yet. Let’s fix it.
Go to the prometheus.yml and make these changes
global:
 scrape_interval:      15s
 evaluation_interval: 15s

scrape_configs:
 -job_name: 'my-flask-app'
  scrape_interval: 5s
  static_configs:
   - targets: ['app:5000']
We point to the container name as the host, because that is how Docker containers can communicate with each other.
Now everything should be fine. If we run “docker-compose up” we will see http://localhost:5000/metrics in Prometheus targets and some new metrics in the graph menu.
Flask app inside
Let’s expand our app a bit. This time we will use this file (can also be seen below). It has a more productive look to it. The code has several distinct parts, so you can split them into different files when you make your own app.
For now, we can leave it as is but add some more routes.
Note: Don’t forget to change the “host” parameter for execution in Docker as seen in the example below, near the bottom (e.g. "0.0.0.0").
from flask import Blueprint, Flask
from prometheus_client import make_wsgi_app
from werkzeug.middleware.dispatcher import DispatcherMiddleware
from werkzeug.serving import run_simple

from flask_prometheus_metrics import register_metrics

#
# Constants
#

CONFIG = {"version": "v0.1.2", "config": "staging"}
MAIN = Blueprint("main", __name__)


#
# Main app
#


@MAIN.route("/")
def index():
       return "This is the main page."


@MAIN.route("/banana")
def banana():
       return "A banana is an elongated, edible fruit – botanically a berry – produced by several kinds of large herbaceous flowering plants in the genus Musa."


@MAIN.route("/apple")
def apple():
       return "An apple is an edible fruit produced by an apple tree (Malus domestica). Apple trees are cultivated worldwide and are the most widely grown species in the genus Malus."


@MAIN.route("/dragonfruit")
def dragonfruit():
       return "A pitaya (/pɪˈtaɪ.ə/) or pitahaya (/ˌpɪtəˈhaɪ.ə/) is the fruit of several different cactus species indigenous to the Americas. Pitaya usually refers to fruit of the genus Stenocereus, while pitahaya or dragon fruit refers to fruit of the genus Hylocereus, both in the family Cactaceae."


def register_blueprints(app):
       """
       Register blueprints to the app
       """
       app.register_blueprint(MAIN)


def create_app(config):
       """
       Application factory
       """
       app = Flask(__name__)

       register_blueprints(app)
       register_metrics(app, app_version=config["version"], app_config=config["config"])
       return app


#
# Dispatcher
#


def create_dispatcher() -> DispatcherMiddleware:
       """
       App factory for dispatcher middleware managing multiple WSGI apps
       """
       main_app = create_app(config=CONFIG)
       return DispatcherMiddleware(main_app.wsgi_app, {"/metrics": make_wsgi_app()})


#
# Run
#

if __name__ == "__main__":
       run_simple(
       "0.0.0.0",
       5000,
       create_dispatcher(),
       use_reloader=True,
       use_debugger=True,
       use_evalex=True,
       )
We need to use the above code to replace the previous code in the app.py file. You can run Compose again and navigate to our new routes in the browser: http://localhost:5000/apple, http://localhost:5000/banana, and http://localhost:5000/dragonfruit.
At this point, we can connect to MetricFire’s Hosted Prometheus service. We need to first log in and follow this link. Then we will add the proposed strings with settings to our “prometheus.yml” file. As a final step, we’ll restart Docker.
Grafana
It’s time to add Grafana to our project. We are going to use the prometheus-client-python-app-grafana-dashboard repository for this. This repository was also linked to the flask_prometheus_metrics repository we were following earlier.
We assume that you have already registered and signed in to MetricFire services. So if you haven't, you should do it first by signing up for their 14-day free trial (if you want to follow the steps that we will show you in our tutorial).
After logging in, on https://www.hostedgraphite.com navigate to “Dashboards” and choose “Grafana”. Here we are looking for the “Import” tab, you can find it on the “+” icon.
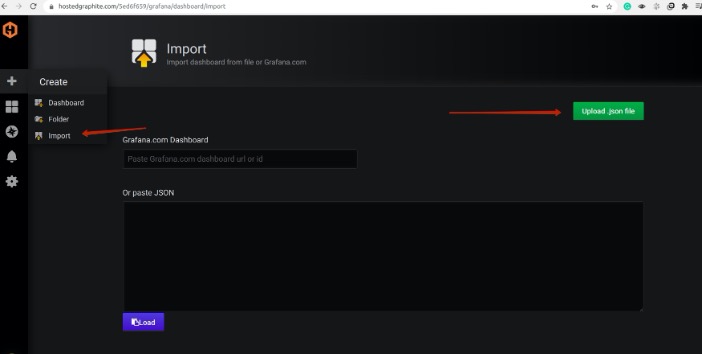
We are now on a page that offers to add JSON either with copy and paste or upload a text file. We are going to put this file here.
But before you do so, you may need to edit some parameters in it (examples can be seen below). The author of this application used Kubernetes. If we don’t use Kubernetes, we need to adapt this dashboard’s JSON according to this. You can learn more about how JSON is used in Grafana for storing dashboard metadata here. But for now, we’ll focus on those fields we need to change.
You should make these changes in a text file before you load JSON to your Grafana. If something doesn't work after you make an import, you can navigate to “Dashboard settings” with the icon in the top right corner, and then to “JSON Model”. There you can edit the model and save it.
You’ll need to refresh the dashboard after editing and saving.
The first thing we will focus on is the “panels” list. Here, data about any of our graphs is stored in objects. We also need to find a “targets” list for each graph object. If you use this file, there should be 12 by default. Here look for “expr” and "legendFormat" strings.
“Expr” is a formula for our chart, and it uses metrics that we can find in Prometheus http://localhost:9090 with parameters specified there. “LegendFormat” points to variables for the legend.
For every instance of the “targets” list, let’s change every “pod” in "legendFormat" to “instance”. You may also need to change “endpoint” to “exported_endpoint” in "legendFormat".
Next, change “pod” to “hostname” everywhere else in the file, except the label's texts. In most cases, it will be the “expr” string.
Here is an example of one of the instances of a “targets” list:
        "targets": [
         	{
      	               "expr":
                "rate(app_request_latency_seconds_sum{hostname=~\"$hostname\",
                 exported_endpoint=~\"$endpoint\", method=~\"$method\"}[$interval]) \n/
                 \nrate(app_request_latency_seconds_count{hostname=~\"$hostname\",
                 exported_endpoint=~\"$endpoint\", method=~\"$method\"}[$interval])",
        	        "format": "time_series",
      	                "interval": "",
      	                "intervalFactor": 1,
      	                "legendFormat": "{{ method }} {{ instance }}{{ exported_endpoint }}",
       	                "refId": "A"
    	         }
        ],
For Python Version target (if using this file, it is the default 12th “targets” list in the code, should be around line 1134), change “expr” from "python_info{pod=~\"$pod*\"}" to "python_info{hostname=~\"$hostname\"}" without the “*” symbol.
        "targets": [
    	        {
      	                 "expr": "python_info{hostname=~\"$hostname\"}",
      	                 "format": "time_series",
      	                 "interval": "",
      	                 "intervalFactor": 1,
      	                 "legendFormat": "{{ implementation }} {{ version }}",
      	                 "refId": "A"
    	         }
  	 ],
You may also want to change the text in the "title" and "description" strings located just under the “targets” lists. With various deployment options, all these changes would be different too.
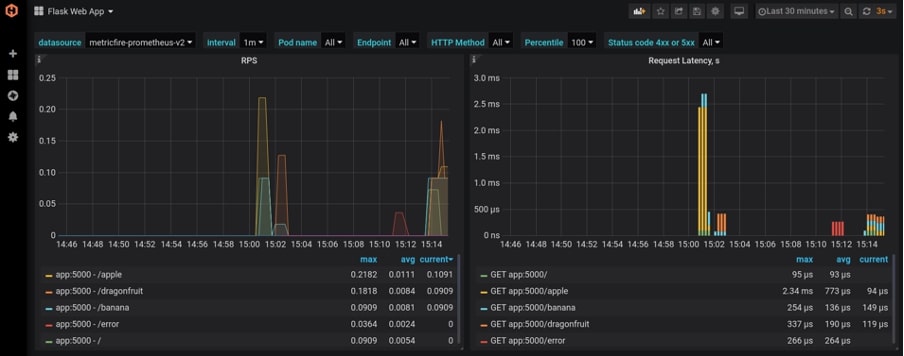
After all these actions, we should now see our graphs in the “Flask Web App” dashboard. Don’t forget to choose “Prometheus-v2” from the dropdown menu in the left top corner!
Visit (http://localhost:5000, http://localhost:5000/apple, http://localhost:5000/banana, and http://localhost:5000/dragonfruit) several times and you will see changes in the dashboards.
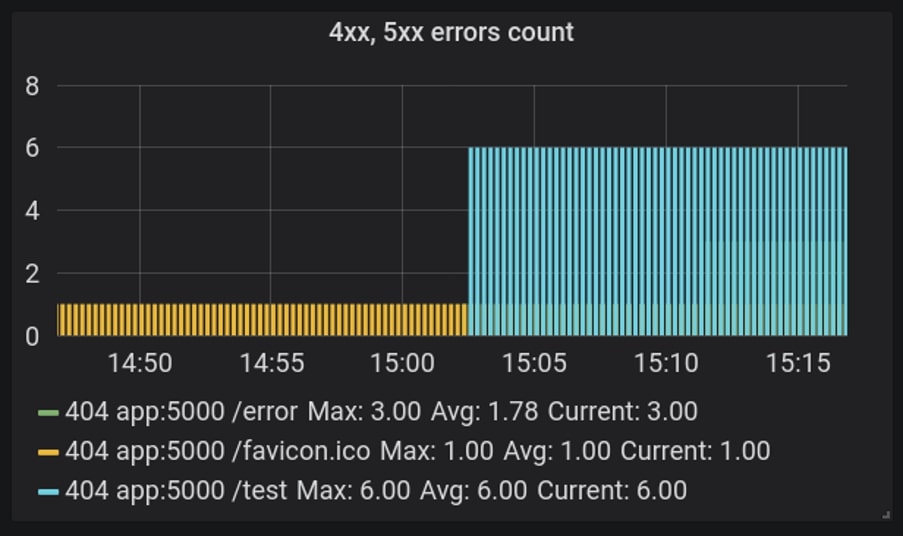
You can also make requests to some routes that don't exist like http://localhost:5000/test and http://localhost:5000/error to play around with error graphs.
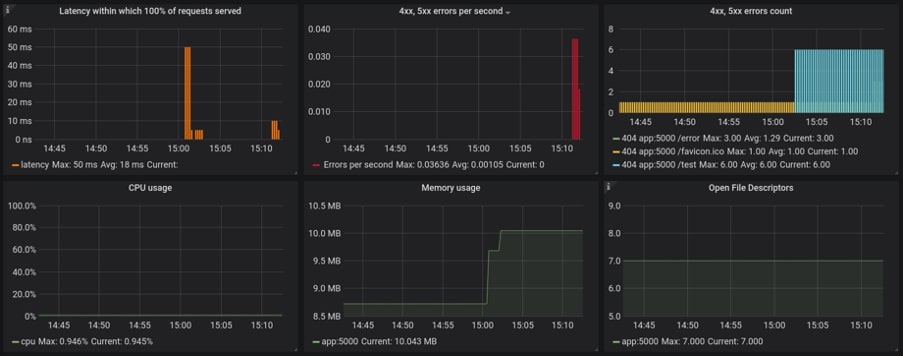
Some browsers make requests to the “favicon.ico” address. In our app, it would appear as errors shown below:
Conclusion
We looked at a very simple version of metric visualization and monitoring Flask applications with Prometheus and Grafana. If you are familiar with Flask, we hope you can expand the application to suit your needs. For API-driven applications, DreamFactory offers a self-hosted platform providing governed API access to any data source, which can be instrumental in connecting your Flask monitoring infrastructure with backend systems and enterprise applications.
If you have questions about adapting Grafana visualizations, book a demo to speak with one of our experts, or jump straight in with a 14-day free trial!

