
Table of Contents
- Overview
- Let’s take a look at Graphite
- Let’s take a look at Prometheus
- What’s the experience of using each service like?
- So, what’s the best tool for you?
- Further reading
Great systems are not just built. They are monitored.
MetricFire runs Graphite and Grafana as a fully managed service for growing engineering teams, taking care of storage, scaling, and version updates so your team doesn't have to. Plans start at $19/month, billed per metric namespace rather than per host, and include engineer-staffed support. Integrations work natively with Heroku, AWS, Azure, and GCP, and data is stored with 3× redundancy in SOC2- and ISO:27001-certified data centres.
Graphite and Prometheus seem pitted head-to-head in the world of monitoring right now. Both are solid options, but there are key differences between the two that users should keep in mind when making a decision.
Here, we break down the most important distinctions and look at how the experience of using each service compares.
And remember, you can try them out yourself on our free trial of Hosted Graphite within a few minutes.
Overview
Prometheus and Graphite are both open-source projects built around a time series database. This means all data points are labeled with names and/or tags that identify them as part of a unique time series. Prometheus has always supported tagging (called labels, in Prometheus terms), and Graphite introduced tags near the start of 2018.
The most obvious difference between Prometheus and Graphite when you first start using them is that where Prometheus reaches out to request metrics from target endpoints, Graphite passively receives anything it’s sent, provided the formatting is correct. This is referred to as Pull metrics vs Push metrics, models that form the core of many other distinctions between the services.
Let’s take a look at Graphite
Graphite has been around for a decade and there’s a reason for that – what it lacks in frills, it makes up for in useability and widespread support. That said getting the server up and running can be a little awkward at times.
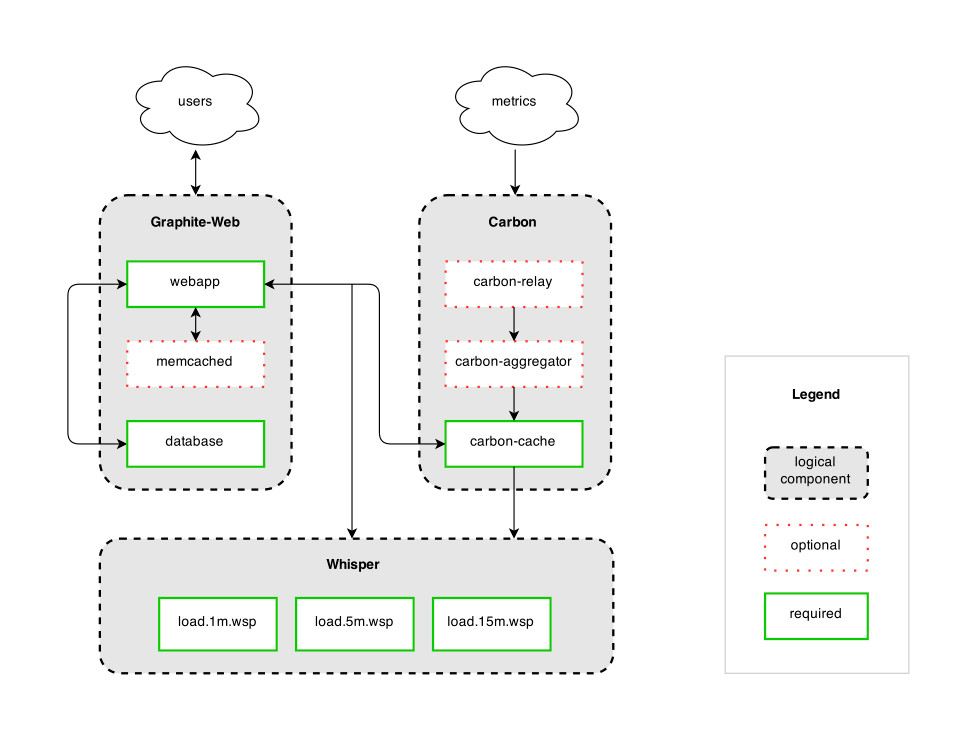
Graphite has a much simpler architecture than Prometheus because of its reduced scope, and is split up into 3 distinct parts:
- Receive data points: Graphite has 3 carbon daemons that handle receiving metric data points, with options to transform and aggregate data points into new metrics, or to provide a relay to pass data to multiple storage backends. Carbon passively receives metrics in various protocols and has no requirements for them other than a simple string format. That allows metrics to be generated easily within an application and sent immediately and quickly by UDP, more reliably by TCP, or batched and bundled as line-separated data points or in a python pickle object.
- Store datapoints: vanilla Graphite stores metrics in the Whisper database format, which can be run locally or remotely. Carbon-relay handles replication or consistent hashing for sharded metric storage for redundancy and increased capacity. Whisper requires the total storage timeframe to be determined upfront, including rules for rolling up resolutions over time. Once the storage criteria are determined the file is created, so the total amount of space used is taken up immediately and doesn’t change.
- Present data: Graphite uses a simple Django app to display graphs of metrics, query and transform them using Graphite functions, and provide a render API to give access to external services like Grafana. For teams managing complex data integrations across multiple systems, Integrate.io can help orchestrate data pipelines and transformations that feed into your monitoring infrastructure.
Let’s take a look at Prometheus
Prometheus on the other hand is a direct descendant of Google’s Borgmon tool and was developed by engineers dealing with highly containerized environments. It was made by SREs for SREs, which means it has some really nice features but also presumes a higher degree of specialized knowledge and access to make the best use of it. It’s easy to install and get running, though integrating it with existing services can be less intuitive.
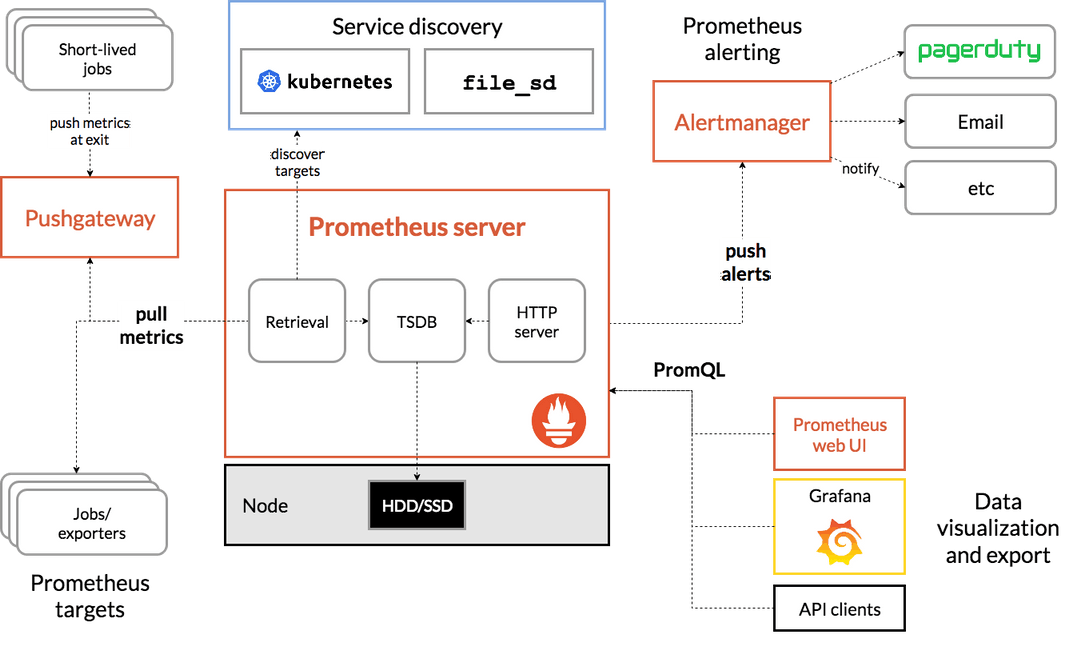
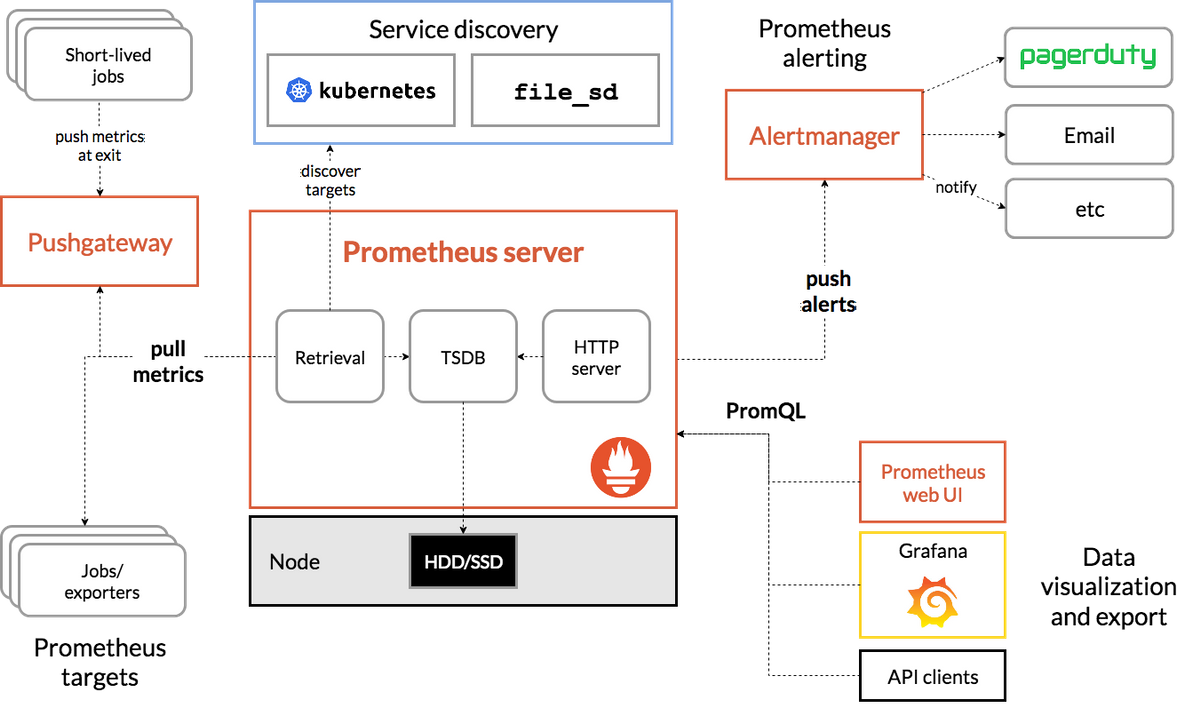
Prometheus isn’t so simply divided into parts, but it still has a similar selection of tasks it undertakes to get the job done.
- Retrieve datapoints: Prometheus connects to target endpoints to request metrics via HTTP; the service being monitored is responsible for serving the metrics on request, similarly to a REST API. The Prometheus configuration file contains a list of jobs that tell Prometheus what metrics it should be retrieving. The jobs can either contain static configurations which include the endpoints or configure service discovery which will tell Prom where to look for the metrics.
- Store data points: Prometheus stores metrics in a single location on the local disk. It can do some transformations before metrics are stored, if needed, using “recording rules” set in the configuration. Metrics are stored in memory until they can be converted into 2-hour blocks initially, and compacted into longer-term blocks later. The default retention is 15 days - Prometheus presumes that this is a sliding window of data rather than long-term storage.
- Present data: Prometheus provides a graphical interface that lets users explore metrics using the Prometheus query language (PromQL), and draw simple graphs. It also provides a view of the endpoints being monitored, a view of any alert rules and their current status, and a quick way to check the current configuration. The query API also allows a third-party application like Grafana to request metric data using PromQL.
- Alerts: Prometheus has built-in alerts, unlike Graphite, though they’re limited to checking alerting rules and displaying the alert state on a page in the UI. AlertManager is a separate tool that can handle alert notifications for multiple Prometheus servers at once.
What’s the experience of using each service like?
Writing applications to be monitored
Developers are often required to make their applications observable, even if they aren’t the ones who’ll be actively monitoring them once they go live.
Graphite
Pros:
- Adding a line to your application code to send a graphite-format datapoint is easy and relatively intuitive. Some modules and libraries exist to help with this, but it’s straightforward to write your own and not have any dependencies to maintain. The Hosted Graphite language guide has some examples.
Cons:
- If your application is very active it can send a lot of data points in a very short timeframe which might overwhelm Graphite’s ingestion processes (this is most common in high-frequency batch services).
- There can be firewall issues if there’s a restriction on outbound traffic, which is more common than you might expect.
Prometheus
Pros:
- There are some good client libraries that allow you to add Prometheus metrics to your code, which deal with creating a /metrics endpoint and serving the data upon request. There are also guidelines for writing exporters.
- Once it’s set up you won’t need to change the configuration of your app even if the Prometheus instance moves.
Cons:
- Client libraries mean additional dependencies to keep track of, plus you’ll require a Prometheus administrator to configure a job to retrieve your metrics if you aren’t maintaining your own monitoring server.
- The Prometheus server needs to have access to make connections with the server or container your application runs on, and ideally, it should be discoverable via service discovery, all things which the application developer might not have direct control over.
- If your application is a short-lived or batch service you might need to get Prometheus’ Pushgateway set up for you, which effectively allows Prometheus to mimic what Graphite already provides.
Monitoring a single environment, e.g. container cluster
An engineer or SRE team who is responsible for monitoring the environment applications run in and their performance, including those they haven’t written themselves.
Graphite
Pros:
- There are many monitoring agents that will send Graphite-format metrics to any endpoint they’re given, e.g. collectd, Diamond, Telegraf.
- The hierarchical metric naming format can do a good job of logically reflecting the general structure of an environment (environment -> nodegroup -> server -> service) however Graphite also supports tagging for multi-dimensional metrics if needed.
- Metrics can be sent from anywhere to a central Graphite server, with a storage cluster for redundancy.
Cons:
- Default dotted-hierarchy metric names from most monitoring agents include the hostname, which means that if the hostname changes (e.g. from container scaling or restarting AWS EC2 instances) then a whole new set of metrics is created.
- If metrics stop being received, the precise meaning of that is unclear - is there a problem sending the metrics, or has the metric stopped being generated?
- Similarly, new servers/services can be started up which have issues sending their metrics, but until the metrics have been received at least once, there’s no way to know they’re missing automatically.
- Alerting has to be handled completely separately, e.g. Grafana alerts, Cabot, etc. Not all containers have access to send metrics externally.
- There aren’t many monitoring agents for containers that also work well with Graphite. The frequency of ‘hostname’ changes in a cluster or swarm can inflate the metric count with irrelevant data.
Prometheus
Pros:
- Depending on the environment there is a variety of monitoring agents which support Prometheus, including cAdvisor which is one of the main tools for monitoring Docker containers.
- Getting the list of endpoints to scrape can be handled by service discovery - Prometheus was built for Kubernetes, and the containers in k8s pods and nodes are continually changing, but k8s can provide a list of the endpoints at any given moment.
- Scrape jobs mean if the metrics stop flowing it can be easy to discover whether the endpoint has stopped responding - endpoint status are constantly monitored.
- Access to the endpoints is handled by running Prometheus locally, so no external firewall issues are likely to arise.
Cons:
- Service discovery is supported for a limited number of services, but after that, you’re required to either use DNS-based discovery or generate a file with the details in it. That’s a whole specialized service to create and maintain if you’re not monitoring something standard.
- Either limited timeframe metric storage, or using resources in your environment.
- No redundancy if there’s an issue with the cluster since everything is running within it. Running outside the cluster may incur additional costs and/or have access issues for services within containers.
- It’s difficult to run as a service for other teams across a global organization. This is covered in the section below (monitoring multiple environments/locations).
Monitoring multiple environments/locations
An SRE or Monitoring team is responsible for monitoring not just one environment, but multiple environments in different physical locales and networks.
Graphite
Pros:
- No access or permission issues are provided each location/environment can be granted the ability to send outbound data.
- The metrics may be generated all over the world, but you only need to go to one place to look at them.
- Every environment can use whatever setup they like for monitoring or generating their metrics, no need for a specialist in each development team.
Cons:
- If the Graphite endpoint moves or changes, the new value needs to be rolled out to the whole fleet, and appropriate services restarted to pick it up.
- There may also be a need to restrict outbound traffic generally for security compliance, which can interfere with sending data points to an endpoint outside the network. These issues can both be handled by using local carbon-c-relay or statsd servers, which would also reduce the number of places that needed to be reconfigured, but increase the number of different services to maintain.
Prometheus
Pros:
- All the benefits of a single environment setup.
- Prometheus installation and configuration can be automated easily, and that makes this kind of multi-site setup easy to maintain.
Cons:
- Often environments need to be logically separated, and since Prom needs access to make HTTP connections into each service, it usually needs to be run inside the same network as the service.
- It’s possible to consolidate metrics in one place by using Prometheus federation but that usually means downsampling or aggregating metrics, since the volume of data being transferred can easily become too much to transfer it all to a central point. For SREs that may not be an issue since they have direct access to services in each environment, but for non-SREs access to view, the metrics may be difficult to get, especially for an application that runs in multiple environments/physical locations.
Looking at graphs, browsing metrics, setting alerts, etc.
A business analyst, salesperson, support agent, or other user looking to extract meaning from data they may have had no involvement in generating. This is really the least ideal situation for Prometheus since it’s built to be a full monitoring system.
Graphite
- Graphite has a huge selection of functions accumulated over years, suited to all sorts of fields - monitoring and (limited) anomaly detection, but also business intelligence and performance analysis.
- The Graphite query language is simply formatted and familiar to anyone who has done even a tiny bit of programming. Even without that, it’s very easy to pick up.
- Hierarchical metrics and auto-complete support mean browsing metric names is much easier for people without direct knowledge of the systems generating them. Tools like Grafana do a good job of making functions as browseable as metrics.
- Graphite needs a separate alerting service, but for casual users, Grafana’s alerting service is often sufficient.
Prometheus
- PromQL isn’t based on any particular language or pre-existing structure, so it requires learning from scratch. It’s not too complex, but it’s not as straightforward as Graphite’s functions. However more complex, multi-series queries retain readability while Graphite’s nesting can get quite confusing.
- Poor metric browsing since there’s no hierarchy, and Prom itself doesn’t do much to help. Functions and keywords seem to do the same thing but are used differently; there’s no ability to browse available tags for a metric without retrieving it, and there’s no ability to browse available values for a tag.
- There’s a strong presumption that you’ll already know what metrics and labels exist and what they mean, which is reasonable for some users but not others.
- Might have to log into a bunch of different Prometheus servers to get all the data needed, depending on where they run, if they’re federated and what metrics are being federated.
- Might need older metrics - remote_write and remote_read help with that, and you can outsource the storage to a service like MetricFire.
So, what’s the best tool for you?
To sum up, the choice between Prometheus or Graphite depends on your precise scenario. In this article, we’ve looked at how both tools work, their similarities and differences, and the pros and cons of both tools for four major use cases.
As we’ve seen, each tool has its own positives and negatives, meaning that the right choice depends on your particular use case and setup.
If you’d prefer a hosted version, we offer Graphite as-a-service, with a 14-day free trial.
Still need help deciding? We're happy to jump on a call with you - you can book a demo here!