
Table of Contents
Great systems are not just built. They are monitored.
MetricFire runs Graphite and Grafana as a fully managed service for growing engineering teams, taking care of storage, scaling, and version updates so your team doesn't have to. Plans start at $19/month, billed per metric namespace rather than per host, and include engineer-staffed support. Integrations work natively with Heroku, AWS, Azure, and GCP, and data is stored with 3× redundancy in SOC2- and ISO:27001-certified data centres.

Introduction
In today’s world, with many microservices fueling hundreds of components, the failure of just one piece can cause a crash for the whole system. The solution is to constantly monitor key characteristics like RAM usage, number of requests, number of exceptions, and storage space.
For these purposes, there are open-source monitoring systems and tools like Prometheus and ELK (Elasticsearch, Logstash, Kibana) stack. In this article, we review these two popular monitoring systems for features, advantages, disadvantages, differences/similarities, what to choose, and why Hosted Graphite might be a better alternative for you than these other open-source tools.
Check out MetricFire’s free trial, or book a demo to find out more.
Key Takeaways
- It is crucial to monitor your system because the failure of a single component in a system of many microservices can crash the entire system.
- Open-source monitoring systems like Prometheus and ELK stack are available for these purposes.
- Hosted monitoring solutions like Hosted Graphite from MetricFire can provide more value and features than open-source solutions.
- Prometheus is suitable for smaller-scale environments but has limitations like no long-term data storage or reliable user management, while ELK stack is suitable for log management and analysis.
Prometheus Monitoring System
Prometheus is an open-source monitoring and alerting system that pulls metrics from application services, servers, and other target sources. You can read more detailed information about Prometheus in MetricFire’s article Prometheus Monitoring 101.
Prometheus advantages
- Provides service discovery that is greatly integrated with Kubernetes, finding all services, and pulling metrics from Prometheus endpoints.
- Prometheus always works, even if other parts of the infrastructure are broken. No need to install agents - your Prometheus installation can already pull metrics.
- No extensive setup up needed.
- Allows fast outage discovery. Outages can be very quickly discovered when the system fails to get requests from known monitoring sources.
- Provides a functional query language, PromQL, that allows us to select and aggregate time-series data in real time. It can apply subqueries, functions, and operators. It can filter and group by labels, and use regular expressions for improved matching and filtering.
- Ensures simple reconfiguration. Configuration can be changed via the command line. For example, immutable system parameters, such as storage locations or computer’s disk and in memory (a quick example: the amount of data to keep on your Mac), and configuration files, such as jobs, instances, or which rule file to load. Changing configuration automatically applies to all monitoring services.
- The load Prometheus places on monitored services and the network is low since metrics are stored in memory as they are generated, and converted to a readable format, and Prometheus receives them by request (every 15 seconds by default), regardless of how many events are being generated.
- The Prometheus architecture design system provides operational simplicity. Limited to a single node, Prometheus avoids clustering. Clustering brings operational complexity.
Prometheus disadvantages
- Monitoring limits (required to increase server storage capacity or to limit the number of metrics).
- Does not offer reliable long-term data storage, anomaly detection, horizontal scaling, and user management. Basically, these requirements are vital mostly for large-scale enterprise environments. These disadvantages are resolved by MetricFire as they provide storage hosting, user management, and more.
- Requires a bit of a workaround when it comes to push-based solutions for collecting metrics for short-lived jobs. Also, some workarounds can be made via Pushgateway since these metrics are only available for a short period of time.
- Prometheus is not a dashboard solution. The Prometheus Expression Browser provides simple visualizations, but using Grafana for dashboarding is required when using Prometheus for monitoring.
- Prometheus is open-source, so you'll have to install and maintain it yourself. Investing in Hosted Graphite from MetricFire is easier. It provides more value than open-source Graphite for monitoring Kubernetes with extra features such as redundancy storage, tagged metrics, and control by APIs.
Another thing to consider when running your monitoring system is whether you’ll choose in-house or hosted. In-house can be extremely time-consuming, especially when the monitoring system decides to fall over right in the middle of your busy day.
For this reason, we have MetricFire. You can stack your monitoring with MetricFire's Hosted Graphite, which is an effective hosted tool for monitoring Kubernetes.
If you're interested in trying it out for yourself, sign up for our free trial. You can also sign up for a demo and we can talk about the best monitoring solutions for you.
ELK (Elasticsearch Stack: Elasticsearch, Logstash, Kibana)
ELK stack is a combination of three open-source tools that form a log management platform that specializes in searching, analyzing, and visualizing logs generated from different systems.
Logstash features
Logstash receives logs and events from one or more sources, then processes and transforms them into one or more stashes. We can have multiple pipelines running within the same Logstash instance. This means that Logstash is horizontally scalable.
Logstash can also:
- Provide a data pipeline tool with a Pipeline Management user interface (UI) that allows users to control deployments with a single UI.
- Centralize data processing.
- Collect, parse, and analyze a large variety of structured and unstructured data and events.
- Provide plugins to connect to various types of input sources and platforms.
- Decipher geo coordinates from IP addresses.
- Anonymize PII data, absolutely preventing access to sensitive fields.
Elasticsearch features
Elasticsearch is the core of the ELK stack. It is a NoSQL database providing distributed data storage. It provides detailed analyses by offering different query types such as structured, unstructured, geo, and metric data.
Elasticsearch can also:
- Provide search engine/ search server possibilities.
- Provide full-text search.
- Use standard RESTful API and JSON, as it’s based on Apache Lucene.
- Provide schema-free, REST, and JSON-distributed data storage.
- Provide horizontal scalability, reliability, and capability for real-time search.
- Use indexes to search, increasing search speeds.
- Provide security, monitoring, alerting, anomaly detection, anomaly prediction, graph exploration, and reporting features.
Kibana Features
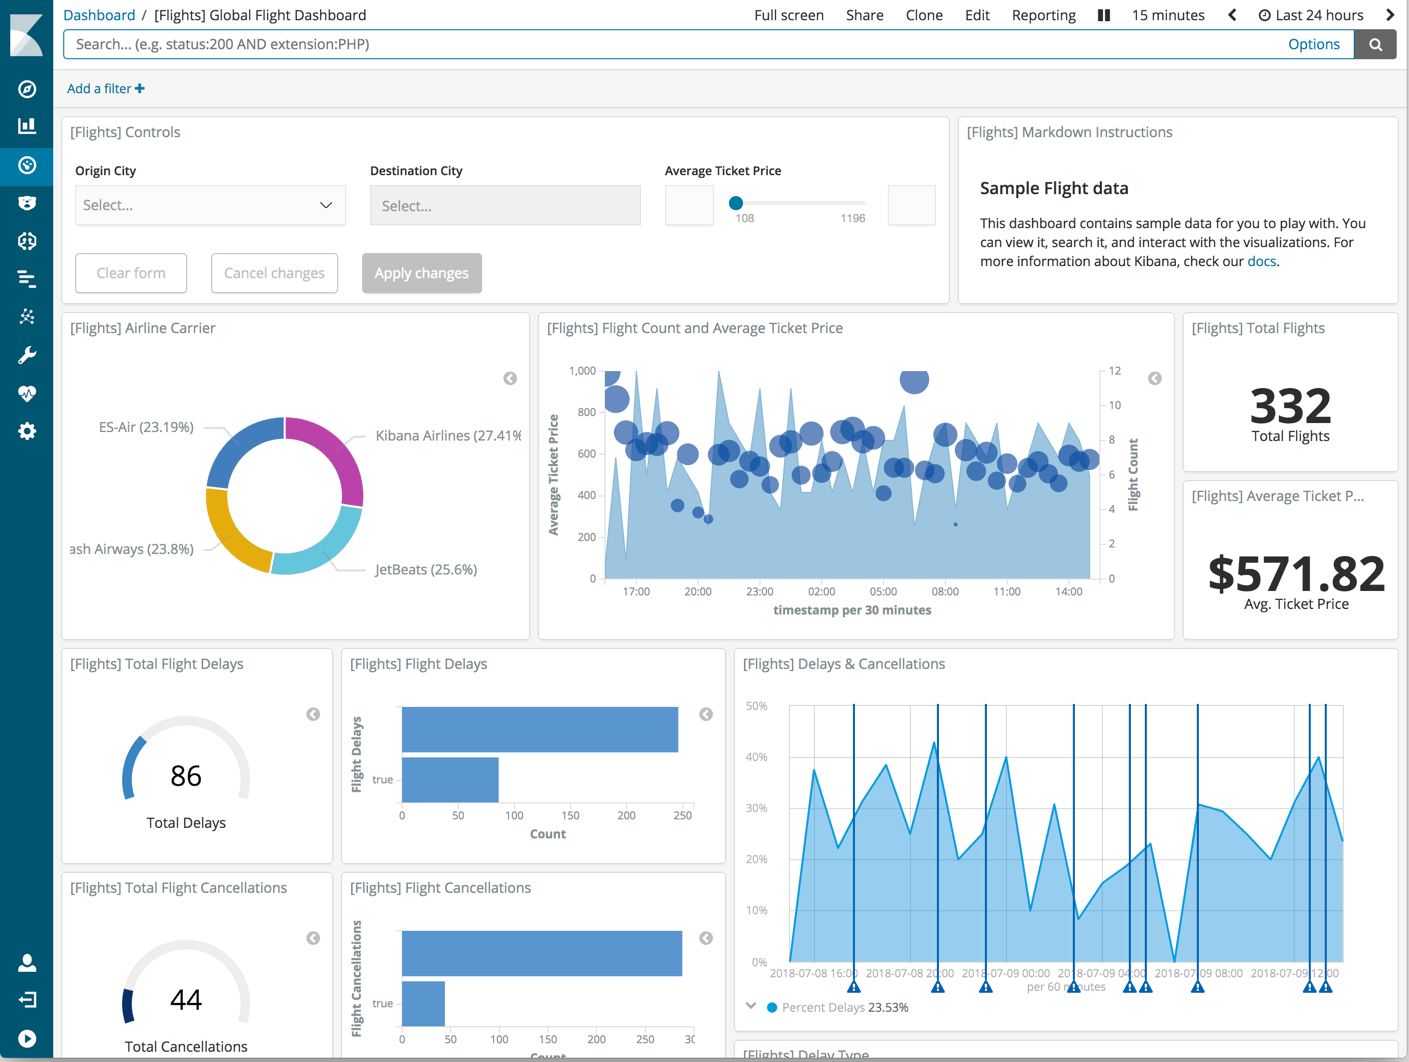
Kibana is the visualization tool that pairs with Elasticsearch and Logstash. Kibana is the best visualization tool to use for Elasticsearch logs, but data can also be exported from Elasticsearch to Grafana for more advanced metrics visualization. Kibana is fully set up with everything you need to handle Elasticsearch visualization.
Kibana can also:
- Provide real-time analysis, summarizing, charting, and debugging capabilities.
- Provide an instinctive and user-friendly interface.
- Allow snapshots sharing: share the link or export it to a PDF or CSV file and send it as an attachment.
- Allow setting geo data on any map using Elastic Maps Service to visualize geospatial data.
- Save dashboards and you can manage multiple dashboards.
Beats
ELK uses Beats, a collection of so-called data shippers, lightweight agents that you can install on servers with a single purpose - send data to Logstash or Elasticsearch. For example, there are Auditbeat for Linux audit logs, Filebeat for log files, Packetbeat for network traffic, and so on.
For specific tasks, there are nearly 100 community-contributed Beats or you can create your own Beat using a Beat library written entirely on Go.
ELK advantages
- Provides great insight into your distributed system with one ELK instance without the need to connect to hundreds of log data sources.
- Developed on Java, Elasticsearch is compatible with almost every platform.
- Elasticsearch is real-time. It means that an added document is available to explore after just seconds.
- Elasticsearch develops and supports clients in many languages such as Java, Python, .NET, SQL, and PHP. Plus the community has contributed many more.
- Provides a bunch of SDKs for different programming and scripting languages.
- Ability to scale vertically and horizontally.
ELK disadvantages
- Not so easy installation - what configuration you need, and what hardware is required by your ELK system is not always clear.
- Not a quick installation. Sometimes a company needs fast solutions for its problems but installing, setting up, and tuning ELK systems can take a lot of time.
- A lot of time may be spent to provide reliability. Due to Logstash and Elasticsearch being memory intensive, you need to do a lot of work to prevent Elastic nodes from going down. Companies require an expert team to guarantee reliability and resiliency.
If you're interested in using Prometheus, but the setup and management of it would be too resource-consuming, book a demo and talk to us about how our Hosted Graphite solution can fit into your monitoring environment. You can also get right onto a free trial, and check it out now.
Prometheus vs. ELK
Both monitoring systems, Prometheus and ELK stack, have similar purposes. Their goals are detecting problems, debugging, and solving issues. However, these systems use different approaches to this task.
The biggest difference is that ELK specializes in logs, and Prometheus specializes in metrics. Most major productions require using both ELK and Prometheus, each for its own specialty.
Prometheus vs. ELK: the similarities
- Both Prometheus and ELK are open-source software. Both projects have large active developer and user communities.
- Both monitoring systems are available as a cloud service or can be operated on-premises.
- Both systems use RESTful HTTP/JSON API access methods.
- Systems support the same range of programming languages: .Net, Java, Python, and Ruby.
- Both systems use sharding methods for storing different data on different nodes.
- Both systems support different alerting options with integrations for email, Slack, or PagerDuty.
- Prometheus and ELK stacks use replication methods for the redundant storage of data on multiple nodes.
- ELK, as well as Prometheus, can be integrated with a lot of different systems. There are big amounts of tools for integration with different databases, storage, APIs, other monitoring systems, and hardware-related integrations.
- The data visualization tools of both systems have great features.
Prometheus vs. ELK: the differences
- The main difference between Prometheus and ELK stack is the scope of use of these two systems. Prometheus is used for metric collection, various systems monitoring, and setting up alerts based on these metrics. ELK is used to take all types of data, perform different types of analytics based on these data, search, and visualize it.
- Prometheus uses TimeSeries DBMS as its primary database model. Actually, ELK stack’s primary database model is a search engine that supports storing different unstructured data types with an inverted index that allows very fast full-text searches.
- Both systems use different types of queries. Prometheus uses its own PromQL which is actually very easy and powerful. ELK provides domain-specific query language based on JSON. Elasticsearch also provides a feature to use SQL-like queries.
- ELK uses a schema-free data scheme. While Prometheus stores data identified by metric name and key/value pairs.
- ELK collects a variety of logs from different sources, analyzes, and stores them. Prometheus collects metrics in a standard format via a pull method over HTTP.
- In the ELK stack, different types of data can be stored, such as numeric, string, boolean, binary, and so on. This lets you keep, analyze, and use data in a more efficient way regardless of the data. Prometheus stores numeric examples of named time series.
- ELK provides more long-term data retention compared to Prometheus. Prometheus stores data locally within the instance, for a default of 15 days. The default 15 days can be configured to any value, with a minimum being 2 hours. Of course, long-term storage within the local Prometheus instance becomes difficult for longer periods. Data storage and computation on one node make operations easier but also make it harder to scale and ensure high availability. As a result, Prometheus is not optimized to be a long-term metric store.
- Additional paid ELK pack, the so-called X-Pack, provides more services: authentication and authorization to both Kibana and Elasticsearch, an alerting system with enhanced features. The machine learning part provides abnormality detection and forecasting.
- Kibana allows analyzing relationships in your data (show related products for example), and visualizations of these relationships. Prometheus has no such extended features in its list, all analysis must be conducted through Grafana.
- Elasticsearch uses a structure called an inverted index allowing very fast full-text searches.
- Elasticsearch Stack security features are quite extensive. The system provides the right access to the right people. Some of the features are encrypted communication (traffic encryption with SSL/TLS certificates), role-based and attribute-based access control, field and document level security, IP filtering, audit logging, etc.
- Elasticsearch provides various features for data management: data backup as a snapshot, source-only snapshot for efficient disk storage usage, and summarizing and storing historical data for feature analysis (rollup indices).
Use ELK in the following cases
- You are doing event logging.
- You need to process large amounts of log data.
- You need long-term data storage.
- You need to have deep insights into a specific event.
- You need a clustered solution.
Use Prometheus in the following cases
- You are primarily doing metrics.
- You need simplicity in setting up monitoring and graphing tools.
- You need to run alerts across various sources.
Conclusion
While Prometheus and Elasticsearch stack are very similar tools for monitoring infrastructure and alerting, these systems generally are deployed for different tasks. The biggest difference is that ELK specializes in logs, and Prometheus specializes in metrics. Most major productions require using both ELK and Prometheus, each for their own specialty.
However, none of these tools are perfect for monitoring. Both programs are open-source, so it is difficult to install and maintain them. We recommend you use Hosted Graphite when monitoring Kubernetes as Hosted Prometheus struggles with this task.
MetricFire specializes in monitoring systems and you can use our product with minimal configuration to gain in-depth insight into your environments. If you would like to learn more about it please book a demo with us, or sign on to the free trial today.


